online | memorias.ioc.fiocruz.br
Polymorphisms in genes
TLR1
,
2
and
4
are associated with differential
cytokine and chemokine serum production in patients with leprosy
Nadja de Lima Santana2,3, Jamile Leão Rêgo2,3, Joyce Moura Oliveira2,
Lucas Frederico de Almeida2, Marcos Braz2,3, Lídia Maria Medeiros Machado1, Paulo Roberto Lima Machado1,2,3, Léa Cristina Castellucci1,2,3/+
1Instituto Nacional de Ciência e Tecnologia em Doenças Tropicais, Salvador, BA, Brasil
2Universidade Federal da Bahia, Hospital Universitário Professor Edgard Santos, Serviço de Imunologia, Salvador, BA, Brasil 3Universidade Federal da Bahia, Programa de Pós-Graduação em Ciências da Saúde, Salvador, BA, Brasil
BACKGROUND Leprosy or hansen’s disease is a spectral disease whose clinical forms mostly depends on host’s immune and genetic factors. Different Toll-like receptors (TLR) variants have been described associated with leprosy, but with some lack of replication across different populations.
OBJECTIVES To evaluate the role of polymorphisms in genes TLR1, TLR2 and TLR4 and susceptibility to leprosy in a genetic case control study; to verify the association between genotypes of these markers and the immunological profile in the serum of patients with leprosy.
METHODS Pre-designed TaqMan® assays were used to genotype markers at TLR1 (rs4833095, rs5743551), TLR2 (rs7656411, rs3804099) and TLR4 (rs1927914, rs1927911). A panel of cytokines and chemokines was accessed by enzime-linked immunosorbent assay (ELISA) test in the serum of a subgroup of patients with and without leprosy reactions.
FINDINGS Our results show an association between the T allele of rs3804099 at the TLR2 gene and increased risk for leprosy per se [Odds ratio (OR) = 1.296, p = 0,022]. In addition, evaluating the association between different genotypes of the TLR1, 2 and 4 markers and cytokine/chemokine serological levels, IL-17 appears as an immunological marker regulated by the polymorphism of the three TLR genes evaluated, whereas different TLR1 genotypes were associated with differential production of IL-12p40 and MCP-1(CCL2). Furthermore, other relevant serum markers such as CXCL-10 and IL-6 seemed to be regulated by TLR2 variants and IL-1β was related to TLR4 genotypes.
MAIN CONCLUSIONS All together our data points that the tested TLR markers may have a regulatory role in the immunity against Mycobacterium leprae, by driving the host’s production of key cytokines and chemokines involved in the pathogenesis of this disease.
Key words: TLR - polymorphism analysis - cytokine and chemokine serum production - leprosy
doi: 10.1590/0074-02760160366
Financial support: INCT-DT (Nº 573839/2008-5). + Corresponding author: leacastel@hotmail.com Received 12 August 2016
Accepted 23 December 2016
Leprosy is a chronic infectious disease caused by the bacillus Mycobacterium leprae that mainly affects the skin, peripheral nerves, upper respiratory tract mucosa and eyes (Scollard et al. 2006). The most probable mode of transmission of this disease is through prolonged con-tact with nasal and mouth secretions and infected skin of contagious subjects. Leprosy is a spectral disease classi-fied according to the type and gradation of the host im-munity. Thus, patients with tuberculoid leprosy (TT) are characterised by a relevant cellular immune response, manifested by few cutaneous or neural lesions with little or no bacilli and a TH1 cytokine profile. In contrast, pa-tients with lepromatous leprosy (LL) are in an opposite pole, characterised by multiple lesions, high bacterial load, diminished or absent lymphocyte proliferation and a TH2 cytokine response (Ramos et al. 1989). The polar
The ten-member Toll-like receptor Family (TLRs) recognises particular molecular patterns of diverse mi-croorganisms in early innate immune responses, being considered important adaptors in the host-pathogen in-teraction. TLRs are expressed by a variety of leukocytes and solid tissue cell types, with the highest levels primar-ily displayed by cells of myeloid lineage such as mono-cytes, macrophages, and dendritic cells (Hart & Tapping 2012). The contribution of the TLR variations to the sus-ceptibility for leprosy has been investigated in different populations, and TLR1, TLR2 and TLR4 variants have been reported to be associated with leprosy by previous studies in ethnical different populations such as Indian, Nepalese, African and Brazilian (Johnson et al. 2007, Bo-chud et al. 2008, 2009, Misch et al. 2008, Hart & Tapping 2012, Marques et al. 2013). In particular, polymorphisms located at TLRs genes were repeatedly associated with leprosy per se and leprosy reactions (Bochud et al. 2008, Schuring et al. 2009, Wong et al. 2010)[Bochud, 2008 #20;Schuring, 2009 #21;Wong, #22;Sardinha, 2011 #24].
In this study we show that a polymorphism at TLR2 (rs3804099) previously associated with leprosy type 1 reac-tion, was positively associated with increased risk for devel-oping leprosy per se in a population from Northeast Brazil. Additionally, there were an association between carriage different alleles at genes TLR1, 2 and 4 and serum level of cytokines and chemokines across leprosy spectrum.
MATERIALS AND METHODS
Case patients, control subjects, and study design - The study participants were enrolled from two reference centres in the city of Salvador, Bahia (BA), Brazil (Hos-pital Universitário Professor Edgard Santos and Hos(Hos-pital Couto Maia). Leprosy patients were enrolled after diag-nostic confirmation by dermatological and neurological evaluation, sensitivity test, bacillary index and histopa-thology of one or more skin lesions to classify by Ridley and Jopling (1966) criteria the clinical form of the disease. Three hundred and sixty-two leprosy cases of both gen-ders, aging 18 to 65 years under multidrug therapy and monthly follow-up were included as cases. The control group consisted of 368 individuals recruited as volunteer blood bank donors in the city of Salvador (HEMOBA
Foundation). All controls were inquired about personal or family history of leprosy prior sample collection. The characteristics of the patients cohort are described else-where (Rego et al. 2015). A subset of 52 leprosy subjects was used for the enzime-linked immunosorbent assay (ELISA) tests, providing a sample of 17 without reaction (10 PB; 7 MB) and 35 with reactions (22 with type I re-action/RR; 13 with type II reaction/ENL). The subjects with reactions were free of immunosuppressive drugs such as prednisone and thalidomide (in case of type II re-actions) when the serum sample was collected. Informed consent was obtained from all participants. Approval for the use of the samples in this study was obtained from the Federal University of Bahia (CEP-891.963) and the Bra-zilian National Ethical Committee (CONEP-759/2010).
DNA extraction and genotyping - DNA was obtained from all samples by blood venipuncture and collected into dodecyl citrate acid- containing Vacutainers (Bec-ton Dickinson). Genomic DNA was prepared using the proteinase K and salting-out method previously de-scribed (Sambrook et al. 1989). Validated predesigned Taqman® qPCR assays, containing polymerase chain reaction (PCR) primers and probes were purchased from Life Technologies® (Thermo Fisher, Inc) and reactions prepared according to the manufacturer’s protocols. The genotyped single nucleotide polymorphisms (SNPs) were chosen based on literature data coupled with al-lele frequencies considering both, Caucasian and You-ruba populations available in the 1000 Genomes proj-ect as follows: rs4833095 (N248S) and 5743551 for the TLR1 gene; rs3804099 and 7656411 for the TLR2 gene; rs1927914 and rs1927911 for the TLR4 gene. Additional details regarding the markers are shown on Table I. To ensure the accuracy of genotyping results, three positive controls and a negative control were included in each 96-well plate. Taqman® assays were performed using the 7500 standard (Life Technologies), and the ABI software v 2.0.6 was used to analyse the data.
ELISA cytokine assays - Whole blood was collected by venipuncture and centrifuged at 20,000g for 10 min for serum obtaining. Levels of the cytokines IL-1β, IL-6, IFN-g and IL12p40, IL-17, IL-10 were measured in
se-TABLE I
Details of the TLR1, 2 and 4 genotyped single nucleotide polymorphisms as recorded in 1000 Genomes, GRCh37 assembly
GENE/SNP Chrossome: physical position Alleles Variation type
TLR1
rs4833095 4: 38799710 C/T Missense variant
rs5743551 4: 38807654 C/T Intron variant
TLR2
rs3804099 4: 154624656 C/T Synonymous variant
rs7656411 4: 154627655 G/T Downstream gene variant
TLR4
rs1927914 9: 120464725 A/G Upstream gene variant
rs1927911 9: 120470054 A/G Intron variant
rum using commercial kits from R&D (R&D systems Inc. Minneapolis, MN, US) and BD OptEIA™ Set hu-man (BD Biosciences, San Jose, CA, US), respectively, according to manufacturer’s protocols. To measure the TNF levels, a high sensitivity ELISA sandwich technique was used (NOVEX®, Termo Fisher, Inc), also follow-ing the manufacturer’s instructions. Optical density was measured in the spectrophotometer at 450 nm. The results were expressed in pg/mL, based on comparisons with standard curves for each cytokine kit.
ELISA chemokine assays - Levels of the chemokines IL-8, MIP-1α, MIP-1β and MCP-1, CXCL-9, CXCL-10 were measured in serum using commercial kits from R&D
(R&D systems Inc. Minneapolis, MN, US) and BD Op-tEIA™ Set human (BD Biosciences, San Jose, CA, US), respectively, according to manufacturer’s protocols. Opti-cal density was measured in the spectrophotometer at 450 nm. The results were expressed in pg/mL, based on com-parisons with standard curves for each chemokine kit.
Statistical analysis - Unconditional logistic regres-sion analysis was performed using STATA (verregres-sion 8.2; available from: http:// www.stata.com/) with the freely available GenAssoc package (available from: http:// www-gene.cimr.cam.ac.uk/clayton/software/stata/) to determine allele-wise (1 df test) and genotype-wise (2 df test) associations comparing cases and controls. Global TABLE II
Allele and genotype frequencies of the TLR1, 2 and 4 markers between cases and controls
Gene/marker Allele/genotype Cases n(%) Controls n(%) Total (%)
TLR1_rs4833095 C/T
C 382(58,8%) 407(61,9%) 789(60,3%)
T 268(41,2%) 251(438,1%) 519(39,7%)
CC 117(36,0%) 122(37,1%) 239(36,5%)
CT 148(45,5%) 163(49,5%) 311(47,6%)
TT 60(18,5%) 44(13,4%) 104(15,9%)
TLR1_rs5743551 C/T
C 387(59,2%) 410(61,9%) 797(60,6%)
T 267(40,8%) 252(38,1%) 519(39,4%)
CC 121(37,0%) 127(38,4%) 248(37,7%)
CT 145(44,3%) 156(47,1%) 301(45,7%)
TT 61(18,7%) 48(14,5%) 109(16,6%)
TLR2_rs3804099 C/T
C 325(50,3%) 372(56,5%) 697(53,5%)
T 321(49,7%) 286(43,5%) 607(46,5%)
CC 76(23,5%) 105(31,9%) 181(27,8%)
CT 173(53,6%) 162(49,2%) 335(51,4%)
TT 74(22,9%) 62(18,8%) 136(20,9%)
TLR2_rs7656411 G/T
G 269(44,1%) 267(44,4%) 536(44,2%)
T 341(55,9%) 335(55,6%) 676(55,8%)
GG 57(18,7%) 56(18,6%) 183(30,2%)
GT 155(50,8%) 155(51,5%) 310(51,2%)
TT 93(30,5%) 90(29,9%) 113(18,6%)
TLR4_rs1927911 A/G
A 269(40,4%) 269(40,4%) 478(40,9%)
G 397(59,6%) 397(59,6%) 690(59,1%)
AA 52(15,6%) 52(15,6%) 212(36,3%)
AG 165(49,5%) 165(49,5%) 266(45,5%)
GG 116(34,8%) 116(34,8%) 106(18,2%)
TLR4_rs1927914 A/G
A 337(50,9%) 223(46,5%) 560(49,0%)
G 325(49,1%) 257(53,5%) 582(51,0%)
AA 89(26,9%) 59(24,6%) 148(25,9%)
AG 159(48,0%) 105(43,8%) 264(46,2%)
GG 83(25,1%) 76(31,7%) 159(27,8%)
TABLE III
Results of logistic regression analyses for the genotyped Toll-like receptors (TLR) polymorphisms
Cases Vs. Controls
TLR1_rs4833095 Odds ratio (OR) Confidence interval (CI 95%) p value
C 0,879 0,70-1,09 0,256
T 1,136 0,91-1,41 0,256
C/T X T/T 0,665 0,42-1,04 0,075
C/C X T/T 0,703 0,44-1,11 0,137
TLR1_rs5743551 OR CI (95%) p value
C 0,894 0,72-1,11 0,316
T 1,117 0,89-1,38 0,316
CT X T/T 0,731 0,47-1,13 0,164
C/C X T/T 0,749 0,47-1,17 0,212
TLR2_rs3804099 OR CI (95%) p value
C 0,771 0,61-0,96 0,022
T 1,296 1,03-1,62 0,022
C/T X T/T 0,894 0,59-1,33 0,585
C/C X T/T 0,606 0,38-0,94 0,029
TLR2_rs7656411 OR CI (95%) p value
G 0,989 0,78-1,24 0,928
T 1,01 0,80-1,27 0,928
GT X T/T 0,967 0,67-1,39 0,86
G/G X T/T 0,985 0,61-1,57 0,95
TLR4_rs1927911 OR CI (95%) p value
A 0,952 0,75-1,19 0,678
G 1,049 0,83-1,31 0,678
A/G X G/G 1,351 0,93-1,95 0,107
A/A X G/G 0,796 0,49-1,27 0,341
TLR4_rs1927914 OR CI (95%) p value
A 1,18 0,94-1,48 0,153
G 0,847 0,67-1,06 0,153
A/G X G/G 1,386 0,93-2,06 0,107
A/A X G/G 1,381 0,87-2,17 0,162
test statistics were generated for both the 1 df test and the 2 df test, and odds ratios (ORs) with 95% confidence intervals (CIs) were calculated. Analysis of Hardy-Wein-berg equilibrium (HWE) was carry out considering un-related and unaffected individuals. The ELISA results were analysed using the software programs Instat3 and GraphPadPrism5. The comparison of two independent groups was performed using the Mann-Whitney test, whereas for statistical comparison of more independent groups the One-way ANOVA Kruskal-Wallis test was used. Differences were considered statistically signifi-cant when the p value was below 0.05 (p ˂ 0.05).
Ethics - This study was approved by the ethical com-mittee of the Faculdade de Medicina da Universidade Federal da Bahia (Nº-891.963) and Comissão Nacional de Ética em Pesquisa - CONEP (Nº-759/2010).
RESULTS
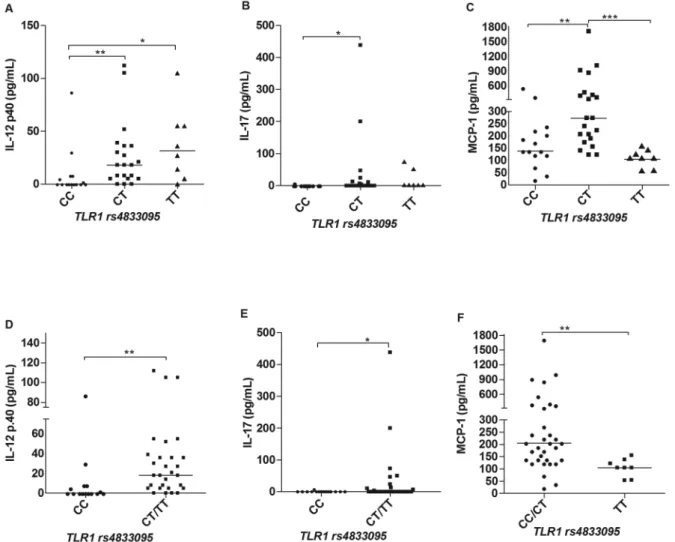
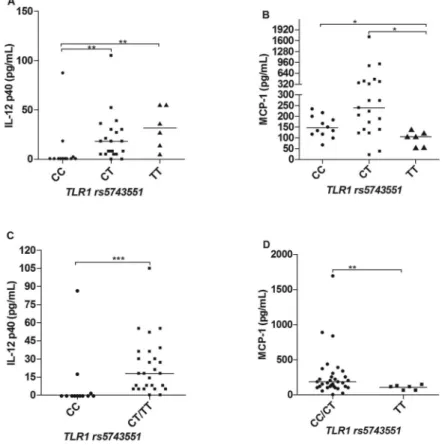
Cytokine and chemokine profiles in leprosy patients according to different genotypes of TLR1 SNPs - There were differences in the serum levels of some cytokines and chemokines regarding the TLR1 polymorphisms. For the SNP rs4833095 (genotypes CC, CT and TT) we ob-served significant differences in the IL-12p40 and IL-17 levels, in which patients carriers of the T allele produced higher amounts of these two cytokines in comparison to individuals homozygous for the CC genotype (Fig. 1A-B), respectively. These results become more evident by pooling together the genotypes TC and TT and comparing with the CC genotype, as shown in Fig. 1D-E. In addi-tion, we also observed differences in the production of the chemokine MCP-1. In this case however, carriers of the TT genotype (TC and TT) produced lower serum levels of this chemokine as compared to CC and CT individu-als, as shown in Fig. 1C, F. Regarding the TLR1 marker, rs5743551 (genotypes CC, CT and TT), we also observed significant differences in relation to the production of IL-12p40 and MCP-1. Carriers of the T allele produced high-er levels of IL-12p40 (Fig. 2A, C), and, by the othhigh-er hand, lower levels of MCP-1 (Fig. 2B, D). That accordance with
the marker rs4833095 is expected, considering the link-age disequilibrium (LD) between these two SNPs that could account for similar results. There were no signifi-cant differences observed to other cytokines (IL-1β, IL-6, IFN-g and IL-10) and chemokines (IL-8, 1α, MIP-1β, CXCL-9 and CXCL-10) evaluated in this study.
Cytokine and chemokine profiles in leprosy patients according to different genotypes of TLR2 SNPs - In the analysis of cytokines and chemokines production across the different genotypes of TLR2 markers we found signif-icant differences as described. For the rs3804099 (geno-types CC, CT and TT) carriers of the T allele produced higher serum levels of IL-17 (Fig. 3A) and this difference was kept significant by pooling together CT and TT indi-viduals and comparing against CC indiindi-viduals (Fig. 3C). We also observed that carriers of the T allele are higher producers of IL-6, especially when we join CT and CC and compare against the TT genotype (Fig. 3B, D). By the other hand, in relation to the marker rs7656411 (geno-types GG, GT and TT), we observed that carriers of the G allele produced higher levels of CXCL-10, as shown
in (Fig. 3E-F). There were no significant differences ob-served to other cytokines and chemokines evaluated.
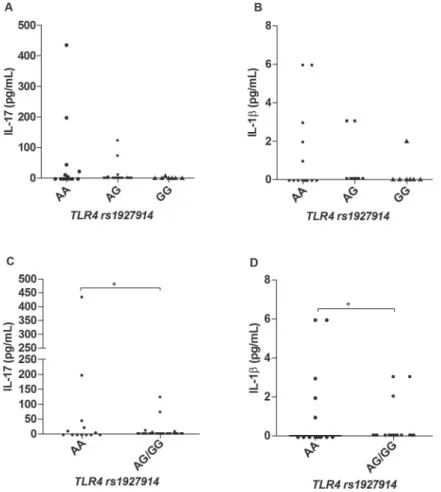
Cytokine and chemokine profiles in leprosy patients according to different genotypes of TLR4 SNPs - We found no differences concerning cytokines or chemo-kines production and the different genotypes of the marker rs1927911 (genotypes AA, AG and GG), p > 0,05 (data not shown). For the marker rs1927914 (genotypes AA, AG and GG), we observed significant differences in the levels of the cytokines IL-17 and IL-1β, in which carriers of the A allele produced more of both cytokines as compared to carriers of the allele G allele (Fig. 4A-B), respectively. This difference become clearer when AA subjects were compared to subjects carrying the geno-types AG or GG together as shown in Fig. 4C-D.
DISCUSSION
The broad spectrum of clinical and pathological manifestations of leprosy, aligned to its epidemiologi-cal, geographical and ethnic heterogeneity, greatly de-pend on the host genetic variability (Alter et al. 2008). Whereas some locus affect the intrinsic susceptibility to leprosy (leprosy per se), others modulate risk factors for the pauci or multibacillary forms of disease or the de-velopment of leprosy reactions (Mira et al. 2004). Inter-actions between bacterial, fungal and viral components and TLRs, activate the pathway of NF-kβ, driving the
production of proinflammatory cytokine and chemo-kines, as well as the costimulatory molecules required for T-cell activation (Medzhitov et al. 1997, Taylor et al. 2012). The M. leprae and other species of mycobacteria such as M. tuberculosis are rich in various agonists for TLR family members including TLR1, 2 and 4 (Hart & Tapping 2012). In addition, previous studies had shown associations between variations at TLR genes and in-creased risk for leprosy or leprosy reactions. In this study, we observed an association between the T allele of the marker rs3804099 at the TLR2 gene and susceptibil-ity to leprosy per se comparing cases and controls. This polymorphism has been previously associated with the development of type I reactions in an Ethiopian cohort (Bochud et al. 2008). We stratified our samples regard-ing type I or type II reactions in the genetic analyses. However, no significant results were found (data not shown). It is possible that the large number of patients excluded from the cohort in this analysis has lead us to loose power to detect any associations, considering that this marker might have only a small effect.
Additionally, in a Danish population, this marker was also associated with response to anti-TNF therapy in patients with inflammatory bowel disease (Bank et al. 2014). Data such as that are relevant as confirm pre-vious genome wide studies that pointed a gene sharing between leprosy and inflammatory bowel disease (Bank et al. 2014). Regarding TLR1 gene, Marques et al. (2013)
Fig. 3: serum levels of IL-17 (A, C) and IL-6 (B, D) according to different TLR2 rs3804099 genotypes; and CXCL-10 across TLR2 rs7656411 geno-types (E, F). The non-parametric tests of Kruskal-Wallis and Mann-Whitney were used to analyse the statistical differences (N = 52). *p < 0.05.
documented a significant association between the S al-lele (N248S, rs48033095) with leprosy in different Bra-zilian populations, analysed both, separately and in me-ta-analysis. In our population, however, this association was not confirmed. Conflicting results in genetic studies can occur for different reasons. Our population has dif-ferent allele frequencies for this marker as compared to the other Brazilians populations, which points to a di-verse ethnical background. Also, the clinical forms, in-cluding the presence and number of patients with type 1 or 2 reactions, normally vary among the studied cohorts which might concur to different results. Given its biolog-ical significance however, this data does not exclude that other alleles or haplotypes in the TLR1 gene could con-tribute for the disease susceptibility in our population.
In the analysis of cytokines and chemokines strati-fied according to genotypes we observed differences
Fig. 4: serum levels of IL-17 (A, C) and IL-1β (B, D) according to different TLR4 rs1927914 genotypes. Kruskal-Wallis and Mann-Whitney tests were used to analyse the statistical differences (N = 52). *p < 0.05.
compared to health controls (p < 0.05, data nor shown). Recently an immunohistochemical study has shown that MCP-1 was present in leprosy-affected nerves being this cytokine also associated with excessive deposit of extra-cellular matrix (Medeiros et al. 2015), which might be re-lated to nerve damage. In relation to IL12p40, PBMC cul-tures stimulated with M. leprae antigen shown increased production of this cytokine in cells of patients compared to controls, highlighting a mechanism in which IFN-g downregulates IL-10 by the induction of IL-12 (Libraty et al. 1997). The ways these SNPs are grouped into hap-lotypes, as well as the influence of epigenetic regulation are decisive in how and, in which moment, they can ex-ert their effects on the immune response following infec-tion. The SNP rs5743551 is intronic, therefore the results observed could be due to a regulatory effect from the marker itself or just by linkage disequilibrium with the rs4833095 or other functional marker.
Regarding SNPs in TLR2 gene, we observed different concentrations of IL-6 and IL-17 related to the marker rs3804099. In this case, carriers of the T allele produced higher levels of these cytokines. This allele was also as-sociated with increased risk of leprosy in our popula-tion. Considering that this marker is located in a cod-ing region of the gene that strengthens the notion that it could have a functional role in the disease pathogenesis. IL-6 is a pro-inflammatory cytokine produced in high
concentrations in leprosy and associated with the de-velopment of ENL (Stefani et al. 2009). The chemokine CXCL-10 appears differentially produced according to genotypes of the SNP rs7656411. Since this is an intronic SNP, we hypothesize that this could be the result of link-age disequilibrium with other regulatory markers. Re-garding the TLR4 gene, we observed greater production of IL-1-β and IL-17 between carriers of the A allele in the exonic SNP rs1927914. IL1-β is essential for the am-plification of the T-cells specific immune response and its levels tend to decrease after the multidrug therapy (Moubasher et al. 1998). This cytokine is also produced in high concentrations in multibacillary patients (Madan et al. 2011). Finally, in order to check whether the asso-ciation found is related to the disease or if it is a common effect seen in the general population, we analysed the immunological markers regarding the TLR genotypes in health controls (data not shown). Nonetheless, for most of the cytokines the values obtained in sera were zero or close to zero, making hard any type of comparison in this group. Regarding the chemokines, only for IL-8 we observed a borderline association between genotypes of TLR2 rs7656411 (p = 0,059). That indicates that the polymorphisms are influencing the production of these immune parameters in the presence of infection.
addi-tion, different markers of TLR1, 2 and 4 appeared associ-ated with serum levels of other important cytokines and chemokines that take part in the leprosy pathogenesis. This data reinforces the regulatory role of genetic mark-ers in infection and disease and highlights the premise that in multifactorial diseases various genes contribute to susceptibility or different clinical forms. Neverthe-less, remains to be understood how this molecular net-work orchestrates a final phenotype. Much depends on the environment and this tight regulation must vary de-pending on personal stimuli.
ACKNOWLEDGEMENTS
To the staff of Magalhães Neto Leprosy Service, Hospital Couto Maia and HEMOBA, for the logistical support in the sample collection.
AUTHORS’ CONTRIBUTIONS
NS, JR, JO, LA and MB carried out the preparation of the samples and genotyping; NS and JR carried out the serum analy-sis in the lab; PM and LM participated in clinical phenotyping and collection of clinical data; LC supervised the laboratory work and undertook interpretation of the data and preparation of the manuscript. All authors read and approved the final manuscript.
REFERENCES
Alter A, Alcais A, Abel L, Schurr E. Leprosy as a genetic model for susceptibility to common infectious diseases. Hum Genet. 2008; 123(3): 227-35.
Bank S, Andersen PS, Burisch J, Pedersen N, Roug S, Galsgaard J, et al. Associations between functional polymorphisms in the NFkappaB signaling pathway and response to anti-TNF treat-ment in Danish patients with inflammatory bowel disease. Phar-macogenomics J. 2014; 14(6): 526-34.
Bochud PY, Hawn TR, Siddiqui MR, Saunderson P, Britton S, Abraham I, et al. Toll-like receptor 2 (TLR2) polymorphisms are associated with reversal reaction in leprosy. J Infect Dis. 2008; 197(2): 253-61.
Bochud PY, Sinsimer D, Aderem A, Siddiqui MR, Saunderson P, Brit-ton S, et al. Polymorphisms in Toll-like receptor 4 (TLR4) are associated with protection against leprosy. Eur J Clin Microbiol Infect Dis. 2009; 28(9): 1055-65.
Cardoso CC, Pereira AC, Marques CS, Moraes MO. Leprosy suscep-tibility: genetic variations regulate innate and adaptive immu-nity, and disease outcome. Future Microbiol. 2011; 6(5): 533-49.
da Motta-Passos I, Malheiro A, Naveca FG, Passos LFS, Cardoso CRB, Cunha MGS, et al. Decreased RNA expression of interleu-kin 17A in sinterleu-kin of leprosy. Eur J Dermatol. 2012; 22(4): 488-94.
Fava V, Orlova M, Cobat A, Alcais A, Mira M, Schurr E. Genetics of leprosy reactions: an overview. Mem Inst Oswaldo Cruz. 2012; 107(Suppl. 1): 132-42.
Hart BE, Tapping RI. Genetic diversity of Toll-like receptors and im-munity to M. leprae infection. J Trop Med. 2012; 2012(415057): 1-12. Johnson CM, Lyle EA, Omueti KO, Stepensky VA, Yegin O, Alpsoy
E, et al. Cutting edge: a common polymorphism impairs cell sur-face trafficking and functional responses of TLR1 but protects against leprosy. J Immunol. 2007; 178(12): 7520-4.
Libraty DH, Airan LE, Uyemura K, Jullien D, Spellberg B, Rea TH, et al. Interferon-gamma differentially regulates interleuk12 and in-terleukin-10 production in leprosy. J Clin Invest. 1997; 99(2): 336-41.
Liu H, Bao F, Irwanto A, Fu X, Lu N, Yu G, et al. An association study of TOLL and CARD with leprosy susceptibility in Chinese population. Hum Mol Genet. 2013; 22(21): 4430-7.
Madan NK, Agarwal K, Chander R. Serum cytokine profile in lepro-sy and its correlation with clinico-histopathological profile. Lepr Rev. 2011; 82(4): 371-82.
Marques CS, Brito-de-Souza VN, Guerreiro LT, Martins JH, Amaral EP, Cardoso CC, et al. Toll-like receptor 1 N248S single-nucleo-tide polymorphism is associated with leprosy risk and regulates immune activation during mycobacterial infection. J Infect Dis. 2013; 208(1): 120-9.
Medeiros MF, Rodrigues MM, Vital RT, Nery JAC, Sales AM, Hack-er MA, et al. CXCL10, MCP-1, and othHack-er immunologic markHack-ers involved in neural leprosy. Appl Immunohistochem Mol Mor-phol. 2015; 23(3): 220-9.
Medzhitov R, Preston-Hurlburt P, Janeway Jr CA. A human homo-logue of the Drosophila Toll protein signals activation of adaptive immunity. Nature. 1997; 388(6640): 394-7.
Mira MT, Alcais A, Nguyen VT, Moraes MO, Di Flumeri C, Vu HT, et al. Susceptibility to leprosy is associated with PARK2 and PACRG. Nature. 2004; 427(6975): 636-40.
Misch EA, Macdonald M, Ranjit C, Sapkota BR, Wells RD, Siddiqui MR, et al. Human TLR1 deficiency is associated with impaired mycobacterial signaling and protection from leprosy reversal re-action. PLoS Negl Trop Dis. 2008; 2(5): 1-9.
Moraes MO, Cardoso CC, Vanderborght PR, Pacheco AG. Genetics of host response in leprosy. Lepr Rev. 2006; 77(3): 189-202.
Moubasher AD, Kamel NA, Zedan H, Raheem DD. Cytokines in lep-rosy, II. Effect of treatment on serum cytokines in leprosy. Int J Dermatol. 1998; 37(10): 741-6.
Ramos T, Zalcberg-Quintana I, Appelberg R, Sarno EN, Silva MT. T-helper cell subpopulations and the immune spectrum of leprosy. Int J Lepr Other Mycobact Dis. 1989; 57(1): 73-81.
Rego JL, Oliveira JM, Santana NL, Machado PR, Castellucci LC. The role of ERBB2 gene polymorphisms in leprosy susceptibil-ity. Braz J Infect Dis. 2015; 19(2): 206-8.
Ridley DS, Jopling WH. Classification of leprosy according to immu-nity. A five-group system. Int J Lepr Other Mycobact Dis. 1966; 34(3): 255-73.
Sambrook J, Fritsch E, Maniatis T. Molecular cloning: a laboratory manual. Oxford: Oxford University Press; 1989.
Schuring RP, Hamann L, Faber WR, Pahan D, Richardus JH, Schumann RR, et al. Polymorphism N248S in the human Toll-like receptor 1 gene is related to leprosy and leprosy reactions. J Infect Dis. 2009; 199(12): 1816-19.
Scollard DM, Adams LB, Gillis TP, Krahenbuhl JL, Truman RW, Williams DL. The continuing challenges of leprosy. Clin Micro-biol Rev. 2006; 19(2): 338-81.
Stefani MM, Guerra JG, Sousa AL, Costa MB, Oliveira ML, Martelli CT, et al. Potential plasma markers of Type 1 and Type 2 leprosy reactions: a preliminary report. BMC Infect Dis. 2009; 9(75): 1-8.
Taylor BD, Darville T, Ferrell RE, Kammerer CM, Ness RB, Hagger-ty CL. Variants in Toll-like receptor 1 and 4 genes are associated with Chlamydia trachomatis among women with pelvic inflam-matory disease. J Infect Dis. 2012; 205(4): 603-9.
Trombone AP, Belone A, Guidella C, Fachin L, Ramuno N, Soriani M, et al. T helper cytokines expression in leprosy forms and reactional states: serum and in situ analysis. J Immunol. 2012; 188(59): 9.
Wong SH, Gochhait S, Malhotra D, Pettersson FH, Teo YY, Khor CC, et al. Leprosy and the adaptation of human Toll-like receptor 1. PLoS Pathog. 2010; 6(7): 1-9.