www.ann-geophys.net/33/519/2015/ doi:10.5194/angeocom-33-519-2015
© Author(s) 2015. CC Attribution 3.0 License.
Communica
tes
Extremely intense (SML
≤ −
2500 nT) substorms: isolated events
that are externally triggered?
B. T. Tsurutani1, R. Hajra2, E. Echer2, and J. W. Gjerloev3,4
1Jet Propulsion Laboratory, California Institute of Technology, Pasadena, CA, USA 2Instituto Nacional de Pesquisas Espaciais, Sao Jose dos Campos, SP, Brazil 3Johns Hopkins University Applied Physics Laboratory, Laurel, MD, USA 4Birkeland Center, University of Bergen, Norway
Correspondence to:B. T. Tsurutani ([email protected])
Received: 26 November 2014 – Revised: 7 April 2015 – Accepted: 8 April 2015 – Published: 6 May 2015
Abstract.We examine particularly intense substorms (SML ≤ −2500 nT), hereafter called “supersubstorms” or SSS events, to identify their nature and their magnetic storm de-pendences. It is found that these intense substorms are typi-cally isolated events and are only loosely related to magnetic storms. SSS events can occur during super (Dst≤ −250 nT) and intense (−100 nT≥Dst>−250) magnetic storms. SSS events can also occur during nonstorm (Dst≥ −50 nT) inter-vals. SSSs are important because the strongest ionospheric currents will flow during these events, potentially causing power outages on Earth. Several SSS examples are shown. SSS events appear to be externally triggered by small re-gions of very high density (∼30 to 50 cm−3) solar wind
plasma parcels (PPs) impinging upon the magnetosphere. Precursor southward interplanetary magnetic fields are de-tected prior to the PPs hitting the magnetosphere. Our hy-pothesis is that these southward fields input energy into the magnetosphere/magnetotail and the PPs trigger the release of the stored energy.
Keywords. Magnetospheric physics (storms and substorms)
1 Introduction
“Space weather” is the study of phenomena at our Sun caus-ing effects in interplanetary space, in our protective magnetic bubble called the magnetosphere, in our ionosphere, and even at ground. As one extreme example, a flare on the Sun on 1 September 1859 was associated with a coronal mass ejection (CME) that caused the largest magnetic storm in recorded history at Earth, some∼17 h and 40 min after the flare
oc-curred (Tsurutani et al., 2003). Loomis (1861) noted that fires and electrical shocks associated with arcing from induced voltages on telegraph lines took place during this magnetic storm. At the time, telegraph communication was the “high technology” of the day. If such a magnetic storm occurred today, it would be much more damaging to society due to the much higher technology (and greater vulnerability) in the space age (Royal Academy of Engineering report, 2013).
Power outages are known to occur during magnetic storms (Kappenman, 1996; Pulkkinen et al., 2012). However the ex-act nature of the power outages is not well understood. What we do know is that the most intense currents that flow in our ionosphere occur during substorms (Akasofu, 1964). Intense substorms occur repeatedly throughout magnetic storms, but intense substorms (and also power outages: Schrijver and Mitchell, 2013) can occur outside of magnetic storms as well. Substorm ionospheric currents flow at an altitude of ∼100 km above the Earth and are associated with intense auroras. It is these currents with amplitudes > 106A that in-duce currents in conductors on the ground and cause over-heating and sometimes failures of transformers. In extreme cases, entire power grid outages may occur (Royal Academy of Engineering report, 2013).
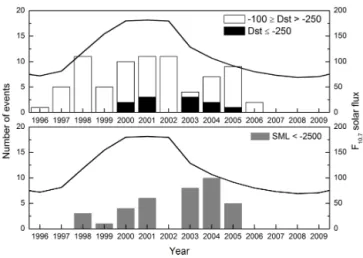
Figure 1.In the upper panel, the open and black histograms show the intense (−100 nT≥Dst>−250 nT) and super (Dst≤ −250 nT) geomagnetic storms annual occurrence rates for the period 1996 to 2009, respectively. The scale for both is on the left. In the bottom panel, the supersubstorm (SML ≤ −2500 nT) annual occurrence rate is given in histogram format. The scale is on the left. The solid lines in both the panels show theF10.7solar flux levels. The scale is on the right.
intervals. There are over 100 ground stations used in Super-MAG. The middle-latitude coverage is important during in-tense magnetic storms or substorms when the auroras and their associated currents move equatorward. It is these in-stances which can give power grids in the United States and Europe the greatest problems. The SML index is sim-ilar to the AL index, but with greater longitudinal and lat-itudinal coverage. The maximum intensity that we will be using for our study is an SML index of −2500 nT, which is an extremely intense substorm. There were 37 supersub-storms identified in SC23 (1996 to 2009) interval, the inter-val of study. Their intensities ranged from SML= −2522 to −4418 nT with an average value of−3006 nT.
For reference, the older AE index will be shown in ad-dition to the SML index. Since the SML index uses more ground stations and has better geographical coverage, the AE values will in general be smaller than the SML values. The overall temporal profiles will be almost identical, as one would expect. For this study the peak AE values ranged from 1663 to 4102 nT with an average of 2949 nT.
2 Results
The bottom panel of Fig. 1 shows the solar cycle dependence of SML≤ −2500 nT (supersubstorm) events during solar cy-cle (SC) 23, from 1996 to 2009. The numbers of SSS events are given in histogram format with the scale on the left. The
F10.7solar flux is given as a solid black line with the scale on
the right. It is noted that SSS events occurred throughout the solar cycle, except during the two solar/geomagnetic activity
minima: 1996–1997 and 2008–2009 (Tsurutani et al., 2011). The neighboring years of the latter minimum, 2006–2007, also did not have any SSS events.
SSS–magnetic storm intensity relationship
The top panel of Fig. 1 shows the intense magnetic storms (−100 nT≥Dst>−250 nT) as open boxes and superstorms (Dst≤ −250 nT) as black boxes. The F10.7 flux is shown
in both panels for purposes of context. It is noted that SSS events occur during every year that superstorms oc-cur except in 1998 and 1999. In 2002 near solar maximum, there were no SSS events and also no superstorms. The in-tense storm (−100 nT≥Dst>−250 nT) dependence gener-ally agrees with the SSS dependence, but there are intense storm events in 1996–1997 and 2006 where there are no SSS events. There are also many intense storms that occur dur-ing 2002 when there are no SSS or superstorm events. From 2007 through 2009, in the extended solar minimum phase, there are no superstorms, intense storms, or SSS events.
For the SC 23 (1996–1009) interval, 57 % of the SSS events were associated with superstorms and 40 % with in-tense storms. The remaining 3 % of the SSS events occurred during nonstorm (Dst≥ −50 nT) intervals.
We have examined the SSS events from another perspec-tive. We identified all superstorms that occurred during SC23 to determine how often SSS events were related to these events. Eleven superstorms took place during this interval, and nine (∼82 %) had associated SSS events. Thus there is some relationship between SSS events and superstorms, but there is not a one-to-one correspondence between the two phenomena.
.1 Supersubstorms on 24 November 2001
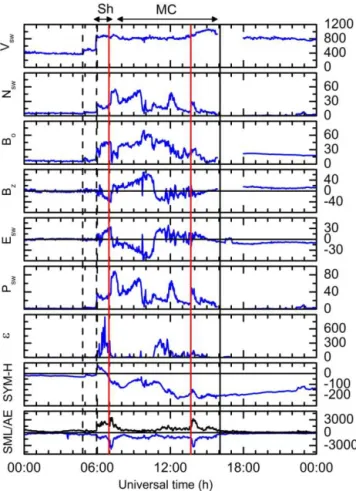
Figure 2 shows the interplanetary parameters during two SSS events that occurred on 24 November 2001. The SSS onset times are indicated by vertical red lines. The SML indices are shown in the bottom panel. It is noticed that both SSS events are large, isolated events and are not associated with gener-ally high SML-valued intervals. The first SSS event began at ∼07:00 UT and reached a peak SML value of∼ −3839 nT (a peak AE of 3525 nT). The event ended at∼07:50 UT, giving it a duration of∼50 min. The second SSS event had a peak SML value of∼ −3312 nT (a peak AE of 3249 nT) and had an onset at∼13:45 UT and lasted until∼14:18 UT, giving it a∼30 min duration.
Figure 2.Interplanetary parameters during two SSS events occur-ring on 24 November 2001. From top to bottom, the panels are the solar wind speed (Vswin km s−1), the density (Nswin cm−3), the interplanetary magnetic field (IMF) magnitude (Boin nT), the north–south component of the IMF (Bz in nT), the interplanetary electric field (Eswin mV m−1), the plasma ram pressure (Pswin nPa), and the interplanetary epsilon parameter (εin 1011W). The next to the bottom panel contains the SYM-H (nT) indices. The bottom panel contains the ground SML (nT) indices (blue) and the AE indices (black). Onsets of two SSSs are indicated by ver-tical red lines during the complex magnetic storm on 24 November 2001. Interplanetary shocks are denoted by the dashed vertical black lines. A magnetic cloud (MC: Klein and Burlaga, 1982) is present and is shown bounded by solid vertical black lines. The MC lasted from∼07:50 to∼16:00 UT. It is identified by the northward-then-southward rotation of the IMFBzcomponent.
of ∼ −234 nT at ∼12:37 UT. The first storm decrease is caused by the southward interplanetary magnetic field (IMF) in the sheath (Tsurutani et al., 1988), and the second decrease is caused by the southward IMF in the magnetic cloud (MC). The sheath and the MC are indicated by horizontal arrows at the top. Thus using the Fig. 1 definitions of storm intensities, the first storm was an intense storm and the second was a larger intense storm. Both magnetic storms were caused by southward (negativeBz)IMFs, with slight delay times (Gon-zalez et al., 1989).
The two SSS events did not occur at the maximum inten-sities of the two storms. The first SSS event occurred when SYM-H was∼ −85 nT and the second when SYM-H was ∼ −148 nT. Thus the first SSS occurred in the main phase of the first intense storm when SYM-H was only at moder-ate storm (−50 nT≥Dst>−100 nT) intensities. The second SSS event occurred in the main phase of the second intense storm when the SYM-H value was only slightly higher than half the peak storm value. At the time of the second SSS event, the SYM-H value was that of an intense storm.
It is useful to show some of the interplanetary features dur-ing the day of the two SSS events. There are sudden increases in the solar wind speed (Vsw, Fig. 2 top panel), density (Nsw, second panel), and the magnetic field magnitude (B0, third panel) at∼04:49 UT and∼05:52 UT. These sudden in-creases are indicated by vertical dashed black lines. The jump conditions are consistent with their being fast mode shocks. The characteristics of the shocks have been analyzed but will be given elsewhere.
Is there solar wind priming of the magnetosphere prior to the SSS events?
The IMF Bz component is given in the fourth panel of Fig. 2. The epsilon parameter (ε: Perreault and Akasofu, 1978) is given in the third from the bottom panel. ε is a well-recognized parameter that uses the north–south compo-nent of interplanetary magnetic field (IMFBz) component as a means of identifying solar wind energy transfer to the magnetosphere through magnetic reconnection at the dayside magnetosphere. This energy transfer occurs primarily when the magnetic field is southward (Echer et al., 2008).
Prior to both SSS events, the IMF had southward compo-nents (negativeBz)of ∼ −28 nT and−21 nT, respectively. The integrated values of IMFBzfor the 1.5 h before the SSS onsets were−13.2 nT h−1 and −15.9 nT h−1, respectively.
The ε value is high at the same time as the above events, as expected.
Could the SSS events have been triggered?
There is a high-density plasma parcel (PP) of density ∼55 cm−3 extending from ∼07:00 UT to ∼07:50 UT,
which is time-coincident with the first SSS event. The PP caused a solar wind ram pressure (Psw)of∼88 nPa. This PP is part of the coronal mass ejection (CME) which came out-ward from the Sun. It could be either a solar coronal loop (Tsurutani et al., 1998) or a coronal sheath (DeForest et al., 2013).
There is a PP which is well-correlated with the second SSS onset. The PP had a density of∼32 cm−3and caused a ram
Figure 3. Polar images during two SSS events shown in Fig. 2. The green lines show the magnetic perturbations over the North-ern Hemisphere during the two SSS events. These are taken from the SuperMAG data sets from individual ground magnetometer sta-tions.
The ground magnetic perturbations
The SML indices shown in Fig. 2 gave an envelope of the largest negative deviation of the horizontal component of the magnetic fields (Gjerloev, 2012). The individual vector components over the Northern Hemisphere are shown in the two panels of Fig. 3. On the left is the ∼07:00 UT SSS event and on the right is the∼13:45 UT SSS event. One can note the very large magnetic deviations over Alaska, northern Canada, and northern Europe. Magnetic deviations are also noted in more southern regions as well.
.2 Supersubstorms on 24 August 2005
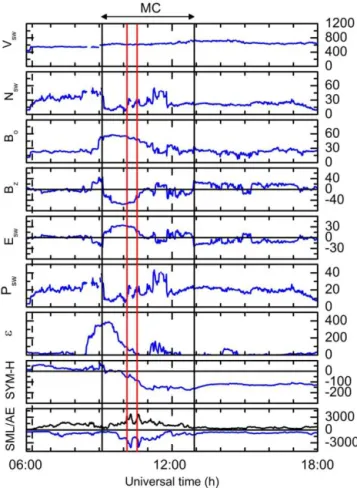
Figure 4 displays the same format of interplanetary data and ground indices as in Fig. 2 for 12 h of 24 August 2005. The initiations of two SSS events are denoted by the red verti-cal lines in the figure. The SSS events occur consecutively but are large and distinct from each other. The peak SML intensities are −4143 nT (AE=3708 nT) at 10:18 UT and −4017 nT (AE=3608 nT) at 10:37 UT, respectively. The du-rations of the two SSS events lasted from ∼10:05 UT to 10:23 UT and 10:23 UT to 10:49 UT, giving durations of ∼17 and 26 min, respectively.
The MC is identified by the variations in the IMF Bx, By, and Bz components. The MC extends from 09:02 UT to 12:49 UT and is denoted by a solid horizontal black line. Both SSS events occurred within the interval when the MC had impinged upon the magnetosphere.
The storm main phase began at 09:53 UT and reached a peak intensity of SYM-H−173 nT at∼11:13 UT. This storm was thus an intense magnetic storm. It was caused by the southward component of the MC.
During the SSS events the SYM-H values were −58 nT and−84 nT, respectively. Both SSS events occurred in the storm main phase prior to storm maximum intensity. Both SSS events occurred when the SYM-H level was at a moder-ate storm intensity level.
Figure 4.Interplanetary parameters during two SSSs occurring on
24 August 2005. The format is the same as in Fig. 2.
The IMF prior to both SSS events was southward. The 1.5 h IMF Bz-integrated values were −42.2 nT h−1 and −58.2 nT h−1, respectively.
Both SSS events were associated with solar wind pressure pulses. The first had a peak magnitude of 25 nPa and the sec-ond of 24 nPa. The solar wind density increases causing the pressure pulses were∼32 and 31 cm−3(second panel from
the top). The solar wind velocity was more or less constant.
3 Summary
The detailed examples showed evidence of magneto-spheric/magnetotail priming. The average IMFBz1.5 h prior to the high-density regions was negative (southward), and the integrated IMF Bz was large and negative. Geomagnetic ac-tivity was ongoing prior to all four SSS events.
Evidence for external triggering by solar wind pressure pulses was noted for all four SSS events. The solar-wind-convected densities range from∼30 to 55 cm−3. These
pres-sure pulse durations ranged from 17 to 50 min.
4 Discussion and conclusions
It had been previously noted by Heppner (1955) (and many references afterwards) that interplanetary shocks can trig-ger substorms. It was shown that precursor southward IMF
Bz was a criterion for shock triggering of substorms to oc-cur (Zhou and Tsurutani, 2001). The amount of preoc-cursor time was empirically determined to be∼1.5 h. Tsurutani and Zhou (2003) postulated the idea that the stored energy was al-ways being dissipated away, and∼1.5 h was the approximate time constant for this dissipation.
The 1.5 h time-integrated IMFBzvalues for the four SSS events shown in this paper were −13.2,−15.9,−42.2 and −58.2 nT h−1, respectively. To put this into context, the
typ-ical IMF magnetic field intensity in the slow solar wind up-stream of shocks is ∼5 nT. If this upstream field were to-tally southwardly directed, the 1.5 h time-integrated IMFBz would be−7.5 nT h−1. Thus the precursor IMFB
zevents for the four SSS events were∼2 to 7 times larger than those for typical shock cases.
Quiet time solar wind densities are typically 3–5 cm−3.
In-terplanetary shocks have downstream density increases typ-ically ∼1 to 3 times and only moderate velocity increases, so the ram pressure increases are usually a maximum of ∼3. Thus the maximum densities downstream of shocks are typically ∼9–15 cm−3. The plasma densities for the four
PPs triggering the SSS events were ∼55, ∼30,∼32, and ∼31 cm−3. Thus the PP events were∼2 to 6 times larger
than the typical interplanetary shock downstream densities (Tsurutani and Lin, 1985; Echer et al., 2011).
Since SSS events are associated with extreme levels of ionospheric currents, prediction of the occurrence of SSSs could be used to forecast power outages on Earth. Schrijver and Mitchell (2013) concluded that∼50 US power grid dis-turbances in a 19-year US Department of Energy disturbance record could be assignable to geomagnetic activity. Further detailed analyses of the relationship between SSSs and world power grid disturbances are beyond the scope of this paper but will be taken up at a later date. If the SSS events can in-deed be related to power grid disturbances, then it is clear that an upstream monitor at the L1 libration point could give ∼30 min to 1 h warning of impending problems.
At this time we have not shown how often SSS events are triggered and whether solar wind priming is a necessary and
sufficient condition. This work needs to be done and we en-courage space weather researchers to undertake such efforts. Finally, we should also mention that not all SSS events will have equal effects on power lines. Those that occur during su-perstorms will take place at lower geomagnetic latitudes over more populated areas. However if triggers for specific events could be identified in advance, the susceptible geographic lo-cations could be forewarned.
Acknowledgements. Portions of this research were performed by the Jet Propulsion Laboratory, California Institute of Technology under contract with NASA. The work of R. Hajra is financially supported by FAPESP post-doctoral research fellowship at INPE. E. Echer would like to thank to the Brazilian CNPq (301233/2011-0) agency for financial support. The SuperMAG data were collected from the following website: http://supermag.jhuapl.edu/. The solar wind/interplanetary data were collected from the OMNI website: http://omniweb.gsfc.nasa.gov/.
The topical editor G. Balasis thanks one anonymous referee for help in evaluating this paper.
References
Akasofu, S.-I.: The development of the auroral substorm, Planet. Spa. Sci., 12, 273–282, 1964.
DeForest, C. E., Howard, T. A., and McComas, D. J.: Tracking coro-nal features from the low corona to Earth: a quantitative acoro-nalysis of the 2008 December 12 coronal mass ejection, Astrophys. J., 769, 43–55, doi:10.1088/0044-637X/769/1/43, 2013.
Echer, E., Gonzalez, W. D., Tsurutani, B. T., and Gonzalez, A. L. C.: Interplanetary conditions causing intense geomagnetic storms (Dst≤ −100 nT) during solar cycle 23 (1996–2006), J. Geophys. Res., 113, A05221, doi:10.1029/2007JA012744, 2008.
Echer, E., Tsurutani, B. T., Guarnieri, F. L., and Kozyra, J. U., Interplanetary fast forward shocks and their geomagnetic ef-fects: CAWSES events, J. Atmos. Sol.-Terr. Phys., 73, 1330, doi:10.1016/j.jastp.2010.09.020, 2011.
Gjerloev, J. W.: The SuperMAG data processing technique, J. Geo-phys. Res., 117, A09213, doi:10.1029/2012JA017683, 2012. Gonzalez, W. D., Gonzalez, A. L. C., Tsurutani, B. T., Smith, E. J.,
Tang, F., and Akasofu, S. I.: Solar wind-magnetosphere coupling during intense magnetic storms (1978–1979), J. Geophys. Res., 94, 1547, doi:10.1016/j.jastp.2010.09.020, 1989.
Gonzalez, W. D., Joselyn, J. A., Kamide, Y., Kroehl, H. W., Ros-toker, G., Tsurutani, B. T., and Vasyliunas, V. M.: What is a geo-magnetic storm?, J. Geophys. Res., 99, 5771–5792, 1994. Heppner, J. P.: Note on the occurrence of world-wide SSCs during
the onset of negative bays at College, Alaska, J. Geophys. Res., 60, 29–32, doi:10.1029/JZ060i001p00029, 1955.
Kappenman, J. G.: Geomagnetic storms and their impact on power systems, IEEE Power Eng. Rev., 16, 5–8, 1996.
Loomis, E.: On the great auroral exhibition of Aug. 28th to Sept. 4, 1859, and on auroras generally, Am. J. Sci., 82, 318–335, 1861. Newell, P. T. and Gjerloev, J. W.: Evaluation of SuperMAG auroral
Perreault, P. and Akasofu, S.-I.: A study of geomagnetic storms, Geophys. J. R. Astron. Soc., 54, 547–573, 1978.
Pulkkinen, A., Bernabeu, E., Eichner, J., Beggan, C., and Thomson, A. W. P.: Generation of 100-year geomagneti-cally induced current scenarios, Space Weath., 10, S04003, doi:10.1029/2011SW000750, 2012.
Royal Academy of Engineering report: Extreme space weather im-pacts on engineered systems and infrastructure, Royal Acad. Eng., Prince Philip House, 3 Carlton House Terr., London SW1Y 5DG, UK, 2013.
Schrijver, C. and Mitchell, S.: Disturbances in the U.S. electric grid associated with geomagnetic activity, J. Space Weath. Space Clim., 3, A19, doi:10.105/swsc/2013041, 2013.
Tsurutani, B. T. and Lin, R. P.: Acceleration of > 47 keV Ions and > 2 keV electrons by interplanetary shocks at 1 AU, J. Geophys. Res., 90, 1–11, doi:10.1029/JA090iA01p00001, 1985.
Tsurutani, B. T., Gonzalez, W. D., Tang, F., Akasofu, S.-I., and Smith, E. J.: Origin of interplanetary southward magnetic fields responsible for major magnetic storms near solar maximum (1978–1979), J. Geophys. Res., 93, 8519–8531, 1988.
Tsurutani, B. T., Arballo, J. K., Lakhina, G. S., Ho, C. M., Ajello, J., Pickett, J. S., Gurnett, D. A., Lepping, R. P., Peterson, W. K., Rostoker, G., Kamide, Y., and Kokubun, S.: The January 10, 1997 auroral hot spot, horseshoe aurora and first substorm: A CME loop?, Geophys. Res. Lett., 25, 3047–3050, 1998. Tsurutani, B. T., Gonzalez, W. D., Lakhina, G. S., and Alex, S.:
The extreme magnetic storm of 1–2 September 1859, J. Geo-phys. Res., 108, A7, 1268, doi:10.1016/S0273-1177(02)00796-2, 2003.
Tsurutani, B. T. and Zhou, X.-Y., Interplanetary shock trigger-ing of substorms: Wind and Polar, Adv. Space Res., 31, 1063, doi:10.1029/2002JA009504, 2003.
Tsurutani, B. T., Echer, E., and Gonzalez, W. D.: The solar and in-terplanetary causes of the recent minimum in geomagnetic activ-ity (MGA23): a combination of midlatitude small coronal holes, low IMFBzvariances, low solar wind speeds and low solar mag-netic fields, Ann. Geophys., 29, 839–849, doi:10.5194/angeo-29-839-2011, 2011.