Meta-Analysis of Public Microarray Datasets
Reveals Voltage-Gated Calcium Gene
Signatures in Clinical Cancer Patients
Chih-Yang Wang
1,2,3, Ming-Derg Lai
2,3, Nam Nhut Phan
4, Zhengda Sun
5, Yen-Chang Lin
6*
1Department of Anatomy, University of California San Francisco, San Francisco, California, United States of America,2Department of Biochemistry and Molecular Biology, College of Medicine, National Cheng Kung University, Tainan, Taiwan,3Institute of Basic Medical Sciences, College of Medicine, National Cheng Kung University, Tainan, Taiwan,4Faculty of Applied Sciences, Ton Duc Thang University, Ho Chi Minh, Vietnam, 5Department of Radiology, University of California San Francisco, San Francisco, California, United States of America,6Graduate Institute of Biotechnology, Chinese Culture University, Taipei, Taiwan
Abstract
Voltage-gated calcium channels (VGCCs) are well documented to play roles in cell
prolifer-ation, migrprolifer-ation, and apoptosis; however, whether VGCCs regulate the onset and
progres-sion of cancer is still under investigation. The VGCC family consists of five members, which
are L-type, N-type, T-type, R-type and P/Q type. To date, no holistic approach has been
used to screen VGCC family genes in different types of cancer. We analyzed the transcript
expression of VGCCs in clinical cancer tissue samples by accessing ONCOMINE (
www.
oncomine.org
), a web-based microarray database, to perform a systematic analysis. Every
member of the VGCCs was examined across 21 different types of cancer by comparing
mRNA expression in cancer to that in normal tissue. A previous study showed that altered
expression of mRNA in cancer tissue may play an oncogenic role and promote tumor
devel-opment; therefore, in the present findings, we focus only on the overexpression of VGCCs
in different types of cancer. This bioinformatics analysis revealed that different subtypes of
VGCCs (CACNA1C, CACNA1D, CACNA1B, CACNA1G, and CACNA1I) are implicated in
the development and progression of diverse types of cancer and show dramatic
up-regula-tion in breast cancer. CACNA1F only showed high expression in testis cancer, whereas
CACNA1A, CACNA1C, and CACNA1D were highly expressed in most types of cancer. The
current analysis revealed that specific VGCCs likely play essential roles in specific types of
cancer. Collectively, we identified several VGCC targets and classified them according to
different cancer subtypes for prospective studies on the underlying carcinogenic
mecha-nisms. The present findings suggest that VGCCs are possible targets for prospective
inves-tigation in cancer treatment.
OPEN ACCESS
Citation:Wang C-Y, Lai M-D, Phan NN, Sun Z, Lin Y-C (2015) Meta-Analysis of Public Microarray Datasets Reveals Voltage-Gated Calcium Gene Signatures in Clinical Cancer Patients. PLoS ONE 10 (7): e0125766. doi:10.1371/journal.pone.0125766
Editor:Jörg D. Hoheisel, Deutsches Krebsforschungszentrum, GERMANY
Received:August 1, 2014
Accepted:March 26, 2015
Published:July 6, 2015
Copyright:© 2015 Wang et al. This is an open access article distributed under the terms of the Creative Commons Attribution License, which permits unrestricted use, distribution, and reproduction in any medium, provided the original author and source are credited.
Data Availability Statement:All relevant data can be accessed through the use of Oncomine Research Edition (https://www.oncomine.org/resource/login. html). All Oncomine dataset titles as well as original article reference are located in S2 Table of the supporting information.
Introduction
In the last few decades, cancer has become a focal cause of death worldwide. Until recently,
therapeutic methods applied as cancer treatments (primarily surgery, chemotherapy, radiation
therapy) had not changed much from 40 years ago. Although different research approaches
have been taken to enhance the survival rate and life quality of cancer patients, much effort
and many more trials are still needed to accelerate and facilitate cancer treatment.
Ion channels are well documented as novel potential therapeutic targets in cancer treatment
due to their integration with many cancer features such as cell proliferation, apoptosis,
meta-static capability and migration [1]. Calcium (Ca
2+) is the key player in cell proliferation,
acti-vating or inhibiting various intracellular enzymes in numerous compartments including the
cytosol, organelles, and nucleus. Intracellular Ca
2+levels, through calmodulin, regulate many
different kinases, phosphatases, cyclases, esterases and ion channels. A number of mechanisms
involving plasma membrane ion channels and ion exchangers associated with the endoplasmic
reticulum and nuclear envelope calcium stores control the levels of free Ca
2+in the protoplasm
[2,
3]. The impact of changes in Ca
2+can be specifically determined by the location, extent,
duration, and timing of intracellular Ca
2+oscillations. For instance, slight variations in Ca
2+could regulate specific cell functions, whereas a substantial alteration of Ca
2+could be
respon-sible for cell proliferation and motility or even cell apoptosis [4].
Calcium channels can be classified into two main types: voltage-gated calcium channels
(VGCCs) and ligand-gated calcium channels. The L-type [5,
6], N-Type [7], P-type [8
–
10],
T-type [11
–
13] and R-type [14,
15] calcium channels that constitute the VGCC family are
involved in the development of various types of cancer (Table 1). In addition, ligand-gated
cal-cium channels regulate many processes occurring at the onset of cancer such as activation of
the IP3 receptor [16] and ryanodine [17].
Microarray technology has introduced an experimental approach without bias into sample
screening and data collection, leading to the creation of hypotheses [44]. Although the data
from these analyses need to be confirmed by further detailed studies, it nonetheless helps to
somehow foresee the trend of information. Genes are usually considered to represent potential
cancer markers when they show differential overexpression in a particular cancer. The existing
literature contains thousands of mRNA expression profile studies of various cancers, and a
large number of datasets have been made publicly available. The proper and full utilization of
this huge resource would therefore accelerate the identification of important cancer markers as
well as facilitate the development of improved molecular signatures. A previous study showed
that altered gene expression in cancer tissue may play an oncogenic role and promote tumor
development; therefore, in the present findings, we focus only on the overexpression of VGCCs
in different types of cancer. We hypothesized, based on our bioinformatics screening, that an
increase in mRNA expression of VGCCs reflects some degree of participation in cancer
pro-gression and development. We have explored potential markers of VGCC overexpression in
cancer using the web-based ONCOMINE microarray database [45,
46]. The current
investiga-tion focused on the novel regulainvestiga-tion of calcium channel family members in different types of
cancer, with the supposition that these clinical data would provide important hints that will
enable further investigation of the roles of these voltage-gated calcium channels in the
progres-sion and development of cancer.
Materials and Methods
The expression of VGCC mRNA in clinical cancer tissues was analyzed by performing a
meta-analysis of public microarray data according to PRISMA guidelines [47,
48] (S1 Table
and
S1
Fig). We used the web-based microarray database called ONCOMINE (www.oncomine.org) to
authors also thank the Ministry of Science andTechnology for the grants MOST103-2325-B006-012 and 104-2917-I-006-002. The funders had no role in study design, data collection and analysis, decision to publish, or preparation of the manuscript.
obtain a systematic analysis of all public cancer microarray data. The website document
“
ONCOMINE Platform Overview Q1 2014
”
indicates that this database contains more than
700 independent datasets comprising nearly 90,000 microarray experiments. Most microarray
expression analyses define the up and down-expression of genes in nearly every major cancer
type as well as in a number of clinical and pathology-based cancer subtypes.
We set threshold criteria to screen potential oncogenes with respect to datasets regulating
VGCC transcript expression in cancer tissues [49,
50]. The statistical levels for the screening
criteria used in this study were as follows: the fold change must above 1.5, the P-value must be
less than 0.05, and the percentile ranking of the gene must be less than 10%. P-values and
sta-tistical significance in different types of cancer for differential expression of VGCCs were
calcu-lated using the ONCOMINE default algorithms, which included two-tailed Student's t-test and
multiple testing corrections. In the present report, a P-value
<
0.05 indicated a statistically
sig-nificant difference between samples. We used a fold-change-based benchmark to identify linear
model correlation between mRNA levels and VGCC gene expression in cancer tissues relative
to normal expression levels in the same tissue section. Only samples with a fold change
>
1.5
were chosen for inclusion in the investigative procedure. The degree of expression was
deter-mined from the gene rank percentile, which typically classified the genes of interest according
to p-values. The top 10% of the altered VGCC genes were used in the analytical process.
Ulti-mately, we retained 50 studies integrating 8174 samples (S2 Table
and
S1 Fig).
To present the collected datasets, samples must be reviewed and grouped into logical sample
sets. The analysis types are matched cancer/normal tissue and the numerous molecular
sub-types, biomarker status, treatment responses, and other miscellaneous comparisons. After the
classification of logical analyses, each gene was assessed using different statistical analyses such
as Student
’
s t-test and Pearson
’
s correlation depending on how many classes of ordinal
analy-ses were found. These tests were completed using the R statistical computing package (http://
www.r-project.org). Tests were carried out as one-sided or two-sided based on the type of
expression analysis. To rationalize the numerous hypothesis assessments, we computed Q
Table 1. Voltage-gated calcium channel localization and functions.Channel Current Associated subunits
Expression detected General Cellular functions References
Cav1.1 (CACNA1S) L α2δ,β,γ Brain, Leukemia Excitation-contraction coupling [18–23]
Cav1.2 (CACNA1C) L α2δ,β,γ Colorectal, Gastric, Pancreas, Sarcoma, Leukemia, Brain, Breast, Uterus, Skin, Prostate
Excitation-contraction coupling [18–23]
Cav1.3 (CACNA1D) L α2δ,β,γ Prostate, Breast, Colorectal, Bladder, Gastric, Lung, Brain, Uterus, Esophagus
Excitation-contraction coupling [18–23]
Cav1.4 (CACNA1F) L α2δ,β,γ Testis Excitation-contraction coupling [18–23]
Cav2.1 (CACNA1A) P/Q α2δ,β, possiblyγ Leukemia, Ovarian, Sarcoma, Brain, Uterus, Ovarian, Lung, Cervix,
Neurotransmitter release; dendritic Ca2+ transients; hormone release
[18,19,24–
29] Cav2.2 (CACNA1B) N α2δ/β1,β3,β4,
possiblyγ
Prostate, Breast Neurotransmitter release; dendritic Ca2+ transients; hormone release
[18,19,28,
30–33] Cav2.3 (CACNA1E) R α2δ,β, possiblyγ Esophagus, Uterus Repetitivefiring; dendritic calcium
transients
[18,19,34–
37] Cav3.1 (CACNA1G) T None Sarcoma, Colorectal, Uterus, Lung,
Prostate, Breast
Pacemaking; repetitivefiring [18,19,38–
43]
Cav3.2 (CACNA1H) T None Renal, Sarcoma, Gastric Pacemaking; repetitivefiring [18,19,38–
43] Cav3.3 (CACNA1I) T None Breast, Sarcoma, Esophagus Pacemaking; repetitivefiring [18,19,38–
43]
values using the following equation: Q = NP / R where P is the P-value, N is the number of
genes analyzed, and R is the sorted rank of the P-value [45,
46]. The expression of the gene
CACNA1A in ovarian [51], breast [52], lung [53] and gastric cancer was analyzed using the
Kaplan-Meier Plotter (http://kmplot.com/analysis/) database, which consists of a pool of gene
expression and clinical data. Up to the present, this database covers information on 22,277
genes and their influence on survival in 4,142, 1,648, 765 and 2,437 patients with breast,
ovar-ian, gastric and lung cancer, respectively. We focused our analysis on overall survival patient
information. There are two groups of patient samples, which are higher and lower expression
levels. A Kaplan-Meier survival plot was employed to compare the expression of CACNA1A in
those two groups. The hazard ratio with 95% confidence intervals and log rank
p value
was also
computed (S2
and
S3
Figs).
Results and Discussion
1. Voltage-gated calcium channel family promotes cancer development
The dynamic balance between extracellular and intracellular Ca2+ generally regulates calcium
signals [54]. This oscillation plays a crucial role in a cell
’
s ability to recommence the cell cycle,
to stimulate DNA synthesis at the G1/S transition, and to enter into mitosis during M phase of
the cell cycle [4]. The potential of the so-called T-type calcium channel subtype to moderate
the intracellular Ca2+ level has made this channel a focus for regulation in malignant tumor
cells [4].
Calcium channels are key players in the cell proliferation process. T-type calcium channels
have recently drawn attention as potential therapeutic targets in cancer treatment. A T-type
calcium channel inhibitor leads to cell growth inhibition and apoptosis in HCT116 cells [55]. It
is also well documented that T-type selective properties have anti-proliferative effects in
malig-nant tumor cells [56]. T-type channels are well documented to be involved in cell growth and
differentiation, to be over-expressed in various stages of tumors, and to participate in
calcium-mediated cell growth [55
–
58]. In addition, T-type calcium channels are broadly expressed in
different types of cancer and play a key role in cell proliferation [57,
59]. Several calcium
chan-nel blockers, such as verapamil [60], nifedipine [61], TH-1177 [62], 2-APB [63], and SK&F
96365 [64], have been confirmed to inhibit receptor-gated calcium channels, but the particular
subtypes of calcium channel have not been investigated. Instead, the involvement of calcium
channels in cell growth has been highlighted. We hypothesize that focusing on specific calcium
channel subtypes may identify the ones that are controlling the proliferation of different cell
types.
Cell migration plays a vital role in various physiological processes such as neural crest cell
immigration, leukocyte discharge from the vasculature, and the relocation of fibroblasts during
wound healing. Cell migration is also extremely pivotal in metastatic diseases and the
develop-ment of malignancies. The fundadevelop-mental mechanism that promotes cell migration is
indistin-guishable with respect to different cell types. Calcium channel types correlate with various
types of cancer, e.g., breast [65], prostate [66], and ovarian [67] cancer. Ca2+ channel activity
also triggers oxidative phosphorylation, programmed cell death, and alterations in the
apopto-sis signaling pathway [68].
employing the web-based ONCOMINE microarray database to analyze altered VGCC mRNA
expression in 21 types of cancer. We compared the cancer tissue to normal tissue controls and
set threshold criteria for screening a suitable dataset from the ONCOMINE database. Inclusion
of a suitable dataset for further analysis required that comparisons of gene expression between
cancer and normal tissues obeyed specific threshold criteria: the fold change must be above 1.5,
the p-value must be less than 0.05, and the gene-ranking percentile must be less than 10%. The
fold change, p-value, and the top gene-ranking percentile are presented in
Fig 1
for different
VGCC genes in different types of cancer tissues.
2. L-type calcium channel family
The L-type calcium channel genes investigated here include Cav1.1 (CACNA1S), Cav1.2
(CACNA1C), Cav1.3 (CACNA1D), and Cav1.4 (CACNA1F), commonly localized in smooth
muscle, skeletal muscle, ventricular myocytes, and bone (osteoblasts). Previous studies on the
role of the L-type calcium channel were primarily focused on the physiological and
pharmaco-logical aspects [71,
72]; hence, its function is largely unknown in terms of cancer diseases. Our
data revealed that CACNA1S was overexpressed relative to normal tissue samples in acute
myeloid leukemia (with a 2.42-fold change), in brain desmoplastic medulloblastoma (with a
1.89-fold change), and in primitive neuroectodermal tumors (with a 1.81-fold change)
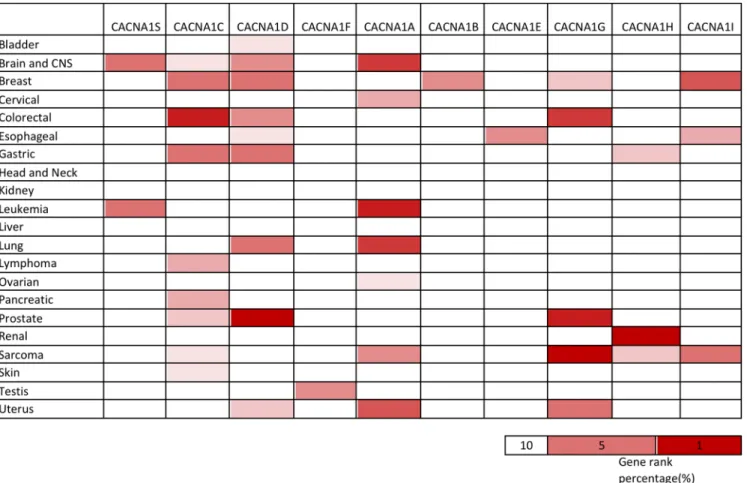
Fig 1. Expression of voltage-gated calcium channel (VGCC) genes in different types of cancer.Expression of voltage-gated calcium channel (VGCC) genes in 21 types of cancers compared to normal tissue controls. The gene name of each channel is shown. Each gene was found in its tissue of origin, and the color gradient correlates with decreasing gene rank percentile. The search criteria threshold was set at p-value<0.05 with fold change>1.5 and gene rank percentile<10% for screening microarray datasets of cancer versus normal cases.(Table 2). CACNA1S also ranked in the top 5% of upregulated genes in both leukemia and
brain cancer (Fig 1).
Previous research showed that CACNA1C could cause pathophysiology of psychiatric
dis-ease [100], and CACNA1C has high transcript activity in the prostate stroma [101]. We found
high CACNA1C expression in prostate carcinoma in comparison to normal tissue in the
Can-cer research 2002/08/01 [86] database (Table 2). These data are consistent with those of a
previ-ous study [101]. We also found high expression of CACNA1C in most cancer types, including
colorectal, gastric, pancreas, brain, breast, uterus, skin, and prostate cancers and leukemia
(Table 2). We further found that 10 out of 21 different tumor tissues showed upregulation,
with CACNA1C appearing in the top 10% of the most augmented genes (Fig 1). For example,
colorectal cancers such as colon adenoma, adenocarcinoma, and rectal adenoma showed
sig-nificant upregulation of CACNA1C when compared to normal control tissues, with p-values
ranging from 2.58E-5 to 7.33E-14 and CACNA1C ranking from 2% to 8%. CACNA1C
expres-sion was also elevated in pancreatic carcinoma compared to normal tissue, with a 13.118-fold
increase, a p-value of 4.07E-4, and gene ranking at 7%.
CACNA1D is believed to regulate cell firing [102] and has a high correlation with prostate
cancer [17]; however, its expression in other cancer types is still largely unstudied. Our
bioin-formatics analysis verified that CACNA1D was highly expressed in most types of cancer,
including prostate and breast cancer (Table 2). These data are consistent with the findings of a
previous study [17]. We also found that 9 of the 21 tissue sections from cancer patients showed
overexpression, with CACNA1D categorized in the top 10% of the most elevated genes (Fig 1).
Prostate cancers such as prostate carcinoma, intraepithelial neoplasia, and adenocarcinoma all
showed dramatic overexpression of CACNA1D relative to normal tissues. Upregulation ranged
from 1.747- to 17.129-fold in terms of CACNA1D transcript expression, with p-values ranging
from 0.015 to 3.31E-11 and gene rankings ranging from the top 1% to the top 4%. Breast
can-cers such as invasive lobular breast carcinoma, invasive ductal and lobular carcinoma, mixed
lobular and ductal breast carcinoma, and invasive mixed breast carcinoma all exhibited
sub-stantial overexpression of CACNA1D relative to control samples. Upregulation ranged from
2.99- to 4.84-fold in terms of CACNA1D transcript expression, with p-values ranging from
0.025 to 2.52E-10 and gene rankings ranging from the top 5% to the top 7%. A particularly
novel finding was that CACNA1D was highly expressed in prostate cancer but also in breast,
colorectal, bladder, gastric, lung, brain, uterine, and esophageal tumors. Our
in silico
analysis
suggests that CACNA1D may be a novel oncogene in cancer development, but further
experi-ments are needed to explore the details of the role of CACNA1D in cancer progression.
A larger role in human physiology beyond its function in photoreceptors was suggested for
CACNA1F [102]; however, the role of CACNA1F in cancer remains obscure. Only one study
satisfied the selection benchmark with a 1.89-fold change in CACNA1F expression in testicular
teratoma [103], wherein CACNA1F ranked in the top 6% of testicular teratoma gene changes
and the p-value was 0.018 (Table 2).
3. P/Q-type calcium channel family
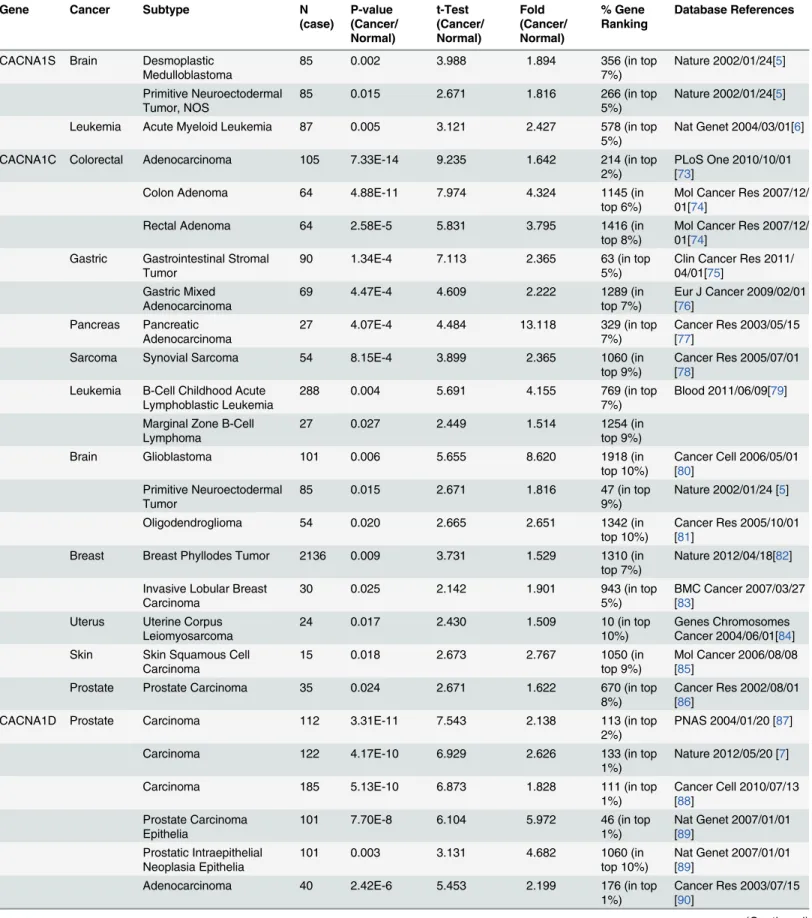
Table 2. L-type calcium channel expression in cancer.
Gene Cancer Subtype N
(case) P-value (Cancer/ Normal) t-Test (Cancer/ Normal) Fold (Cancer/ Normal) % Gene Ranking Database References
CACNA1S Brain Desmoplastic Medulloblastoma
85 0.002 3.988 1.894 356 (in top
7%)
Nature 2002/01/24[5]
Primitive Neuroectodermal Tumor, NOS
85 0.015 2.671 1.816 266 (in top
5%)
Nature 2002/01/24[5]
Leukemia Acute Myeloid Leukemia 87 0.005 3.121 2.427 578 (in top
5%)
Nat Genet 2004/03/01[6]
CACNA1C Colorectal Adenocarcinoma 105 7.33E-14 9.235 1.642 214 (in top
2%)
PLoS One 2010/10/01 [73]
Colon Adenoma 64 4.88E-11 7.974 4.324 1145 (in
top 6%)
Mol Cancer Res 2007/12/ 01[74]
Rectal Adenoma 64 2.58E-5 5.831 3.795 1416 (in
top 8%)
Mol Cancer Res 2007/12/ 01[74]
Gastric Gastrointestinal Stromal Tumor
90 1.34E-4 7.113 2.365 63 (in top
5%)
Clin Cancer Res 2011/ 04/01[75]
Gastric Mixed Adenocarcinoma
69 4.47E-4 4.609 2.222 1289 (in
top 7%)
Eur J Cancer 2009/02/01 [76]
Pancreas Pancreatic Adenocarcinoma
27 4.07E-4 4.484 13.118 329 (in top
7%)
Cancer Res 2003/05/15 [77]
Sarcoma Synovial Sarcoma 54 8.15E-4 3.899 2.365 1060 (in
top 9%)
Cancer Res 2005/07/01 [78]
Leukemia B-Cell Childhood Acute Lymphoblastic Leukemia
288 0.004 5.691 4.155 769 (in top
7%)
Blood 2011/06/09[79]
Marginal Zone B-Cell Lymphoma
27 0.027 2.449 1.514 1254 (in
top 9%)
Brain Glioblastoma 101 0.006 5.655 8.620 1918 (in
top 10%)
Cancer Cell 2006/05/01 [80]
Primitive Neuroectodermal Tumor
85 0.015 2.671 1.816 47 (in top
9%)
Nature 2002/01/24 [5]
Oligodendroglioma 54 0.020 2.665 2.651 1342 (in
top 10%)
Cancer Res 2005/10/01 [81]
Breast Breast Phyllodes Tumor 2136 0.009 3.731 1.529 1310 (in
top 7%)
Nature 2012/04/18[82]
Invasive Lobular Breast Carcinoma
30 0.025 2.142 1.901 943 (in top
5%)
BMC Cancer 2007/03/27 [83]
Uterus Uterine Corpus Leiomyosarcoma
24 0.017 2.430 1.509 10 (in top
10%)
Genes Chromosomes Cancer 2004/06/01[84] Skin Skin Squamous Cell
Carcinoma
15 0.018 2.673 2.767 1050 (in
top 9%)
Mol Cancer 2006/08/08 [85]
Prostate Prostate Carcinoma 35 0.024 2.671 1.622 670 (in top
8%)
Cancer Res 2002/08/01 [86]
CACNA1D Prostate Carcinoma 112 3.31E-11 7.543 2.138 113 (in top
2%)
PNAS 2004/01/20 [87]
Carcinoma 122 4.17E-10 6.929 2.626 133 (in top
1%)
Nature 2012/05/20 [7]
Carcinoma 185 5.13E-10 6.873 1.828 111 (in top
1%)
Cancer Cell 2010/07/13 [88]
Prostate Carcinoma Epithelia
101 7.70E-8 6.104 5.972 46 (in top
1%)
Nat Genet 2007/01/01 [89]
Prostatic Intraepithelial Neoplasia Epithelia
101 0.003 3.131 4.682 1060 (in
top 10%)
Nat Genet 2007/01/01 [89]
Adenocarcinoma 40 2.42E-6 5.453 2.199 176 (in top
1%)
Cancer Res 2003/07/15 [90]
[106,
107]. Different mutations in alpha subunit 1A lead to certain neuronal degradation
dis-eases such as episodic ataxia type-2, familial hemiplegic migraine and spinocerebellar ataxia
type-6 [108
–
112]. In the present study, we found that CACNA1A was highly expressed in
Table 2. (Continued)Gene Cancer Subtype N
(case) P-value (Cancer/ Normal) t-Test (Cancer/ Normal) Fold (Cancer/ Normal) % Gene Ranking Database References
Carcinoma 57 1.53E-5 4.566 1.747 1 (in top
1%)
Cancer Res 2006/04/15 [91]
Carcinoma 21 2.57E-5 5.486 4.061 49 (in top
1%)
Clin Cancer Res 2009/ 09/15[92]
Adenocarcinoma 89 3.57E-4 3.760 2.059 393 (in top
4%)
Cancer Res 2008/02/01 [93]
Carcinoma 30 0.002 3.439 6.348 127 (in top
1%)
Mol Carcinog 2002/01/01 [94]
Carcinoma 15 0.015 2.701 17.129 197 (in top
4%)
Cancer Res 2001/08/01 [95]
Breast Invasive Lobular Breast Carcinoma
593 2.52E-10 7.399 3.431 1031 (in
top 6%)
TCGA
Mixed Lobular and Ductal Breast Carcinoma
593 1.35E-4 6.197 4.200 914 (in top
5%)
TCGA
Invasive Ductal and Lobular Carcinoma
593 0.002 8.208 4.839 1474 (in
top 8%)
TCGA
Invasive Mixed Breast Carcinoma
63 0.011 2.804 4.365 708 (in top
5%)
PNAS 2005/08/02 [96]
Invasive Ductal Breast Carcinoma
63 0.021 2.354 2.991 1157 (in
top 7%)
PNAS 2005/08/02 [96]
Invasive Lobular Breast Carcinoma
63 0.025 2.222 2.996 1025 (in
top 7%)
PNAS 2005/08/02 [96]
Colorectal Adenocarcinoma 105 2.45E-8 6.148 1.527 1089 (in
top 6%)
PLoS One 2010/10/01 [73]
Adenoma 105 1.32E-5 6.949 3.577 1150 (in
top 6%)
PLoS One 2010/10/01 [73]
Rectosigmoid Adenocarcinoma
237 1.68E-5 5.628 1.788 663 (in top
4%)
TCGA
Bladder Superficial Bladder Cancer 60 4.49E-6 5.087 2.114 1089 (in
top 9%)
Cancer Res 2004/06/01 [97]
Gastric Gastric Mixed Adenocarcinoma
69 1.13E-4 5.235 3.467 856 (in top
5%)
Eur J Cancer 2009/02/01 [76]
Gastric Cancer 160 7.45E-4 3.246 1.519 1058 (in
top 6%)
Nucleic Acids Res 2011/ 03/01[98]
Lung Lung Carcinoid Tumor 203 2.50E-4 4.121 3.611 396 (in top
5%)
PNAS 2001/11/20[99]
Brain Glioblastoma 101 3.85E-4 6.345 3.293 1069 (in
top 6%)
Cancer Cell 2006/05/01 [80]
Uterus Uterine Corpus Leiomyoma
77 5.44E-4 3.496 2.143 1492 (in
top 8%)
Cancer Res 2009/08/01 [14]
Esophagus Adenocarcinoma 48 6.66E-4 4.155 2.447 318 (in top
9%)
Gastroenterology 2006/ 09/01[15]
Barrett's Esophagus 48 0.002 3.242 2.123 1158 (in
top 8%)
Gastroenterology 2006/ 09/01[15]
CACNA1F Testis Testicular Teratoma 30 0.018 2.859 1.896 829 (in top
6%)
Cancer Res 2005/07/01 [78]
most cancers, including leukemia and ovarian cancer (Table 3). We also found that 7 out of 21
cancer tissues showed high expression of CACNA1A, and it was categorized in the top 10% of
the most increased genes (Fig 1). Leukemias such as chronic lymphocytic leukemia,
monoclo-nal gammopathy of undetermined significance, skin squamous cell carcinoma, and margimonoclo-nal
zone b-cell lymphoma all presented significant overexpression of CACNA1A relative to control
samples. The
in silico
analysis showed increased expression ranging from 1.77- to 2.27-fold for
CACNA1A with p-values ranging from 0.003 to 3.56E-80 and gene rankings ranging from the
top 2% to 5%. Lung carcinoma cells showed the most significant increases in expression relative
to control samples with 15.568-fold up-regulation, a p-value of 0.001, and a gene ranking in
the top 4%. Overall, our bioinformatics analysis indicated that CACNA1A may be a potential
therapeutic target for leukemia, lung, ovarian, brain, uterine, and cervical cancers.
When applying Kaplan-Meier plotter analysis, correlations between the overexpression of
CACNA1A and overall lower survival rates in lung cancer [53] and ovarian cancer (S2 Fig)
were shown by using the GSE9891 database [51,
113]. This result is consistent with our data in
Table 3. The high expression of CACNA1A shows that this gene is possibly involved in the
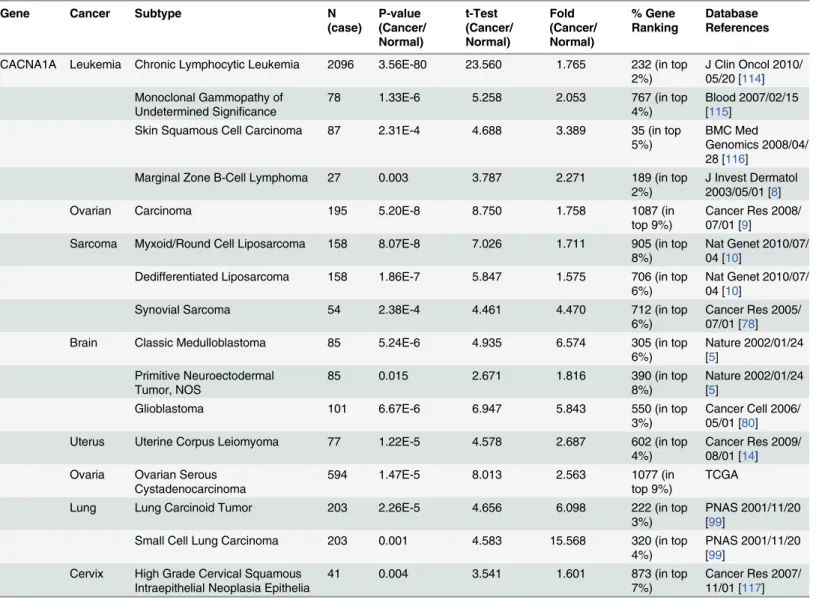
Table 3. P-type calcium channel expression in cancer.Gene Cancer Subtype N
(case) P-value (Cancer/ Normal) t-Test (Cancer/ Normal) Fold (Cancer/ Normal) % Gene Ranking Database References
CACNA1A Leukemia Chronic Lymphocytic Leukemia 2096 3.56E-80 23.560 1.765 232 (in top 2%)
J Clin Oncol 2010/ 05/20 [114] Monoclonal Gammopathy of
Undetermined Significance
78 1.33E-6 5.258 2.053 767 (in top
4%)
Blood 2007/02/15 [115]
Skin Squamous Cell Carcinoma 87 2.31E-4 4.688 3.389 35 (in top
5%)
BMC Med Genomics 2008/04/ 28 [116]
Marginal Zone B-Cell Lymphoma 27 0.003 3.787 2.271 189 (in top
2%)
J Invest Dermatol 2003/05/01 [8]
Ovarian Carcinoma 195 5.20E-8 8.750 1.758 1087 (in
top 9%)
Cancer Res 2008/ 07/01 [9]
Sarcoma Myxoid/Round Cell Liposarcoma 158 8.07E-8 7.026 1.711 905 (in top
8%)
Nat Genet 2010/07/ 04 [10]
Dedifferentiated Liposarcoma 158 1.86E-7 5.847 1.575 706 (in top
6%)
Nat Genet 2010/07/ 04 [10]
Synovial Sarcoma 54 2.38E-4 4.461 4.470 712 (in top
6%)
Cancer Res 2005/ 07/01 [78]
Brain Classic Medulloblastoma 85 5.24E-6 4.935 6.574 305 (in top
6%)
Nature 2002/01/24 [5]
Primitive Neuroectodermal Tumor, NOS
85 0.015 2.671 1.816 390 (in top
8%)
Nature 2002/01/24 [5]
Glioblastoma 101 6.67E-6 6.947 5.843 550 (in top
3%)
Cancer Cell 2006/ 05/01 [80]
Uterus Uterine Corpus Leiomyoma 77 1.22E-5 4.578 2.687 602 (in top
4%)
Cancer Res 2009/ 08/01 [14] Ovaria Ovarian Serous
Cystadenocarcinoma
594 1.47E-5 8.013 2.563 1077 (in
top 9%)
TCGA
Lung Lung Carcinoid Tumor 203 2.26E-5 4.656 6.098 222 (in top
3%)
PNAS 2001/11/20 [99]
Small Cell Lung Carcinoma 203 0.001 4.583 15.568 320 (in top
4%)
PNAS 2001/11/20 [99]
Cervix High Grade Cervical Squamous Intraepithelial Neoplasia Epithelia
41 0.004 3.541 1.601 873 (in top
7%)
Cancer Res 2007/ 11/01 [117]
onset and progression of lung and ovarian cancer (poor prognosis). In contrast, an opposite
trend was observed in breast and stage IV gastric cancer with low expression of CACNA1A
[52]. These data show consistency with
Fig 1. In other words, CACNA1A was down-regulated
in breast and gastric cancer (S3 Fig). These studies showed that CACNA1 expression plays an
essential role in the progression of ovarian and lung cancer.
4. N-type calcium channel family
The N-type calcium channel family contains only Cav2.2 (CACNA1B), which is located
throughout the brain and peripheral nervous system. Previous studies have shown that
CAC-NA1B is important for sustained neuronal firing and neurotransmitter release in neuropathic
pain [25,
29]; however, until now, CACNA1B has not been implicated in cancer. Our
bioinfor-matics results indicated thatCACNA1B was among the top 9% and top 6% of overexpressed
genes in prostate and breast cancer, respectively. In these cancers, increases in CACNA1B
expression ranged from 1.53- to 1.56-fold, with p-values from 3.25E-4 to 6.22E-4 relative to
control samples (Table 4). Our data suggest that CACNA1B has high expression specifically in
clinical prostate and breast cancer tissues. Identification of the underlying role of CACNA1B
in cancer development may also help in the discovery of new therapeutic targets for the
treat-ment of prostate and breast cancer.
5. T-type calcium channel family
Cav3.1 (CACNA1G), Cav3.2 (CACNA1H), and Cav3.3 (CACNA1I) are all classified into the
T-type calcium channel family, which is localized in neuronal cells, pacemaker cells and
osteo-cytes (mature bone cells). In addition, another study using ONCOMINE showed that the
expression of T-type channel isoforms in an array of malignant tumor cells was significantly
elevated relative to surrounding normal tissue [118]. This outcome is consistent with the
pres-ent findings (Table 5). Increased expression of CACNA1G was detected in a broad range of
cancer diseases, with CACNA1G in the top 1% of overexpressed genes in synovial sarcoma and
in the top 2% in prostate carcinoma. The fold changes ranged from 1.737 to 6.376 and the
p-values from 8.70E-4 to 1.71E-7 (Table 5). High expression of CACNA1G was also noted in
other tumor types such as colorectal, uterine, prostate, and breast cancer.
CACNA1H showed altered expression in renal cancer, sarcoma, and gastrointestinal
stro-mal tumors (Fig 1). CACNA1H was located in the top 1% of overexpressed genes in clear cell
sarcoma of the kidney and in the top 8% of upregulated genes in synovial sarcoma and
gastro-intestinal stromal tumors. Compared to normal tissue, the fold change ranged from 5.19 to
9.29 and p-values ranged from 1.51E-6 to 0.005.
CACNA1I showed altered expression in invasive breast cancer, myxoid/round cell
liposar-coma, and esophageal adenocarcinoma (Fig 1). CACNA1I was found in the top 4% to 7% of
upregulated genes in invasive breast carcinoma stroma and ductal breast carcinoma
in situ
epi-thelia, with p-values of 3.04E-16 and 0.002 and fold changes ranging from 1.586 to 2.35,
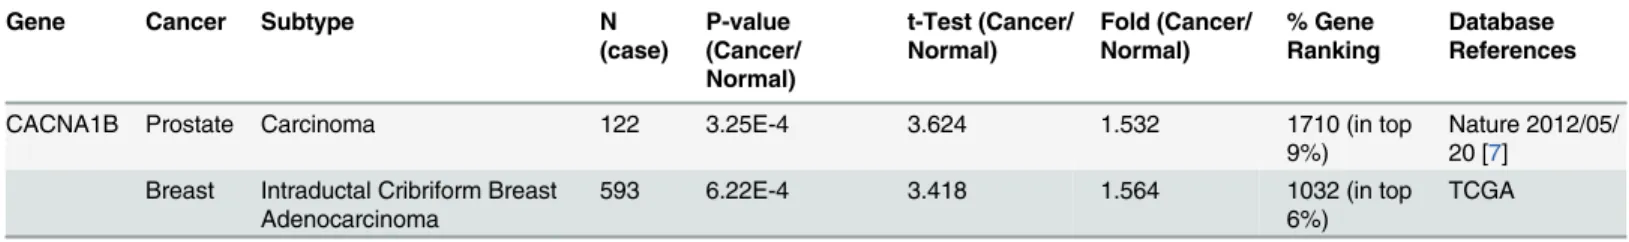
Table 4. N-type calcium channel expression in cancer.
Gene Cancer Subtype N
(case)
P-value (Cancer/ Normal)
t-Test (Cancer/ Normal)
Fold (Cancer/ Normal)
% Gene Ranking
Database References
CACNA1B Prostate Carcinoma 122 3.25E-4 3.624 1.532 1710 (in top
9%)
Nature 2012/05/ 20 [7]
Breast Intraductal Cribriform Breast Adenocarcinoma
593 6.22E-4 3.418 1.564 1032 (in top
6%)
TCGA
respectively. High expression of CACNA1I was also found in sarcoma and esophageal cancer
(Table 5).
T-type calcium channels have recently drawn the attention of researchers as potential
thera-peutic targets in cancer treatment. T-type channels are well documented to be involved in cell
growth and differentiation, to be re-expressed in various tumor phases, and to be involved in
calcium-mediated cell death. T-type calcium channels are highly expressed in most types of
cancer [121,
122]. Therefore, the development of a specific inhibitor or antagonist drug may
serve as a potential approach to treating cancer.
6. R-type calcium channel family
The R-type calcium channel family contains only Cav2.3 (CACNA1E), which is most often
found in cerebellar granule cells and other neurons. CACNA1E was among the top 6% and top
10% of genes overexpressed in esophageal and uterine cancers, respectively. In those cancers,
CACNA1E expression increases ranged from 2.09- to 9.19-fold, with p-values from 1.91E-4 to
0.001 relative to the control samples (Table 6). Hence, CACNA1E may also serve as a novel
therapeutic target for esophageal and uterine cancers.
Table 5. T-type calcium channel expression in cancer.
Gene Cancer Subtype N
(case) P-value (Cancer/ Normal) t-Test (Cancer/ Normal) Fold (Cancer/ Normal) % Gene Ranking Database References
CACNA1G Sarcoma Synovial Sarcoma 54 1.71E-7 9.065 6.376 42 (in top
1%)
Cancer Res 2005/07/ 01 [11]
Dedifferentiated Liposarcoma
54 0.002 3.374 1.850 332 (in top
3%)
Cancer Res 2005/07/ 01 [11]
Colorectal Rectosigmoid Adenocarcinoma
237 3.72E-6 5.749 1.866 516 (in top
3%)
TCGA
Uterus Uterine Corpus Leiomyoma
77 4.21E-5 4.279 1.743 796 (in top
5%)
Cancer Res 2009/08/ 01 [14]
Lung Adenocarcinoma 66 7.72E-4 3.334 1.956 215 (in top
10%)
BMC Genomics 2007/ 06/01 [119]
Prostate Carcinoma 19 8.70E-4 4.132 1.737 302 (in top
2%)
Cancer Cell 2005/11/ 01 [120]
Breast Invasive Lobular Breast Carcinoma
30 0.042 1.908 2.007 1533 (in top
8%)
BMC Cancer 2007/03/ 27 [83]
CACNA1H Renal Clear Cell Sarcoma of the Kidney
35 1.51E-6 7.591 5.193 112 (in top
1%)
Clin Cancer Res 2005/ 11/15 [12]
Renal Wilms Tumor 35 0.005 3.566 1.704 808 (in top
7%)
Clin Cancer Res 2005/ 11/15 [12]
Sarcoma Synovial Sarcoma 54 5.68E-4 4.402 6.103 940 (in top
8%)
Cancer Res 2005/07/ 01 [78]
Gastric Gastrointestinal Stromal Tumor
90 5.69E-4 6.075 9.290 1509 (in top
8%)
Clin Cancer Res 2011/ 04/01 [75]
CACNA1I Breast Invasive Breast Carcinoma Stroma
59 3.04E-16 15.313 2.348 758 (in top
4%)
Nat Med 2008/05/01 [13]
Ductal Breast Carcinoma in Situ Epithelia
66 0.002 3.748 1.566 1241 (in top
7%)
Breast Cancer Res 2009/02/02 Sarcoma Myxoid/Round Cell
Liposarcoma
158 9.11E-9 7.885 1.899 628 (in top
5%)
Nat Genet 2010/07/04 [10]
Esophagus Esophageal Adenocarcinoma
48 3.43E-4 5.451 2.436 1014 (in top
7%)
Gastroenerology 2006/ 09/01[15]
7. VGCCs and their relationship to metastatic cancer
Cancer cells are able to metastasize or spread to other tissues or organs during tumor growth
[123]. As the original tumor progresses through angiogenesis [124], it supposedly promotes
the circulation of cancerous cells in the peripheral blood system [125] or lymphatic system
[126] and their migration to other tissues or organs [127]. These cells then begin growing in
the host organs. However, these metastatic growths are not easy to detect and often lead to the
death of the patient. Gene expression profiling of human primary breast tumors can predict
metastasis risk, and metastatic cancer is also often correlated with poor prognosis [128].
There-fore, understanding the association between VGCCs and metastatic cancer represents an
important facet of cancer research. However, the correlation between VGCCs and metastatic
cancer remains obscure. Hence, exploration of the VGCC gene expression profiles in clinical
cancer patients may be useful for predicting metastasis risk.
Invasive lobular breast carcinoma has been frequently found to metastasize to the
gastrointes-tinal tract, peritoneum, retroperitoneum, and gynecological organs [129
–
131]. The BMC Cancer
database [83] revealed CACNA1C expression in invasive lobular breast carcinoma/normal tissue
with a 1.9-fold change (Table 2); thus, we speculated that patients with invasive lobular breast
carcinoma with high expression of CACNA1C relative to normal tissue were at risk for
metasta-sis to the gastrointestinal tract, peritoneum, retroperitoneum, and gynecological organs.
The TCGA and PNAS databases [96] indicated that CACNA1D was significantly
overex-pressed relative to normal tissue in invasive lobular breast carcinoma with invasive ductal and
lobular carcinoma (Table 2), which again implies that patients with high expression of
CAC-NA1D were likely to develop those diseases.
The BMC Cancer database [83] revealed that CACNA1G expression in invasive lobular
breast carcinoma samples underwent a 2.0-fold change relative to normal samples (Table 5).
This also implies that patients with CACNA1G overexpression relative to normal tissue were
likely to experience gastrointestinal tract, peritoneum, retroperitoneum, or gynecological organ
transfer. In addition, abundant expression of JMJD2C was noted in invasive breast carcinoma
stroma, which would also lead to metastatic disease [132]. The Nat Med database [13] showed
a 2.3-fold change in CACNA1I in invasive breast carcinoma stroma, again implying that
patients with high CACNA1G expression would likely develop cancer.
Most types of cancer, including blood cancers and lymphatic system cancers (i.e., leukemia,
multiple myeloma, and lymphoma), are able to bring about metastatic tumors. Although rare,
blood and lymphatic system cancers have been reported to metastasize to other organs such as
the lungs, heart, central nervous system, and other tissues [133
–
136]. Cardiac metastases were
found in 53 out of 247 necropsied patients with leukemia or lymphoma [137]. The Nat Genet
database indicated that L-type calcium channels, such as CACNA1S, were overexpressed in
leukemia/normal tissue with a 2.42-fold change [6] (Table 2). The Blood database indicated
high expression of CACNA1C in leukemia relative to normal samples [79] (Table 2). We also
found that the P-type CACNA1A calcium channel gene was highly expressed in leukemia
Table 6. R-type calcium channel expression in cancer.Gene Cancer Subtype N
(case)
P-value (Cancer/ Normal)
t-Test (Cancer/ Normal)
Fold (Cancer/ Normal)
% Gene Ranking
Database References
CACNA1E Esophagus Adenocarcinoma 48 1.91E-4 5.855 9.193 829 (in top
6%)
Gastroenterology 2006/ 09/01[15]
Uterus Uterine Corpus Leiomyoma
77 0.001 3.148 2.095 1901 (in top
10%)
Cancer Res 2009/08/01 [14]
compared to normal samples [8,
9,
115,
116] (Table 3). Thus, we speculated that leukemia
patients with high expression of CACNA1S, CACNA1C, or CACNA1A relative to normal
samples are likely to experience metastasis of the cancer cells to the lungs, heart, central
ner-vous system, and other tissues.
8. Voltage-gated calcium channels in clinical applications
In silico
bioinformatics analysis is playing an important role in linking cancer gene expression
profiling with potential clinical cancer markers. This type of systematic analysis provides a
holistic global view of the clinical data for VGCC gene family expression in various types of
cancer diseases, and it also confirmed that expression of VGCC genes may change greatly in
metastatic diseases. One interesting feature was that various types of VGCC genes appear to
take part in diverse types of cancer. For instance, breast cancer showed dramatic upregulation
of CACNA1C, CACNA1D, CACNA1B, CACNA1G, and CACNA1I [13,
82,
83,
96,
138].
Likewise, brain and CNS tumors showed significantly increased expression of CACNA1S,
CACNA1C, CACNA1D, and CACNA1A [5,
80]. Our results indicate that CACNA1F is highly
expressed only in testis cancer and that CACNA1B is up-regulated only in breast cancer.
Our approach to bioinformatics analysis also utilized the integration and validation of
mul-tiple microarray datasets so that the most novel voltage-gated calcium channel markers could
be identified for further investigation. Identifying novel VGCC targets and classifying different
subtypes of cancers on the basis of DNA microarray data may promote the development of
new cancer therapy drugs.
Recently, overexpression of the L-type CACNA1D calcium channel gene was confirmed in
prostate cancer [139]. In the current research, the CACNA1 family was found to be highly
expressed in several varieties of cancer including breast, bladder, colorectal, lung, esophageal,
brain and CNS, uterine, and gastric cancers. The finding of an association between colorectal
cancer and CACNA1D strongly suggests a new direction for cancer diagnosis and treatment.
CACNA1D was found to be expressed in colorectal cancer in the 6th percentile in terms of
gene ranking (from the 1st to 10th percentile).
Some studies on calcium channel blockers have been conducted to identify potential targets
for cancer suppression [140,
141]. Ligand-gated calcium channels have also been identified as
potential therapeutic targets apart from VGCCs. A recent study indicated an association
between oncogenic K-Ras IP3-dependent suppression and a calcium release mechanism that
strongly suggests a role for IP3 in the function of ligand-gated calcium channels involved in
colorectal cancer [142].
In conclusion, the current findings show the overexpression of calcium channels in a
num-ber of cancer diseases. The overexpression of many calcium channel subunits in cancers shows
that they are likely involved in the development of various types of cancer. The observation of
overexpression of CACNA1A, CACNA1C, and CACNA1D could make them likely targets in
cancer treatment, as it suggests that blockage or partial inhibition of their expression could
help to modulate the status of metastatic diseases. However, further detailed investigations on
the mechanism of how calcium channel subunits play roles in cancer onset and progression
need to be conducted. The present study could serve as a tool for cancer diagnostics and assist
in the search more applicable and specific types of cancer treatments.
Supporting Information
S1 Fig. Flow chart presenting the identification and collection of the studies for the
statisti-cal meta-analysis.
S2 Fig. The CACNA1A gene in breast, gastric, ovarian and lung cancer (Kaplan-Meier
Plot-ter).
Kaplan-Meier plots showing overall survival in breast, gastric, ovarian and lung cancer.
Over-expression of CACNA1A in ovarian and lung cancer would cause poor prognosis,
whereas in breast and gastric it would lead to good prognosis. Breast cancer, p = 1.4X 10
–
7;
gastric cancer, p = 0.038; ovarian cancer, p = 0.001; lung cancer, p = 2.4 X10⁻⁵.
(TIF)
S3 Fig. CACNA1A gene analysis in breast, gastric, ovarian and lung cancer (ONCOMINE
database).
Box plots derived from gene expression data in ONCOMINE comparing expression
of the CACNA1A gene in normal (left plot) and various types of cancer tissue (right plot).
(TIF)
S1 Table. PRISMA 2009 Checklist.
(DOCX)
S2 Table. ONCOMINE dataset reference list.
(DOCX)
Acknowledgments
Computational analyses and data mining were performed using the system provided by the
Bioinformatics Core at the National Cheng Kung University, supported by the National
Sci-ence Council, Taiwan. We also thank National SciSci-ence Council (NSC) of the Executive Yuan,
Taiwan [NSC 101-2320-B-034
–
001] for the grant. We also thank Ministry of Science and
Technology for the grant MOST103-2325-B006-012 and 104-2917-I-006-002. The funders had
no role in study design, data collection and analysis, decision to publish, or preparation of the
manuscript. We also would like to show our gratitude to those who have made their documents
publicly available and to the providers of data to ONCOMINE.
Author Contributions
Conceived and designed the experiments: CYW MDL YCL. Performed the experiments: CYW
YCL ZS. Analyzed the data: CYW ZS. Contributed reagents/materials/analysis tools: MDL
NNP. Wrote the paper: CYW NNP MDL.
References
1. Prevarskaya N, Skryma R, Shuba Y. Ion channels and the hallmarks of cancer. Trends in molecular medicine. 2010; 16(3):107–21. doi:10.1016/j.molmed.2010.01.005PMID:20167536
2. Lipskaia L, Lompré AM. Alteration in temporal kinetics of Ca2+ signaling and control of growth and proliferation. Biology of the Cell. 2004; 96(1):55–68. PMID:15093128
3. Schreiber R. Ca2+ signaling, intracellular pH and cell volume in cell proliferation. The Journal of mem-brane biology. 2005; 205(3):129–37. PMID:16362501
4. Panner A, Wurster RD. T-type calcium channels and tumor proliferation. Cell calcium. 2006; 40 (2):253–9. PMID:16765439
5. Pomeroy SL, Tamayo P, Gaasenbeek M, Sturla LM, Angelo M, McLaughlin ME, et al. Prediction of central nervous system embryonal tumour outcome based on gene expression. Nature. 2002; 415 (6870):436–42. PMID:11807556
6. Stegmaier K, Ross KN, Colavito SA, O'Malley S, Stockwell BR, Golub TR. Gene expression–based high-throughput screening (GE-HTS) and application to leukemia differentiation. Nature genetics. 2004; 36(3):257–63. PMID:14770183
8. Storz MN, van de Rijn M, Kim YH, Mraz-Gernhard S, Hoppe RT, Kohler S. Gene expression profiles of cutaneous B cell lymphoma. J Invest Dermatol. 2003; 120(5):865–70. doi:10.1046/j.1523-1747. 2003.12142.xPMID:WOS:000182456200027.
9. Bonome T, Levine DA, Shih J, Randonovich M, Pise-Masison CA, Bogomolniy F, et al. A gene signa-ture predicting for survival in suboptimally debulked patients with ovarian cancer. Cancer research. 2008; 68(13):5478–86. doi:10.1158/0008-5472.CAN-07-6595PMID:18593951
10. Barretina J, Taylor BS, Banerji S, Ramos AH, Lagos-Quintana M, DeCarolis PL, et al. Subtype-spe-cific genomic alterations define new targets for soft-tissue sarcoma therapy. Nature genetics. 2010; 42(8):715–21. doi:10.1038/ng.619PMID:20601955
11. Skotheim RI, Lind GE, Monni O, Nesland JM, Abeler VM, FossåSD, et al. Differentiation of human embryonal carcinomas in vitro and in vivo reveals expression profiles relevant to normal development. Cancer research. 2005; 65(13):5588–98. PMID:15994931
12. Cutcliffe C, Kersey D, Huang C-C, Zeng Y, Walterhouse D, Perlman EJ. Clear cell sarcoma of the kid-ney: up-regulation of neural markers with activation of the sonic hedgehog and Akt pathways. Clinical cancer research. 2005; 11(22):7986–94. PMID:16299227
13. Finak G, Bertos N, Pepin F, Sadekova S, Souleimanova M, Zhao H, et al. Stromal gene expression predicts clinical outcome in breast cancer. Nature medicine. 2008; 14(5):518–27. doi:10.1038/ nm1764PMID:18438415
14. Crabtree JS, Jelinsky SA, Harris HA, Choe SE, Cotreau MM, Kimberland ML, et al. Comparison of human and rat uterine leiomyomata: identification of a dysregulated mammalian target of rapamycin pathway. Cancer research. 2009; 69(15):6171–8. doi:10.1158/0008-5472.CAN-08-4471PMID:
19622772
15. Hao Y, Triadafilopoulos G, Sahbaie P, Young HS, Omary MB, Lowe AW. Gene expression profiling reveals stromal genes expressed in common between Barrett’s esophagus and adenocarcinoma. Gastroenterology. 2006; 131(3):925–33. PMID:16952561
16. Szatkowski C, Parys JB, Ouadid-Ahidouch H, Matifat F. Inositol 1,4,5-trisphosphate-induced Ca(2+) signalling is involved in estradiol-induced breast cancer epithelial cell growth. Molecular Cancer. 2010; 9:156. doi:10.1186/1476-4598-9-156PMC2906470. PMID:20565939
17. Mariot P, Prevarskaya N, Roudbaraki MM, Le Bourhis X, Van Coppenolle F, Vanoverberghe K, et al. Evidence of functional ryanodine receptor involved in apoptosis of prostate cancer (LNCaP) cells. The Prostate. 2000; 43(3):205–14. PMID:10797495
18. Catterall WA, Perez-Reyes E, Snutch TP, Striessnig J. International Union of Pharmacology. XLVIII. Nomenclature and structure-function relationships of voltage-gated calcium channels. Pharmacologi-cal reviews. 2005; 57(4):411–25. PMID:16382099
19. Catterall WA, Striessnig J, Snutch TP, Perez-Reyes E. International Union of Pharmacology. XL. Compendium of voltage-gated ion channels: calcium channels. Pharmacological Reviews. 2003; 55 (4):579–81. PMID:14657414
20. Tang S, Yatan A, Bahinski A, Mori Y, Schwartz A. Molecular localization of regions in the L-type cal-cium channel critical for dihydropyridine action. Neuron. 1993; 11(6):1013–21. PMID:8274273
21. Bers DM. Cardiac excitation–contraction coupling. Nature. 2002; 415(6868):198–205. PMID:
11805843
22. Tanabe T, Beam KG, Adams BA, Niidome T, Numa S. Regions of the skeletal muscle dihydropyridine receptor critical for excitation–contraction coupling. Nature. 1990; 346(6284):567–9. PMID:2165570
23. Gomez A, Valdivia H, Cheng H, Lederer MR, Santana L, Cannell M, et al. Defective excitation-con-traction coupling in experimental cardiac hypertrophy and heart failure. Science. 1997; 276 (5313):800–6. PMID:9115206
24. Olivera BM, Miljanich G, Ramachandran J, Adams ME. Calcium channel diversity and neurotransmit-ter release: theω-conotoxins andω-agatoxins. Annual review of biochemistry. 1994; 63(1):823–67. 25. Uchitel O, Protti D, Sanchez V, Cherksey B, Sugimori M, Llinas R. P-type voltage-dependent calcium
channel mediates presynaptic calcium influx and transmitter release in mammalian synapses. Pro-ceedings of the National Academy of Sciences. 1992; 89(8):3330–3.
26. Ayata C, Shimizu-Sasamata M, Lo E, Noebels J, Moskowitz M. Impaired neurotransmitter release and elevated threshold for cortical spreading depression in mice with mutations in theα1A subunit of P/Q type calcium channels. Neuroscience. 1999; 95(3):639–45.
27. Codignola A, Tarroni P, Clementi F, Pollo A, LoVallo M, Carbone E, et al. Calcium channel subtypes controlling serotonin release from human small cell lung carcinoma cell lines. Journal of Biological Chemistry. 1993; 268(35):26240–7. PMID:8253745
29. Catterall WA. Structure and function of neuronal Ca2+ channels and their role in neurotransmitter release. Cell Calcium. 1998; 24(5–6):307–23. doi:http://dx.doi.org/10.1016/S0143-4160(98)90055-0. PMID:10091001
30. Boland LM, Bean BP. Modulation of N-type calcium channels in bullfrog sympathetic neurons by luteinizing hormone-releasing hormone: kinetics and voltage dependence. The Journal of neurosci-ence. 1993; 13(2):516–33. PMID:7678856
31. Westenbroek RE, Hell JW, Warner C, Dubel SJ, Snutch TP, Catterall WA. Biochemical properties and subcellular distribution of an N-type calcium hannelα1 subunit. Neuron. 1992; 9(6):1099–115. PMID:
1334419
32. Mackie K, Hille B. Cannabinoids inhibit N-type calcium channels in neuroblastoma-glioma cells. Pro-ceedings of the National Academy of Sciences. 1992; 89(9):3825–9.
33. Diverse-Pierluissi M, Goldsmith PK, Dunlap K. Transmitter-mediated inhibition of N-type calcium channels in sensory neurons involves multiple GTP-binding proteins and subunits. Neuron. 1995; 14 (1):191–200. PMID:7826637
34. Markram H, Helm PJ, Sakmann B. Dendritic calcium transients evoked by single back-propagating action potentials in rat neocortical pyramidal neurons. The Journal of physiology. 1995; 485(Pt 1):1–
20.
35. Yasuda R, Sabatini BL, Svoboda K. Plasticity of calcium channels in dendritic spines. Nature neuro-science. 2003; 6(9):948–55. PMID:12937422
36. Johnston D, Magee JC, Colbert CM, Christie BR. Active properties of neuronal dendrites. Annual review of neuroscience. 1996; 19(1):165–86.
37. Carlin K, Jones K, Jiang Z, Jordan L, Brownstone R. Dendritic L‐type calcium currents in mouse spinal motoneurons: implications for bistability. European Journal of Neuroscience. 2000; 12(5):1635–46. PMID:10792441
38. Perez-Reyes E. Molecular physiology of low-voltage-activated t-type calcium channels. Physiological Reviews. 2003; 83(1):117–61. PMID:12506128
39. Bohn G, Moosmang S, Conrad H, Ludwig A, Hofmann F, Klugbauer N. Expression of T-and L-type calcium channel mRNA in murine sinoatrial node. FEBS letters. 2000; 481(1):73–6. PMID:10984618
40. Cribbs LL, Lee J-H, Yang J, Satin J, Zhang Y, Daud A, et al. Cloning and characterization ofα1H from human heart, a member of the T-type Ca2+ channel gene family. Circulation Research. 1998; 83 (1):103–9. PMID:9670923
41. Ertel EA, Campbell KP, Harpold MM, Hofmann F, Mori Y, Perez-Reyes E, et al. Nomenclature of volt-age-gated calcium channels. Neuron. 2000; 25(3):533–5. PMID:10774722
42. Huguenard J, Prince D. A novel T-type current underlies prolonged Ca (2+)-dependent burst firing in GABAergic neurons of rat thalamic reticular nucleus. The Journal of neuroscience. 1992; 12 (10):3804–17. PMID:1403085
43. Kito M, Maehara M, Watanabe K. Mechanisms of T-type calcium channel blockade by zonisamide. Seizure. 1996; 5(2):115–9. PMID:8795126
44. Hoheisel JD. Microarray technology: beyond transcript profiling and genotype analysis. Nature reviews genetics. 2006; 7(3):200–10. PMID:16485019
45. Rhodes DR, Kalyana-Sundaram S, Mahavisno V, Varambally R, Yu J, Briggs BB, et al. Oncomine 3.0: genes, pathways, and networks in a collection of 18,000 cancer gene expression profiles. Neo-plasia. 2007; 9(2):166–80. PMID:17356713
46. Rhodes DR, Yu J, Shanker K, Deshpande N, Varambally R, Ghosh D, et al. ONCOMINE: A Cancer Microarray Database and Integrated Data-Mining Platform. Neoplasia. 2004; 6(1):1–6. doi:http://dx. doi.org/10.1016/S1476-5586(04)80047-2. PMID:15068665
47. Ewald JA, Downs TM, Cetnar JP, Ricke WA. Expression microarray meta-analysis identifies genes associated with Ras/MAPK and related pathways in progression of muscle-invasive bladder transition cell carcinoma. PloS one. 2013; 8(2):e55414. doi:10.1371/journal.pone.0055414PMID:23383328
48. Moher D, Liberati A, Tetzlaff J, Altman DG. Preferred reporting items for systematic reviews and meta-analyses: the PRISMA statement. Annals of internal medicine. 2009; 151(4):264–9. PMID:19622511
49. Ni M, Chen Y, Lim E, Wimberly H, Bailey ST, Imai Y, et al. Targeting androgen receptor in estrogen receptor-negative breast cancer. Cancer cell. 2011; 20(1):119–31. doi:10.1016/j.ccr.2011.05.026
PMID:21741601
51. Gyorffy B, Lanczky A, Szallasi Z. Implementing an online tool for genome-wide validation of survival-associated biomarkers in ovarian-cancer using microarray data from 1287 patients. Endocr-Relat Cancer. 2012; 19(2):197–208. doi:10.1530/Erc-11-0329PMID:WOS:000303539700011.
52. Gyorffy B, Benke Z, Lanczky A, Balazs B, Szallasi Z, Timar J, et al. RecurrenceOnline: an online anal-ysis tool to determine breast cancer recurrence and hormone receptor status using microarray data. Breast Cancer Res Tr. 2012; 132(3):1025–34. doi:10.1007/s10549-011-1676-yPMID:
WOS:000303379800025.
53. Gyorffy B, Surowiak P, Budczies J, Lanczky A. Online Survival Analysis Software to Assess the Prog-nostic Value of Biomarkers Using Transcriptomic Data in Non-Small-Cell Lung Cancer. Plos One. 2013; 8(12). doi: UNSP e82241 doi:10.1371/journal.pone.0082241PMID:WOS:000328740300023. 54. Berridge MJ. Calcium signalling and cell proliferation. Bioessays. 1995; 17(6):491–500. PMID:
7575490
55. Dziegielewska B, Brautigan DL, Larner JM, Dziegielewski J. T-Type Ca2+ Channel Inhibition Induces p53-Dependent Cell Growth Arrest and Apoptosis through Activation of p38-MAPK in Colon Cancer Cells. Molecular Cancer Research. 2014; 12(3):348–58. doi:10.1158/1541-7786.MCR-13-0485
PMID:24362252
56. Lee JY, Park SJ, Park SJ, Lee MJ, Rhim H, Seo SH, et al. Growth inhibition of human cancer cells in vitro by T-type calcium channel blockers. Bioorganic & medicinal chemistry letters. 2006; 16 (19):5014–7.
57. Triggle DJ. Calcium channel antagonists: clinical uses—past, present and future. Biochemical phar-macology. 2007; 74(1):1–9. PMID:17276408
58. Dziegielewska B, Gray LS, Dziegielewski J. T-type calcium channels blockers as new tools in cancer therapies. Pflügers Archiv-European Journal of Physiology. 2014; 466(4):801–10. doi:10.1007/ s00424-014-1444-zPMID:24449277
59. Taylor JT, Zeng X-B, Pottle JE, Lee K, Wang AR, Yi SG, et al. Calcium signaling and T-type calcium channels in cancer cell cycling. World journal of gastroenterology: WJG. 2008; 14(32):4984. PMID:
18763278
60. Lee KS, Tsien RW. Mechanism of calcium channel blockade by verapamil, D600, diltiazem and nitrendipine in single dialysed heart cells. Nature. 1983; 302(5911):790–4. PMID:6302512
61. Weiss J, Hartley D, Koh J-Y, Choi D. The calcium channel blocker nifedipine attenuates slow excit-atory amino acid neurotoxicity. Science(Washington). 1990; 247(4949):1474–7.
62. Haverstick DM, Heady TN, Macdonald TL, Gray LS. Inhibition of human prostate cancer proliferation in vitro and in a mouse model by a compound synthesized to block Ca2+ entry. Cancer research. 2000; 60(4):1002–8. PMID:10706116
63. Enfissi A, Prigent S, Colosetti P, Capiod T. The blocking of capacitative calcium entry by 2-aminoethyl diphenylborate (2-APB) and carboxyamidotriazole (CAI) inhibits proliferation in Hep G2 and Huh-7 human hepatoma cells. Cell calcium. 2004; 36(6):459–67. PMID:15488595
64. Chung SC, McDonald TV, Gardner P. Inhibition by SK&F 96365 of Ca2+ current, IL‐2 production and activation in T lymphocytes. British journal of pharmacology. 1994; 113(3):861–8. PMID:7858878
65. Azimi I, Roberts‐Thomson S, Monteith G. Calcium influx pathways in breast cancer: opportunities for pharmacological intervention. British journal of pharmacology. 2014; 171(4):945–60. doi:10.1111/ bph.12486PMID:24460676
66. Loughlin KR. Calcium channel blockers and prostate cancer. Urologic Oncology: Seminars and Origi-nal Investigations. 2014; 32(5):537–8. doi:http://dx.doi.org/10.1016/j.urolonc.2013.08.001. doi:10. 1016/j.urolonc.2013.08.001PMID:24814406
67. Zhuang L, Peng J-B, Tou L, Takanaga H, Adam RM, Hediger MA, et al. Calcium-selective ion chan-nel, CaT1, is apically localized in gastrointestinal tract epithelia and is aberrantly expressed in human malignancies. Laboratory investigation. 2002; 82(12):1755–64. PMID:12480925
68. Hall DD, Wu Y, Domann FE, Spitz DR, Anderson ME. Mitochondrial Calcium Uniporter Activity Is Dis-pensable for MDA-MB-231 Breast Carcinoma Cell Survival. PloS one. 2014; 9(5):e96866.
69. Cain SM, Snutch TP. Voltage‐gated calcium channels and disease. Biofactors. 2011; 37(3):197–205. doi:10.1002/biof.158PMID:21698699
70. Bidaud I, Mezghrani A, Swayne LA, Monteil A, Lory P. Voltage-gated calcium channels in genetic dis-eases. Biochimica et Biophysica Acta (BBA)-Molecular Cell Research. 2006; 1763(11):1169–74. 71. Kamp TJ, Hell JW. Regulation of cardiac L-type calcium channels by protein kinase A and protein
kinase C. Circulation research. 2000; 87(12):1095–102. PMID:11110765
72. Moosmang S, Schulla V, Welling A, Feil R, Feil S, Wegener JW, et al. Dominant role of smooth muscle L‐type calcium channel Cav1. 2 for blood pressure regulation. The EMBO Journal. 2003; 22
73. Skrzypczak M, Goryca K, Rubel T, Paziewska A, Mikula M, Jarosz D, et al. Modeling oncogenic sig-naling in colon tumors by multidirectional analyses of microarray data directed for maximization of analytical reliability. PLoS One. 2010; 5(10):e13091. doi:10.1371/journal.pone.0013091PMID:
20957034
74. Sabates-Bellver J, Van der Flier LG, de Palo M, Cattaneo E, Maake C, Rehrauer H, et al. Transcrip-tome profile of human colorectal adenomas. Molecular cancer research: MCR. 2007; 5(12):1263–75. doi:10.1158/1541-7786.MCR-07-0267PMID:18171984.
75. Cho JY, Lim JY, Cheong JH, Park YY, Yoon SL, Kim SM, et al. Gene expression signature-based prognostic risk score in gastric cancer. Clinical cancer research: an official journal of the American Association for Cancer Research. 2011; 17(7):1850–7. doi:10.1158/1078-0432.CCR-10-2180PMID:
21447720; PubMed Central PMCID: PMC3078023.
76. D'Errico M, de Rinaldis E, Blasi MF, Viti V, Falchetti M, Calcagnile A, et al. Genome-wide expression profile of sporadic gastric cancers with microsatellite instability. European journal of cancer. 2009; 45 (3):461–9. doi: doi:10.1016/j.ejca.2008.10.032PMID:19081245.
77. Logsdon CD, Simeone DM, Binkley C, Arumugam T, Greenson JK, Giordano TJ, et al. Molecular pro-filing of pancreatic adenocarcinoma and chronic pancreatitis identifies multiple genes differentially regulated in pancreatic cancer. Cancer Res. 2003; 63(10):2649–57. PMID:12750293.
78. Detwiller KY, Fernando NT, Segal NH, Ryeom SW, D'Amore PA, Yoon SS. Analysis of hypoxia-related gene expression in sarcomas and effect of hypoxia on RNA interference of vascular endothe-lial cell growth factor A. Cancer Res. 2005; 65(13):5881–9. doi:10.1158/0008-5472.CAN-04-4078
PMID:15994966.
79. Coustan-Smith E, Song G, Clark C, Key L, Liu P, Mehrpooya M, et al. New markers for minimal resid-ual disease detection in acute lymphoblastic leukemia. Blood. 2011; 117(23):6267–76. doi:10.1182/ blood-2010-12-324004PMID:21487112; PubMed Central PMCID: PMC3122946.
80. Lee J, Kotliarova S, Kotliarov Y, Li A, Su Q, Donin NM, et al. Tumor stem cells derived from glioblasto-mas cultured in bFGF and EGF more closely mirror the phenotype and genotype of primary tumors than do serum-cultured cell lines. Cancer Cell. 2006; 9(5):391–403. doi:10.1016/j.ccr.2006.03.030
PMID:16697959.
81. Bredel M, Bredel C, Juric D, Harsh GR, Vogel H, Recht LD, et al. Functional network analysis reveals extended gliomagenesis pathway maps and three novel MYC-interacting genes in human gliomas. Cancer Res. 2005; 65(19):8679–89. doi:10.1158/0008-5472.CAN-05-1204PMID:16204036. 82. Curtis C, Shah SP, Chin SF, Turashvili G, Rueda OM, Dunning MJ, et al. The genomic and
transcrip-tomic architecture of 2,000 breast tumours reveals novel subgroups. Nature. 2012; 486(7403):346–
52. doi:10.1038/nature10983PMID:22522925; PubMed Central PMCID: PMC3440846.
83. Turashvili G, Bouchal J, Baumforth K, Wei W, Dziechciarkova M, Ehrmann J, et al. Novel markers for differentiation of lobular and ductal invasive breast carcinomas by laser microdissection and microar-ray analysis. BMC Cancer. 2007; 7:55. doi:10.1186/1471-2407-7-55PMID:17389037; PubMed Cen-tral PMCID: PMC1852112.
84. Quade BJ, Wang TY, Sornberger K, Dal Cin P, Mutter GL, Morton CC. Molecular pathogenesis of uterine smooth muscle tumors from transcriptional profiling. Genes, chromosomes & cancer. 2004; 40 (2):97–108. doi:10.1002/gcc.20018PMID:15101043.
85. Nindl I, Dang C, Forschner T, Kuban RJ, Meyer T, Sterry W, et al. Identification of differentially expressed genes in cutaneous squamous cell carcinoma by microarray expression profiling. Mol Can-cer. 2006; 5:30. doi:10.1186/1476-4598-5-30PMID:16893473; PubMed Central PMCID:
PMC1569867.
86. LaTulippe E, Satagopan J, Smith A, Scher H, Scardino P, Reuter V, et al. Comprehensive gene expression analysis of prostate cancer reveals distinct transcriptional programs associated with meta-static disease. Cancer Res. 2002; 62(15):4499–506. PMID:12154061.
87. Lapointe J, Li C, Higgins JP, van de Rijn M, Bair E, Montgomery K, et al. Gene expression profiling identifies clinically relevant subtypes of prostate cancer. Proc Natl Acad Sci U S A. 2004; 101(3):811–
6. doi:10.1073/pnas.0304146101PMID:14711987; PubMed Central PMCID: PMC321763. 88. Taylor BS, Schultz N, Hieronymus H, Gopalan A, Xiao Y, Carver BS, et al. Integrative genomic
profil-ing of human prostate cancer. Cancer Cell. 2010; 18(1):11–22. doi:10.1016/j.ccr.2010.05.026PMID:
20579941; PubMed Central PMCID: PMC3198787.
89. Tomlins SA, Mehra R, Rhodes DR, Cao X, Wang L, Dhanasekaran SM, et al. Integrative molecular concept modeling of prostate cancer progression. Nat Genet. 2007; 39(1):41–51. doi: doi:10.1038/ ng1935PMID:17173048.
91. Liu P, Ramachandran S, Ali Seyed M, Scharer CD, Laycock N, Dalton WB, et al. Sex-determining region Y box 4 is a transforming oncogene in human prostate cancer cells. Cancer Res. 2006; 66 (8):4011–9. doi:10.1158/0008-5472.CAN-05-3055PMID:16618720.
92. Arredouani MS, Lu B, Bhasin M, Eljanne M, Yue W, Mosquera JM, et al. Identification of the transcrip-tion factor single-minded homologue 2 as a potential biomarker and immunotherapy target in prostate cancer. Clinical cancer research: an official journal of the American Association for Cancer Research. 2009; 15(18):5794–802. doi:10.1158/1078-0432.CCR-09-0911PMID:19737960.
93. Wallace TA, Prueitt RL, Yi M, Howe TM, Gillespie JW, Yfantis HG, et al. Tumor immunobiological dif-ferences in prostate cancer between African-American and European-American men. Cancer Res. 2008; 68(3):927–36. doi:10.1158/0008-5472.CAN-07-2608PMID:18245496.
94. Luo JH, Yu YP, Cieply K, Lin F, Deflavia P, Dhir R, et al. Gene expression analysis of prostate can-cers. Mol Carcinogen. 2002; 33(1):25–35. doi:10.1002/Mc.10018PMID:WOS:000173276900004. 95. Magee JA, Araki T, Patil S, Ehrig T, True L, Humphrey PA, et al. Expression profiling reveals hepsin
overexpression in prostate cancer. Cancer Research. 2001; 61(15):5692–6. PMID:
WOS:000170194700003.
96. Radvanyi L, Singh-Sandhu D, Gallichan S, Lovitt C, Pedyczak A, Mallo G, et al. The gene associated with trichorhinophalangeal syndrome in humans is overexpressed in breast cancer. Proceedings of the National Academy of Sciences of the United States of America. 2005; 102(31):11005–10. doi:10. 1073/pnas.0500904102PMID:WOS:000231102400050.
97. Dyrskjot L, Kruhoffer M, Thykjaer T, Marcussen N, Jensen JL, Moller K, et al. Gene expression in the urinary bladder: a common carcinoma in situ gene expression signature exists disregarding histopath-ological classification. Cancer Res. 2004; 64(11):4040–8. doi:10.1158/0008-5472.CAN-03-3620
PMID:15173019.
98. Cui JA, Chen YB, Chou WC, Sun LK, Chen L, Suo JA, et al. An integrated transcriptomic and compu-tational analysis for biomarker identification in gastric cancer. Nucleic Acids Res. 2011; 39(4):1197–
207. doi:10.1093/Nar/Gkq960PMID:WOS:000288019400010.
99. Bhattacharjee A, Richards WG, Staunton J, Li C, Monti S, Vasa P, et al. Classification of human lung carcinomas by mRNA expression profiling reveals distinct adenocarcinoma subclasses. Proc Natl Acad Sci U S A. 2001; 98(24):13790–5. doi:10.1073/pnas.191502998PMID:11707567; PubMed Central PMCID: PMC61120.
100. Bhat S, Dao DT, Terrillion CE, Arad M, Smith RJ, Soldatov NM, et al. CACNA1C (Ca(v)1.2) in the pathophysiology of psychiatric disease. Prog Neurobiol. 2012; 99(1):1–14. doi:10.1016/j.pneurobio. 2012.06.001PMID:WOS:000310171800001.
101. Chambers KF, Pearson JF, Pellacani D, Aziz N, GužvićM, Klein CA, et al. Stromal upregulation of lat-eral epithelial adhesions: Gene expression analysis of signalling pathways in prostate epithelium. Journal of biomedical science. 2011; 18(1):1–13.
102. Szatkowski C, Parys JB, Ouadid-Ahidouch H, Matifat F. Inositol 1, 4, 5-trisphosphate-induced Ca2+ signalling is involved in estradiol-induced breast cancer epithelial cell growth. Molecular Cancer. 2010; 9(1):156.
103. Pesch K, Zeitz C, Fries JE, Münscher S, Pusch CM, Kohler K, et al. Isolation of the mouse nyctalopin gene nyx and expression studies in mouse and rat retina. Investigative ophthalmology & visual sci-ence. 2003; 44(5):2260–6.
104. Llinas R, Sugimori M, Lin J, Cherksey B. Blocking and isolation of a calcium channel from neurons in mammals and cephalopods utilizing a toxin fraction (FTX) from funnel-web spider poison. Proceed-ings of the National Academy of Sciences. 1989; 86(5):1689–93.
105. Randall A, Tsien RW. Pharmacological dissection of multiple types of Ca2+ channel currents in rat cerebellar granule neurons. The Journal of neuroscience. 1995; 15(4):2995–3012. PMID:7722641
106. Bourinet E, Soong TW, Sutton K, Slaymaker S, Mathews E, Monteil A, et al. Splicing ofα1A subunit gene generates phenotypic variants of P-and Q-type calcium channels. Nature neuroscience. 1999; 2 (5):407–15. PMID:10321243
107. Chaudhuri D, Chang S-Y, DeMaria CD, Alvania RS, Soong TW, Yue DT. Alternative splicing as a molecular switch for Ca2+/calmodulin-dependent facilitation of P/Q-type Ca2+ channels. The Journal of neuroscience. 2004; 24(28):6334–42. PMID:15254089
108. Gazulla J, Tintore M. P/Q-type voltage-dependent calcium channels in neurological disease. Neurolo-gia. 2007; 22(8):511–6. PMID:WOS:000251211500004.