Introduction of Soft X-Ray
Spectromicroscopy as an Advanced
Technique for Plant Biopolymers Research
Chithra Karunakaran1*, Colleen R. Christensen2, Cedric Gaillard3, Rachid Lahlali1, Lisa M. Blair1,4, Vijayan Perumal1, Shea S. Miller5, Adam P. Hitchcock6
1Canadian Light Source Inc., 44 Innovation Boulevard, Saskatoon, Saskatchewan, Canada,2Industrial Research Assistance Program—National Research Council Canada, 110 Gymnasium Place, Saskatoon, Saskatchewan, Canada,3INRA—Biopolymers, Interactions, Assemblies Unit (BIA), Nantes, France,
4Canadian Food Inspection Agency, 116 Veterinary Road, Saskatoon, Saskatchewan, Canada,
5Agriculture and Agri-Food Canada,Eastern CerealandOilseed Research Centre,Ottawa,Ontario, Canada,6Brockhouse Institute for Materials Research, McMaster University, 1280 Main Street West, Hamilton, Ontario, Canada
Abstract
Soft X-ray absorption spectroscopy coupled with nano-scale microscopy has been widely used in material science, environmental science, and physical sciences. In this work, the advantages of soft X-ray absorption spectromicroscopy for plant biopolymer research were demonstrated by determining the chemical sensitivity of the technique to identify common plant biopolymers and to map the distributions of biopolymers in plant samples. The chemi-cal sensitivity of soft X-ray spectroscopy to study biopolymers was determined by recording the spectra of common plant biopolymers using soft X-ray and Fourier Transform mid Infra-red (FT-IR) spectroscopy techniques. The soft X-ray spectra of lignin, cellulose, and polyga-lacturonic acid have distinct spectral features. However, there were no distinct differences between cellulose and hemicellulose spectra. Mid infrared spectra of all biopolymers were unique and there were differences between the spectra of water soluble and insoluble xy-lans. The advantage of nano-scale spatial resolution exploited using soft X-ray spectromi-croscopy for plant biopolymer research was demonstrated by mapping plant cell wall biopolymers in a lentil stem section and compared with the FT-IR spectromicroscopy data from the same sample. The soft X-ray spectromicroscopy enables mapping of biopolymers at the sub-cellular (~30 nm) resolution whereas, the limited spatial resolution in the micron scale range in the FT-IR spectromicroscopy made it difficult to identify the localized distribu-tion of biopolymers. The advantages and limitadistribu-tions of soft X-ray and FT-IR spectromicro-scopy techniques for biopolymer research are also discussed.
a11111
OPEN ACCESS
Citation:Karunakaran C, Christensen CR, Gaillard C, Lahlali R, Blair LM, Perumal V, et al. (2015) Introduction of Soft X-Ray Spectromicroscopy as an Advanced Technique for Plant Biopolymers Research. PLoS ONE 10(3): e0122959. doi:10.1371/ journal.pone.0122959
Academic Editor:Yuriy Dedkov, SPECS Surface Nano Analysis GmbH, GERMANY
Received:October 27, 2014
Accepted:February 16, 2015
Published:March 26, 2015
Copyright:© 2015 Karunakaran et al. This is an open access article distributed under the terms of the
Creative Commons Attribution License, which permits unrestricted use, distribution, and reproduction in any medium, provided the original author and source are credited.
Data Availability Statement:All relevant data are within the paper.
Introduction
A good understanding of the structural organization, chemical composition, and correlation between structure and composition of biopolymers in plants and plant products is essential to continually improve quality by plant breeding, to preserve quality through processing and stor-age, and to extend efficient utilization through new product development. Electron microscopy (EM), analytical chemistry, and histochemical methods are extensively used to characterize biopolymers in plant products [1–3]. These methods are limited by the lack of sensitivity and information loss on the spatial localization and distribution of chemical components. Fixation and staining protocols used in EM and histochemical analyses affect chemical characterization and quantitative information. Chemical extraction methods may alter the original compound and produce derivatives that interfere with the analysis [4]. Vibrational (Raman and infrared) and ultraviolet spectromicroscopy techniques have long been used as non-destructive methods for in-situ physicochemical characterization of biopolymers [5,6]. Characterization of seeds (lentils, pea, wheat, corn, oats, rye, onion), fibres (flax, hemp), grass (rye grass), and plant resi-dues (wheat straw, poplar wood) by either laboratory- or synchrotron-based Fourier Trans-form mid Infrared (FT-IR), Raman, and ultraviolet spectromicroscopy methods have been reported [1,3,6–18]. Although lots of work have been reported on biopolymer characterization, an in-depth understanding on the localization of biopolymers, their interactions and contribu-tion to diverse funccontribu-tions is necessary.
The wavelength of light provides a limit to the spatial resolution and chemical information obtained from a sample. The wavelength of IR light is in the micrometer range (4000 cm-1–200 cm-1, or 2.5μm–50μm) and limits the spatial resolution to much less than that obtained using
a visible light microscope (300–500 nm). Soft X-rays on the other hand have shorter wave-lengths in the nanometre range (100 eV–2500 eV, or 12 nm–0.5 nm). Therefore, soft X-rays have the potential to provide much high spatial resolution and thus can characterize samples at the sub-cellular (nanometer scale) level. In this study, soft X-ray spectromicroscopy using Scanning Transmission X-ray Microscope (STXM) is shown to be a powerful technique that can be used to characterize plant samples at a high spatial resolution and similar chemical sen-sitivity compared to mid infrared spectromicroscopy. Recent advancement in the fabrication of zone plates which focus the X-ray beam has made it possible to achieve a spatial resolution of up to ~ 10 nm using STXM [19].
Soft X-ray spectromicroscopy is a synchrotron based technique for elemental identification, elemental speciation, and spatial mapping of heterogeneous materials [20]. When monochro-matic X-ray beam is incident on a sample, it is absorbed and excites core electrons from a spe-cific atom in a molecule to unoccupied molecular orbitals giving rise to near edge X-ray absorption spectra (XAS) around the elemental absorption edges [21]. The XAS structures are closely related to chemical bonding and can be used to determine and quantify the presence of elements or compounds, similar to mid infrared (IR) spectroscopy [22–25]. Using STXM, XAS of samples can be collected at each spot on thin sections of samples by raster scanning the sam-ples. The STXM has been extensively used for characterization of polymer materials [26,27]; environmental samples [28–32]; and biomaterials for medical applications [33–35]. Only a very few work has been reported on the use of STXM for plant biopolymer research such as characterization of plant fossil and xylem lignification [28,36–39] and DNA distribution in bean chromosomes [40,41].
Physicochemical characterization of plant biopolymers at the cellular (micron scale) and sub-cellular level helps to develop desired products as well as to maximize the benefits. Some examples include: studying changes in cell composition and structure during seed development [42–44]; correlation between plant cell wall composition and its susceptibility to diseases or
Sciences Division of the U.S. Department of Energy, under Contract No. DE-AC03-76SF00098. The funders had no role in study design, data collection and analysis, decision to publish, or preparation of the manuscript.
final product quality [1,45–47]; determining stem or wood composition and using plant breed-ing programs to increase or reduce components like lignin [7,15]; characterization of fibres to optimize processing procedures and to improve the quality of biocomposites [13,48]; and un-derstanding of bio-wastes to maximize by-product development like extraction of cellulose and hemicellulose [11]. Therefore, the objectives of this study were to: 1) compare the sensitivity of soft X-ray absorption spectroscopy (XAS) with that of FT-IR spectroscopy in identification of common plant biopolymers; 2) determine the advantages of soft X-ray spectromicroscopy for biopolymer localization and distribution in plant samples; and 3) compare the relative merits of soft X-ray and FT-IR spectromicroscopy techniques for biopolymer research.
Materials and Methods
Biopolymer References
To achieve objective 1, spectra of the following biopolymer references were recorded using the soft X-ray XAS and FT-IR spectroscopy methods: Lignin (hydrolytic), cellulose, hemicelluloses (xylan from oat spelts; hot water insoluble xylan; hot water soluble xylan; wheat arabinoxylan), pectin (from orange, polygalacturonic acid-PGA) andβ-glucan (from oats). The reference compounds were purchased either from Sigma-Aldrich Canada Ltd or Megazyme Internation-al Ireland Ltd.
Lentil Stem Section
For objective 2, the localization and distribution of biopolymers were mapped at the cellular (FT-IR) and sub-cellular level (soft X-ray) on lentil stem sections. Stem sections (from the 3rd or 4thnodes) excised from lentil plant (Lens culinaris;variety VIR 421) were used to prepare the samples.
Samples for Soft X-ray Spectromicroscopy
The soft X-ray absorption spectra of biopolymer references were collected using STXM in the transmission mode. In STXM, for ideal transmission through the sample (about 30–60%), sam-ples have to be thin (for carbon XAS, samsam-ples have to ~90–200 nm thick if the density of the material is about 1 g/cm3) so that soft X-rays can penetrate the sample. Therefore, each refer-ence compound was either suspended or dissolved in water and about ~ 2μl droplet was
de-posited on the flat side of a Silicon Nitride (Si3Ni4) window (1 mm x 1 mm pane, 75 nm thick,
Norcada Ltd) and allowed to dry in air.
For soft X-ray spectromicroscopy, lentil stem sections (~ 1–2 mm3) were dehydrated in a graded ethanol series from 25 to 100% in four steps of 20–30 min at each concentration. Dehy-drated sections were then embedded in an amine epoxy resin. The resin with the sample was polymerized at 60°C for 24 h or until the resin was completely polymerized. The embedded sections were cut at room temperature to a thickness of ~90 nm using an Ultramicrotome. The cut sections were then deposited on uncoated copper grids commonly used for transmission electron microscopy.
Samples for FT-IR Spectromicroscopy
region by measuring the changes in the thermal expansion of the gas surrounding the sample using a microphone.
For infrared spectromicroscopy in the transmission mode, lentil stem sections of about 1 cm long were frozen at -20°C for about 16 h. Cross sections of ~ 8μm thickness were cut using
the cyro-microtome (Leica CM3050 S—Cryostats, Leica Biosystems). The sections were depos-ited on 3 mm thick barium fluoride (BaF2) slides that are suitable for IR data collection in the
transmission mode.
Soft X-ray Spectromicroscopy Data Collection
The XAS data of the biopolymer references and lentil stem sections were recorded using the interferometrically controlled STXMs at the Canadian Light Source (CLS)—soft X-ray spectro-microscopy beamline (beamline 10ID-1) and Advanced Light Source (ALS)—Polymer STXM (beamline 5.3.2). Both the CLS and ALS beamlines are optimized for spectromicroscopy at the C, N, and O 1s edges suitable for biopolymers research and provide monochromatic soft X-ray beam in the energy range of 130–2700 eV and 250–700 eV, respectively. The monochromatic X-ray beam was focused to a spot size of ~40 nm by the 35 nm outer-zone diameter zone plate on the sample. The transmitted X-ray intensity through the sample was recorded by a detector (a thin phosphor coating converts X-rays to visible light and a single photon counting unit gives the intensity counts). The beamline slit sizes were selected so that the spectral resolving power was ~3000 at the C 1s and O 1s regions. A 200 nm thick Titanium (Ti) filter was used at the 10ID-1 beamline to reduce the contribution from higher order light in the incoming beam at the C 1s region and a gas cell filled with 7 Torr N2over a 1 m pathlength was used for second order
reduction at the ALS 5.3.2 beamline. The energy scale of both beamlines was checked by record-ing the gas spectra of CO2and all data sets were corrected for the correct energy scale [50].
After the sample was mounted into the microscope, the chamber was first evacuated to the lowest vacuum achievable (~ 100 m Torr). The microscopic chamber was then filled with dry helium (~1/3 of atmospheric pressure) to provide cooling for motors inside the microscope. The absorption spectra of the dried samples were recorded at the C 1s (280–320 eV) and O 1s (525–560 eV) regions. The samples were checked for radiation damage after recording the data, as radiation damage may alter the functional groups of biopolymers [38,51]. The intensity of the incoming beam recorded through the Si3Ni4window where there was no sample was
used to normalize the transmitted intensity through the sample.
In STXM, XAS data can be collected in three different modes: point spectra at a single loca-tion, line scan along a line in a sample, or a stack to record images over a sequence of photon energies. Spectra of the reference compounds were recorded using a defocused point scan (~800 ms dwell time per point or pixel), or a line scan (~8 to 10 ms dwell time per line) or a stack (an image sequence at 1 ms dwell time per pixel) at an energy step size of 0.07 eV around the C 1s absorption edge of different functional groups (284.5 to 293 eV). The lentil stem sec-tion was analyzed by recording an image sequence in the C 1s region (280 to 300 eV) around cell wall and cell wall junctions. A spatial sampling of 100 nm, energy resolution of 0.2 eV, an energy range from 284.2 to 292 eV, and a dwell time of 1 ms took about ~35 min to record a stack from a region of 14μm×16μm on the lentil stem section.
FT-IR Spectromicroscopy Data Collection
microscope equipped with a potassium bromide beam splitter, motorized mapping stage, and cryo-cooled mercury cadmium telluride detector for spectromicroscopy of thin samples. The microscope is configured to use synchrotron light as well as the built-in Globar source.
The FT-IR spectra of reference compounds were recorded using the PAS system using the Globar source. The reference compounds were placed in the sample cup and the sample cham-ber was purged with dry helium to remove water vapour and CO2. The spectrum for each
sam-ple was recorded by averaging 32 interferograms collected from wavelengths 4000 to 800 cm-1 at a resolution of 4 cm-1. The spectrum of carbon black powder (average of 4 trials with 32 scans per trial) was also recorded to normalize the sample spectrum.
Although infrared spectroscopy and microscopy are available based on Globar source, the synchrotron source have better spatial resolution (3–10μm) and signal-to-noise ratio
(100–1000 times) [52]. Therefore, the FT-IR spectromicroscopy data of lentil stem sections were recorded in the transmission mode using synchrotron light at a spectral resolution of 8 cm-1in the 4000–800 cm-1energy range. A visible light microscope equipped with a CCD camera connected to the FT-IR microscope was used to identify regions of interest. The sample chamber was purged with dry helium to minimize IR absorption by water vapour and CO2. A
spatial resolution of 5μm × 5μm was used for microscopy. A total of 128 scans were recorded
at each spot on the sample and the average of the scans was normalized using a background spectrum (average of 512 scans) obtained from an area where there was no sample. The total time for collecting data on an area of 225μm × 45μm was about 8 h.
Soft X-ray Data Analysis
All STXM data were analyzed using aXis2000 program (http://unicorn.mcmaster.ca/aXis2000. html). The method is described in detail elsewhere [25,53]. The XAS spectra of biopolymer refer-ences were first converted to optical densities (OD) using a spectrum recorded where there was no sample. The theoretical absorption or optical density of a 1 nm thick biopolymer reference was computed assuming appropriate elemental composition and density. For example, densities of 1.5 and 1.3 g/cm3were assumed for cellulose and lignin, respectively. The experimental bio-polymer reference spectra were then normalized to absorption by 1 nm of corresponding com-pound. A linear background was subtracted from each experimental reference spectrum to match the pre-edge and post-edge to the calculated theoretical absorption spectrum.
The stack data of lentil stem section after aligned and converted into OD was transformed into component maps. The images in the stack data were aligned using the cross correlation method using an image (287.1 eV) which had the highest contrast. The aligned stack was then converted into OD using a spectra extracted from an empty region within the stack. The nor-malized and background corrected experimental reference spectra of lignin and cellulose were used to determine the spatial and quantitative distribution of biopolymers in the lentil stem section. A singular value decomposition method (SVD) using the spectra of reference com-pounds was used to map and to determine the quantitative distribution of biopolymers [20,25,53].
Infrared Data Analysis
OPUS 4.2 (Bruker Optics Inc., Billerica, MA) software was used to record and analyze the PAS and FT-IR spectromicroscopy data. The PAS biopolymer reference spectra were first normal-ized using the carbon black spectra and then smoothed by an average filter (3 to 9 points). Ori-gin (version 7.5) was used for plotting all the spectral data.
spectromicroscopy data was then corrected using the rubber-band correction (64 points). The second derivative of the FT-IR absorbance spectrum from the biopolymer references was used to identify integration band ranges for lignin and cellulose. For example, lignin and cellulose distribution on the lentil stem section was determined by integrating the spectral ranges of 1524–1502 cm-1and 1442–1417 cm-1, respectively.
Results and Discussion
Spectroscopy of Biopolymer References
Soft X-ray Spectroscopy. For water insoluble compounds like lignin and cellulose, thin re-gions of prepared samples were chosen (using Leica refraction color chart from the optical mi-croscope images or using the optical density from the STXM images) to optimize transmission through the sample at the C 1s and O 1s absorption edges. The XAS spectra of biopolymers at the C 1s are shown inFig 1. The three prominent 1s!πtransition peaks of lignin at 285.2,
287.0, and 288.5 eV are representative of the C and H substituted aromatic carbon, O substitut-ed aromatic carbon, and carboxylic group [28]. The peaks at 285.2 and 287.0 eV are unique to lignin and thus lignin can be easily differentiated from other biopolymers. The differences in peak intensities at 285.2 and 287.0 eV are based on the relative amounts ofp-coumaryl, coni-feryl, or sinapyl monomers present in lignin from different plants [38]. Cellulose, water
Fig 1. Carbon 1s soft X-ray absorption spectra of lignin, cellulose, xylan, arabinoxylan, polygalacturonic acid, andβ-glucan.
insoluble xylan, and water soluble xylan had strong 1s!πtransition peaks at 289.3 and 290.7
eV that are associated aliphatic C-OH and C-H bonds, respectively. Small shoulders were pres-ent in the three samples at 285.2 and 286.5 that are associated with aryl C-H and phenol-C, re-spectively. Compared to xylans, the 286.5 eV peak was very weak for cellulose. The transition peaks of the cellulose spectrum are in agreement with earlier work [38]. The relative peak in-tensities at 285.2 and 286.5 eV for water soluble and insoluble xylans were different. However, the differences are very subtle and may be difficult to be used as a marker for differentiation. Arabinoxylan did not have the 285 and 286.5 eV shoulder peaks but its other transition peaks were similar to those found in the xylans and cellulose. The PGA had a distinct spectrum with a broad transition peak at 285.2 eV, an intense peak at 286.5 eV, and a distinct peak at 288.5 eV (carboxyl group) and hence it can be easily distinguished from other biopolymers. A small shoulder peak was also present at 287.3 eV in the PGA spectrum.β-glucan had a broad transi-tion peak at 285.2 eV and a prominent transitransi-tion peak at 289.3 eV. The 1s!σtransition peak
at 293.0 eV for the aromatic and aliphatic carbon are very broad and were present in the spec-tra of all compounds studied.
The O 1s XAS spectra of all biopolymers were similar except the PGA spectrum (Fig 2). Therefore, O 1s spectra by themselves cannot be used to identify different plant biopolymers. The 531.5 and 532.0 eV peaks can be assigned to the 1s!πpeak of C = O and the broad peak
around 538 and 539 eV are due to theσ-resonances [54].
Fig 2. Oxygen 1s soft X-ray absorption spectra of lignin, cellulose, xylan, arabinoxylan, polygalacturonic acid, andβ-glucan.
FT-IR Spectroscopy. Fig 3shows the IR spectra of lignin, cellulose, and hemicellulose, and PGA. The broad peak at 3520–3200 cm-1of all compounds represents OH stretching vi-brations [55,56]. Aliphatic C-H vivi-brations occur near 3000 cm-1and CH2groups have doublets
peaks around 2900 and 2800 cm-1[55,56]. The vibrational peaks between 2935–2915 and 2850–2815 cm-1are attributed to methylene C-H stretch and methoxy ether (O-CH3) groups,
respectively. All biopolymers have several similar and some distinct vibrational peaks in the 1800–800 cm-1region. Therefore, the vibrational peaks in this region are useful to finger print and identify different biopolymers.
The lignin spectrum had characteristic peaks at 1697, 1600, 1510, and 837 cm-1. Smaller peaks were present at 1460, 1424, 1330, 1127, and 1031 cm-1. The 1600 cm-1peak is attributed to the C = C vibration [55]. The peaks at 2930 and 2838 cm-1confirm the presence of methy-lene C-H stretch and methoxy ether (O-CH3) groups in lignin. Vibrational peaks for lignin are
observed at 1595 and 1510 cm-1in corn kernels [6]; at 1515 cm-1in wheat seed [12], and at 1610, 1602, and 1502 cm-1in soft and hard woods [57]. The 1424 and 1330 cm-1peaks are as-sociated with the vinyl C-H in-plane bend and methylene C-H bend. In general, the peak at 1510 cm-1is considered characteristic for lignin.
The cellulose spectrum had three distinct vibrational peaks at 1634, 1429, and 899 cm-1. Small vibrational peaks or shoulders were present at 1367, 1284, 1203, 1161, 1114, and 999 cm-1. The
Fig 3. FT-IR photo acoustic spectra of lignin, cellulose, xylan, arabinoxylan, polygalacturonic acid, andβ-glucan.
vibration at 2900 cm-1is attributed to the CH stretch and bands between 1460–1200 cm-1are at-tributed to the CH2, CH, and OH deformations. The band at 899 cm-1is attributed to the
pyra-nose sugar (917±13 cm-1) and confirms theβ-linkage (891±7 cm-1) present in cellulose whereas α-monomers have a band at 844±8 cm-1[56]. The 1429 cm-1vibrational peak of cellulose is dominant and is distinct compared to spectra of hemicellulose, PGA, andβ-glucan.
Xylan had two prominent vibrational peaks at 1646 and 1563 cm-1whereas the insoluble and soluble xylan had prominent peaks at 1637 cm-1and 1603 cm-1, respectively. All other peaks of the xylan compounds at wavelengths from 1460 to 800 cm-1were similar. The vibra-tional shoulder around the 990 cm-1was slightly lower for insoluble xylan (986 cm-1) and higher for the soluble xylan (995 cm-1). Hettrich reported peaks of 1070, 980, 620, 450 cm-1as characteristics to xylan from oat spelts [9]. Arabinoxylan had prominent vibrational peak at 1651 cm-1some notable peaks at 1460, 1251, 1211, 1162, 1087, 1047, and 899 cm-1which were all similar to xylan. The shoulder at 1007 cm-1peak was shifted towards higher energy com-pared to the 990 cm-1peaks of xylan compounds. Phillipe et al. [46] and Robert [10] assigned peaks of 1002,984, 958, and 895 cm-1to arabinoxylan from wheat and Cyran [1] assigned peak at 1045 cm-1to arabinoxylan from rye. Xu et al. [11] assigned peaks of 1165 and 1044 cm-1to arabinoxylan as well and they are all in agreement with the observed peaks in this study.
Polygalacturonic acid had a characteristic peak at 1736 cm-1, the vibrational peak is charac-teristic to ester groups (1750–1725 cm-1) [11]. Other characteristic peaks were at 1330 cm-1 (with two surrounding shoulders at 1397 and 1220 cm-1), 1147, 1017, 952, 890, and 830 cm-1. The peaks of PGA were different from all other biopolymers reported here and are in agree-ment to vibration peaks from onion pectin [14].
β-glucan had prominent vibrational peaks at 1650, 1367 (with two shoulders), 1202, 1159, and 897 cm-1. Small shoulders were present at 1452, 1317, 1202, and a broad band around 1028 cm-1. The 1650 cm-1peak was present in xylan, and arabinoxylan. The 1367, 1202, and 1159 peaks were unique toβ-glucan and thusβ-glucan can be easily differentiated from other biopolymers. The peaks (1020, and 895 cm-1) reported as assigned toβ-glucan from wheat in a previous study [10] are in agreement with this study. Wetzel et al. [58] reported 1420 cm-1peak is representative
forβ-glucan but this peak is present in cellulose and hemicellulose as well.
Plant Cell Spectromicroscopy
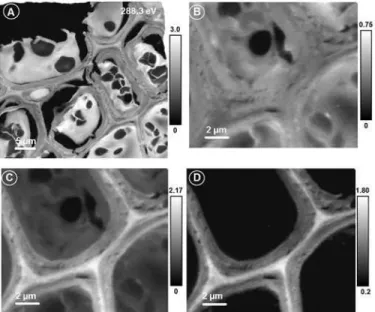
Soft X-ray Spectromicroscopy. The lentil stem cells were visible from the light micro-scopic image but did not show any internal structures or compositional differences between different cell components. The X-ray image of the sample (Fig 4A) recorded at 288.3 eV shows very clearly the individual cells, cell components, cell walls, and the middle lamella. The strong variation in absorption intensities in different regions is due to differences in absorption by dif-ferent biopolymers.Fig 4shows the advantages of the quick mapping method to determine the spatial distribution of any compound from a large area of a sample. The difference between two images (or the average of a few images around that energy region) recorded at the pre-edge (where non-carbon compounds or thickness effect of the sample shows up) and at the strong absorption peak of a compound reveals the spatial distribution of the compound. For example, Fig4Band4Cshows X-ray image at the pre-edge (average from 282.0 to 283.0 eV) and around the characteristic absorption peak of lignin (average from 284.7 to 285.7 eV). The difference be-tween the two images (Fig 4D) shows clearly the spatial distribution of lignin. Lignin was con-centrated in the cell wall and middle lamella and there was variation in the distribution of lignin between the primary and secondary cell walls (Fig 4D).
quantity of biopolymers present (Fig 5A–5D, scales bars of each map show the thickness of in-dividual components in nm). The spectra extracted from three marked regions (Fig 5D) of the sample were compared with the spectra of pure lignin, cellulose, and the amine epoxy resin (Fig 5E). Comparison of lignin spectra from the sample shows that the peak of 288.5 eV associ-ated with lignin was shifted to ~ 290 eV as PGA is also present in high concentrations in the middle lamella of plant cells. The amine epoxy resin has a peak at 290 eV. It is likely that during
Fig 4. Soft X-ray microscopic images of lentil stem section.Image recorded at 288.3 eV (A) showing a large number of cells; Pre-edge (B: average from 282.0–283.0 eV), lignin absorption (C: average from 284.7– 285.7 eV), and lignin distribution (D: C-B) images of lentil stem section. Scale bars indicate X-ray
optical density.
doi:10.1371/journal.pone.0122959.g004
Fig 5. Mapping of lignin, cellulose, and resin in lentil stem section (A-C), and RGB composite image (D) showing the distribution of all three components in lentil stem section.Comparison of C 1s X-ray absorption spectra of reference compounds (E) with that of spectra extracted from three locations (D) on the lentil stem section. Scale bars indicate the thickness of compounds in nm.
polymerization of the sample and resin, the resin penetrated the sample. The resin bonded well with the compounds inside the cell except the middle lamella as the resin map does not show any absorption in the middle lamella. This was evident, as the spectra extracted from all loca-tions inside the cell wall except the vacuoles or other structures resembled resin spectra (shown in blue in Fig5Dand5E). It is interesting to note that the spectra from the vacuoles inside the cell wall resembled cellulose or hemicellulose spectra and were not contaminated by the resin spectra. Cell walls had higher concentrations of lignin and the concentration was highest in the middle lamella. In the primary and secondary cell walls, the occurrence of lignin and cellulose was clearly evident from the mixing of two spectral features represented by the colours of lignin and cellulose.
FT-IR Spectromicroscopy. The optical microscopic image recorded on the entire lentil stem section prepared for IR study is shown inFig 6A. The stem section was approximately 844μm in radius from the center and had a tissue thickness of about 540μm from inside to
out-side (Fig 6A). The rectangular marked area (Fig 6A) represents the optical microscopic image of the scanned area, and extracted maps of lignin and cellulose from the stem section (Fig6Band 6C). The lignin and cellulose maps showed that there was spatial correlation on the distribution of the two biopolymers. However, differentiation of individual cells and the cell components were difficult. The spectra (Fig 6D) extracted from two different marked regions (Fig 6C) on the stem section show that both lignin and cellulose were present in that locations.
Sensitivity of Soft X-ray Spectroscopy. Soft X-ray absorption spectra are elemental spe-cific. For example, the carbon 1s absorption peak is about 285 eV and the oxygen 1s absorption peak is about 530.0 eV (http://xdb.lbl.gov/). In addition, the fine structures of the absorption spectra are representative of the local chemical bonds and functional groups [21]. The method has very good sensitivity to identify and characterize synthetic polymers [27,59]. It has been shown that the XAS of amino acid monomers, peptides (<50 amino acids), and small proteins
with substantial different compositions are different [60]. However, the XAS of complex pro-teins or different propro-teins cannot be differentiated due to large number of similar monomers present which masks the differences [61–63]. Similar problem is encountered in the macromol-ecules of cellulose, hemicellulose, andβ-glucan due to similar bonds and functional (C-C, C-H, C = O, C-OH, CH2) groups present in these biopolymers. The PGA due to the presence of
Fig 6. Visible (A) and FT-IR spectromicroscopy (B-D) of lentil stem section.Visible image of the entire lentil stem section (A) cut for FT-IR spectromicroscopy. The cellulose (B) and lignin (C) IR maps together with the spectra extracted (D) from two regions are shown.
carboxylic functional group is making it feasible to differentiate it from other biopolymers. The protein and starch C 1s spectra of plant derivatives have unique spectral features and can be easily differentiated from other biopolymers [64]. The reference spectra of biopolymers re-corded in this study were collected at a spectral resolution of 0.07 eV and most soft X-ray beamline have a resolution of ~0.1 eV, therefore, increasing the spectral resolution may not help to differentiate cellulose, hemicellulose, andβ-glucan in the soft X-ray regime.
Unlike soft X-ray spectroscopy, infrared spectroscopy is specific to molecular vibrations and is sensitive to identify the functional groups within a molecule. Therefore, the IR spectra of biopolymer references have unique spectral features.
Advantages of Soft X-ray Spectromicroscopy. The chemical absorption contrast com-bined with the nanometer resolution makes the soft X-ray spectromicroscopy an ideal tool for biopolymer characterization in-situ in samples. The use of soft X-ray spectromicroscopy for bio-polymer characterization in seeds and flax-fiber composites was investigated recently [64–66]. The distribution of protein around starch granules on a pristine seed endosperm and the effect of chemical treatment on flax fiber samples were investigated using STXM for the first time.
An application of soft X-ray spectromicroscopy in seeds is to characterize starch granules and biopolymers enclosing the granules [64]. The starch granules in seeds are of micrometer or sub-micrometer in size, soft X-ray spectromicroscopy is an ideal tool to investigate the starch gran-ules and surrounding biopolymers. Further, in order to check an alternative sample preparation route avoiding the use of resins, ultrathin sections were cut by ultramicrotomy from native wheat grains without using any fixation and resin-embedding steps. This way was successfully applied to prepare 70 nm thick sections of the wheat starchy endosperm zone. The slices were placed on holey carbon coated copper grids.Fig 7shows the results obtained from the starchy endosperm sample. Starch granules are enclosed by a layer of protein confirmed by the spectral signature dif-ferences. Staining techniques have been used to determine different components after observing differences in electron densities in different regions as observed using a scanning or transmission electron microscope. However, using STXM, the morphological structures as well as the compo-sition can be studied without any sample modification at high spatial resolution similar to an electron microscope. The embedding resins commonly used during sample preparation may
Fig 7. Compositional maps of starchy endosperm.Top row: component maps of protein, holey-carbon, and starch granules; bottom row: C 1s X-ray absorption spectra extracted from the components and the composite image showing all components in a single image.
sometimes interfere with the chemical mapping.Fig 8shows the soft X-ray spectra of two com-monly used resins for sample preparation. Both have spectral features in the region of interest of plant biopolymers. In comparison, LR white resin have spectral features very close to the amide peak at 288.2 eV, carboxyl group at 288.5, and the carbonate peak at 290.3 eV. Therefore, careful consideration should be given in choosing the resin depending on the biopolymer information required from the sample. Alternatively, cryo-ultramicrotome should be explored as an alterna-tive to cut plant tissues without using an embedding medium.
The applications of soft X-ray spectromicroscopy for characterizing bio-composite samples, specifically the interface regions that are hundreds of nanometer in size have been shown through different studies [65,66]. The electron microscopes commonly used to characterize in-terfacial bonding in bio-composites cannot differentiate the interface regions from the fibre and polymer matrices. This limits the ability to characterize adhesion and the bonding at the adhesion regions in bio-composites. It is also difficult to determine if any polymer is impreg-nated into the fibres during bio-composite preparation, which may affect bio-composite quali-ty. The carbon XAS measurements at high spatial resolution of 30 nm using the STXM are used to characterize the fibre, polymer matrix, and fibre-polymer matrix in flax bio-composite samples. The method has been even used to determine the composition of bean and quinoa chromosomes [40,41,67] and to visualize the effects of cell wall degrading enzymes on wood cells [68]. These studies clearly show the advantage of soft X-ray spectromicroscopy for bio-polymer characterization without the need for labelling as it is required for other biobio-polymer characterization methods. Another advantage of the synchrotron based soft X-ray spectromi-croscopy is the access to several elements, for example mapping organic and inorganic mole-cules for in-situ chemical analysis of plant samples.
Transmission and fluorescent modes are common methods of data collection in STXM. Ele-ments or compounds of higher concentrations (a couple of percentage) can be easily detected by the transmission detector which takes much less time than the fluorescent mode [69]. The fluorescent detectors have high detection sensitivity and can detect a couple of ppm
concentration compounds.
Relative Merits of Using Soft X-ray and FT-IR Spectromicroscopy Techniques. Sample preparation procedures for infrared and soft X-ray spectromicroscopy are similar. For both the techniques, the samples can be prepared using embedding medium or can be cryo-cut without
Fig 8. Carbon 1s soft X-ray absorption spectra of LR white and amine epoxy resin.
using any embedding medium. The sample thickness requirement for both the techniques is different. However, the ultra-microtomes can cut alternate sections from the same sample for both the techniques. Samples mounted on Si3Ni4can be also used for infrared
spectromicro-scopy. The samples can be kept dry or hydrated for soft X-ray whereas hydrated samples may be difficult for infrared spectromicroscopy.
Infrared has the advantage of less radiation damage compared to soft X-rays due to less in-tense beam and live cell samples can be kept alive even after data collection [8]. Soft X-rays are ionizing radiation and may induce damage to samples due to disassociation of sample chemical bonds or by deposition of organics in the X-ray beam path on the samples [41,70]. Radiation damage alters the spectral details of biopolymers and depends on the sample, sample state, rate of data collection, pixel resolution, number of repeated scans (or spectral resolution), and the beam characteristics. The radiation sensitivity of different biopolymers is different which should be taken into consideration when using STXM [39,41]. It has been shown that at same data collection rate and beam characteristics, cellulose from oak cell wall is prone to less dam-age compared to pure cellulose acetate. Wet bean chromosomes are damdam-aged more than dry chromosomes and different fixatives used alter the rate of damage. The radiation damage can be checked by scanning the same region after data collection and at certain energies (286.7 eV) the extent of the damage is mostly visible. Further, increased intensities of aromatic and keto-enol regions at 285 and 286.6 eV of cellulose is a good indicator of radiation damage. The lentil stem samples in this study were scanned with the smallest dwell time possible (i.e. 1 ms) and number of repeated scans in the same region were limited by selecting optimal spatial (100 nm) and spectral (0.2 eV) resolutions, and limiting the energy scan range from 280–300 eV. The reference spectra samples were collected by defocussing the beam which significantly min-imizes radiation damage. Careful handling of the sample such as selecting a fresh region after optimizing the STXM in an unwanted region in the sample dramatically helps to reduce the ra-diation damage from the region of interest. Sample cooling will reduce rara-diation damage and is possible in ultra-high vacuum (UHV) STXMs. A few UHV-STXMs are available in the world now and a few are being built. The similarity between soft X-ray and infrared methods enable one to combine the advantages of both the methods to study biopolymer samples and various synchrotrons around the world have both the techniques available in the same facility. An ex-cellent review on sample preparation methods and requirements, instrumentation, and data analysis of synchrotron based of FT-IR and soft X-ray spectromicroscopy techniques for appli-cations in environmental science is presented by Lawrence and Hitchcock [29].
The intrinsic challenge with plant samples is the complex molecular environments due to the presence of a large number of different biopolymers. The spectra of complex mixtures are usually dominated by the absorption of the polymer that is present in higher concentrations which may be problem in both soft X-rays and infrared spectromicroscopy. For instance, the soft X-ray spectra extracted from the cell walls did not show the strong pectin peak at 288.5 eV. Few possible explanations are: pectin in lentil stem is present in concentrations lower than the detection limit (<2%); pectin may have been removed during the sample preparation process;
than 100 nm or 8 um thick for the soft and IR data collection, respectively the spectra will have chemical information from other sample overlapping features. Three dimensional imaging is possible in both soft X-ray and IR spectromicroscopy and it will eliminate the spectral contam-ination from sample overlapping features [72,73].
Conclusions
FT-IR spectroscopy is a powerful technique to differentiate all plant biopolymers. However, the limited spatial resolution made it difficult to study the distribution and association of bio-polymers with different parts of the cell. The soft X-ray XAS has chemical speciation capabili-ties for most plant biopolymers and the carbon 1s spectra have good spectral features to differentiate biopolymers than the oxygen 1s spectra. The few peaks in soft X-ray spectra make the interpretation easier compared to IR spectroscopy. The sub-cellular spatial resolution that can be achieved using soft X-ray microscopy made it possible to quantitatively map the distri-bution of different biopolymers on plant cells. FT-IR spectromicroscopy is useful to character-ize larger samples in a short time while soft X-ray spectromicroscopy is the good tool to provide speciation at high spatial resolution in smaller regions of interest. Both soft X-ray and FT-IR spectromicroscopy techniques are complementary to each other for in-situ characteriza-tion of biopolymers in plant samples.
Acknowledgments
We thank Dr. Bert Vandenberg from the Crop Development Centre at the University of Sas-katchewan for providing lentil stem samples. We sincerely thank the developers and staff of all beamlines used to record data for this study namely the CLS-STXM (Dr. K. Kaznatcheev, Mr. D. Bertwistle, and Dr. M. Obst); ALS-STXM (Dr. D. Kilcoyne and Dr. T. Tyliszczak); and CLS-midIR (Dr. L. Quaroni, Dr. T. May, and C. Hyett) for their many contributions for developing and maintaining the facilities and help during the data collection. We also thank A. Buleon from INRA, France and H. Gnaegi from Diatome Ltd, Biel, Switzerland for fruitful discussion regarding wheat endosperm sample work.
Author Contributions
Conceived and designed the experiments: CK CRC CG LMB. Performed the experiments: CK CRC CG LMB. Analyzed the data: CK RL VP LMB. Contributed reagents/materials/analysis tools: CRC SSM CG APH. Wrote the paper: CK RL LMB.
References
1. Cyran MR, Saulnier L. Association and structural diversity of hemicelluloses in the cell walls of rye outer layers: Comparison between two ryes with opposite breadmaking quality. J Agric Food Chem. 2007; 55: 2329–2341. PMID:17305354
2. Guillon F, Bouchet B, Jamme F, Robert P, Quéméner B, et al. Brachypodium distachyon grain: charac-terization of endosperm cell walls. J Exp Bot. 2011; 62: 1001–1015. doi:10.1093/jxb/erq332PMID: 21062963
3. Miller SS, Fulcher RG, Sen A, Arnason JT. Oat endosperm cell walls: I. Isolation, composition, and comparison with other tissues. Cereal Chem. 1995; 72: 421–427.
4. Philippe S, Barron C, Robert P, Devaux M-F, Saulnier L, et al. Characterization using raman microspec-troscopy of arabinoxylans in the walls of different cell types during the development of wheat endo-sperm. J Agric Food Chem. 2006; 54: 5113–5119. PMID:16819924
5. Aspinall GO. Polsysaccharides. Oxford: Pergamon Press. 1970:104–114
7. Agarwal U. Raman imaging to investigate ultrastructure and composition of plant cell walls: distribution of lignin and cellulose in black spruce wood (Picea mariana). Planta. 2006; 224: 1141–1153. PMID: 16761135
8. Goff KL, Quaroni L, Wilson KE. Measurement of metabolite formation in single living cells of Chlamydo-monas reinhardtiiusing synchrotron Fourier-Transform Infrared spectromicroscopy. Analyst. 2009; 134: 2216–2219. doi:10.1039/b915810cPMID:19838406
9. Hettrich K, Fischer S, Schröder N, Engelhardt J, Drechsler U, et al. Derivatization and characterization of xylan from oat spelts. Macromol Symp. 2005; 232: 37–48.
10. Robert P, Marquis M, Barron C, Guillon F, Saulnier L. FT-IR investigation of cell wall polysaccharides from cereal grains. Arabinoxylan infrared assignment. J Agric Food Chem. 2005; 53: 7014–7018. PMID:16131104
11. Xu F, Sun JX, Geng ZC, Liu CF, Ren JL, et al. Comparative study of water-soluble and alkali-soluble hemicelluloses from perennial ryegrass leaves (Lolium peree). Carbohydr Polym. 2007; 67: 56–65.
12. Yu P, Block H, Niu Z, Doiron K. Rapid characterization of molecular chemistry, nutrient make-up and microlocation of internal seed tissue. J Synchrotron Radiat. 2007; 14: 382–390. PMID:17587665
13. Himmelsbach DS, Khahili S, Akin DE. Near-infrared–Fourier-transform–Raman microspectroscopic im-aging of flax stems. Vib Spectrosc. 1999; 19: 361–367.
14. Hsu CPS. Infrared Spectroscopy. In: Settle F, editor. Handbook of Instrumental Techniques for Analyti-cal Chemistry. New Jersey: Prentice-Hall Inc. 1997:247–284.
15. Jones PD, Schimleck LR, Peter GF, Daniels RF, Clark A III. Nondestructive estimation of wood chemi-cal composition of sections of radial wood strips by diffuse reflectance near infrared spectroscopy. Wood Sci Technol. 2006; 40: 709–720.
16. Miller SS, Fulcher RG. Distribution of (163),(164)-β-D-glucan in kernels of oats and barley using micro-spectrofluorometry. Cereal Chem. 1994; 71: 64–68.
17. Miller SS, Lu-Ann BA, Mark G, Brian MLA. Early Development of the seed coat of soybean (Glycine max). Ann Bot. 1999; 84: 297–304.
18. Yang CQ, Simms JR. Comparison of photoacoustic, diffuse reflectance and transmission infrared spec-troscopy for the study of carbon fibres. Fuel. 1995; 74: 543–548.
19. Chao W, Fischer P, Tyliszczak T, Rekawa S, Anderson E, et al. Real space soft X-ray imaging at 10 nm spatial resolution. Opt Express. 2012; 20: 9777–9783 doi:10.1364/OE.20.009777PMID:22535070 20. Ade H, Hitchcock AP. NEXAFS microscopy and resonant scattering: Composition and orientation
probed in real and reciprocal space. Polymer. 2008; 49: 643–675.
21. Stöhr J. NEXAFS Spectroscopy, Springer Series in Surface Sciences: Springer. 1992.
22. Cruz DH, Rousseau M, West MM, Pe0zolet M, Hitchcock AP. Quantitative mapping of the orientation of fibroinβ-sheets in B. mori cocoon fibers by scanning transmission X-ray microscopy. Biomacromole-cules. 2006; 7: 836–843. PMID:16529421
23. Dynes JJ, Tyliszczak T, Araki T, Lawrence JR, Swerhone GDW, et al. Speciation and quantitative map-ping of metal species in microbial biofilms using scanning transmission X-ray microscopy. Environ Sci Technol. 2006; 40: 1556–1565. PMID:16568770
24. Hitchcock AP, Koprinarov I, Tyliszczak T, Rightor EG, Mitchell GE, et al. Optimization of scanning transmission X-ray microscopy for the identification and quantitation of reinforcing particles in polyure-thanes. Ultramicroscopy. 2001; 88: 33–49. PMID:11393450
25. Koprinarov I, Hitchcock AP, Li WH, Heng YM, Stöver HDH. Quantitative compositional mapping of core-shell polymer microspheres by soft X-ray spectromicroscopy. Macromolecules. 2001; 34: 4424–4429.
26. Ade H, Smith AP, Zhang H, Zhuang GR, Kirz J, et al. X-ray spectromicroscopy of polymers and tribolog-ical surfaces at beamline X1A at the NSLS. J Electron Spectros Relat Phenomena. 1997; 84: 53–72.
27. Ade H, Urquhart S. NEXAFS spectroscopy and microscopy of natural and synthetic polymers. In: Sham TK, editor. Chemical Applications of Synchrotron Radiation. Signapore: World Scientific Pub-lishing. 2002:285.
28. Boyce CK, Cody GD, Feser M, Jacobsen C, Knoll AH, et al. Organic chemical differentiation within fos-sil plant cell walls detected with X-ray spectromicroscopy. Geology. 2002; 30: 1039–1042.
29. Lawrence JR, Hitchcock AP. Synchrotron based X-ray and FTIR absorption spectromicroscopies of or-ganic contaminants in the environment. Biophysico-Chemical Processes of Anthropogenic Oror-ganic Compounds in Environmental Systems: John Wiley & Sons. 2011:341–368.
31. Lehmann J, Solomon S, Brandes J, Fleckenstein H, Jacobson C, et al. Synchrotron-based near-edge X-ray spectroscopy of natural organic matter in soils and sediments. In: Dr. Nicola Senesi DBXPMH, editor. Biophysico-Chemical Processes Involving Natural Nonliving Organic Matter in Environmental Systems. 2009:729–781.
32. Moffet RC, Tivanski AV, Gilles MK. Scanning transmission X-ray microscopy: Applications in Atmo-spheric Aerosol Research; editor. Boca Raton: CRC Press Taylor & Francis Group. 2010:420–462 p.
33. Hitchcock AP, Morin C, Heng YM, Cornelius RM, Brash JL. Towards practical soft X-ray spectromicro-scopy of biomaterials. J Biomater Sci Polym Ed. 2002; 13: 919–937. PMID:12463511
34. Hitchcock AP, Morin C, Zhang XR, Araki T, Dynes J, et al. Soft x-ray spectromicroscopy of biological and synthetic polymer systems. J Electron Spectros Relat Phenomena. 2005; 144: 259–269.
35. Buckley CJ, Khaleque N, Bellamy SJ, Robins M, Zhang X. Mapping the organic and inorganic compo-nents of tissue using NEXAFS. J Phys IV. 1997; 7: 83–90.
36. Boyce CK, Zwieniecki MA, Cody GD, Jacobsen C, Wirick S, et al. Evolution of xylem lignification and hydrogel transport regulation. Proc Natl Acad Sci U S A. 2004; 101: 17555–17558. PMID:15574502
37. Boyce CK, Cody GD, Fogel ML, Hazen RM, Alexander CMO, et al. Chemical evidence for cell wall ligni-fication and the evolution of tracheids in early devonian plants. Int J Plant Sci. 2003; 164: 691–702.
38. Cody GD. Probing chemistry within the membrane structure of wood with soft X-ray spectral microsco-py. In: W.M. Ilse TW, and D Attwood, editor; 2000. Americal Institute of Physics. pp. 307–312.
39. Cody GD, Brandes J, Jacobsen C, Wirick S. Soft X-ray induced chemical modification of polysaccha-rides in vascular plant cell walls. J Electron Spectros Relat Phenomena. 2009; 170: 57–64.
40. Ade H, Zhang X, Cameron S, Costello C, Kirz J, et al. Chemical contrast in X-ray microscopy and spa-tially resolved XANES spectroscopy of organic specimens. Science. 1992; 258: 972–975. PMID: 1439809
41. Williams S, Zhang X, Jacobsen C, Kirz J, Lindaas S, et al. Measurements of wet metaphase chromo-somes in the scanning-transmission X-Ray microscope. J Microsc-Oxford. 1993; 170: 155–165.
42. Opanowicz M, Hands P, Betts D, Parker ML, Toole GA, et al. Endosperm development in Brachypo-dium distachyon. J Exp Bot. 2011; 62: 735–748. doi:10.1093/jxb/erq309PMID:21071680
43. Philippe S, Robert P, Barron C, Saulnier L, Guillon F. Deposition of cell wall polysaccharides in wheat endosperm during grain development: Fourier Transform-Infrared microspectroscopy study. J Agric Food Chem. 2006; 54: 2303–2308. PMID:16536611
44. Robert P, Jamme F, Barron C, Bouchet B, Saulnier L, et al. Change in wall composition of transfer and aleurone cells during wheat grain development. Planta. 2011; 233: 393–406.
45. Park P, Ikeda K-i. Ultrastructural analysis of responses of host and fungal cells during plant infection. Gen Plant Pathol. 2008; 74: 2–14.
46. Philippe S, Saulnier L, Guillon F. Arabinoxylan and (1!3),(1!4)-β-glucan deposition in cell walls dur-ing wheat endosperm development. Planta. 2006; 224: 449–461. PMID:16404577
47. Vorwerk S, Somerville S, Somerville C. The role of plant cell wall polysaccharide composition in dis-ease resistance. Trends Plant Sci. 2004; 9: 203–209. PMID:15063871
48. Goda K, Sreekala MS, Gomes A, Kaji T, Ohgi J. Improvement of plant based natural fibers for toughen-ing green composites-Effect of load application durtoughen-ing mercerization of ramie fibers. Compos Part A Appl S. 2006; 37: 2213–2220.
49. Belton PS, Saffa AM, Wilson RH. Use of Fourier transform infrared spectroscopy for quantitative analy-sis: a comparative study of different detection methods. Analyst. 1987; 112: 1117–1120. PMID: 3662017
50. Ma Y, Chen CT, Meigs G, Randall K, Sette F. High-resolution K-shell photoabsorption measurements of simple molecules. Phys Rev A. 1991; 44: 1848–1858. PMID:9906154
51. Beetz T, Jacobsen C. Soft X-ray radiation-damage studies in PMMA using a cryo-STXM. J Synchrotron Radiat. 2003; 10: 280–283. PMID:12714762
52. Miller LM, Smith GD, Carr GL. Synchrotron-based biological microspectroscopy: From the mid-infrared through the far-infrared regimes. J Biol Phys. 2003; 29: 219–230. doi:10.1023/A:1024401027599 PMID:23345838
53. Koprinarov IN, Hitchcock AP, McCrory CT, Childs RF. Quantitative mapping of structured polymeric systems using singular value decomposition analysis of soft X-ray images. J Phys Chem B. 2002; 106: 5358–5364.
54. Zubavichus Y, Zharnikov M, Schaporenko A, Grunze M. NEXAFS study of glycine and glycine-based oligopeptides. J Electron Spectros Relat Phenomena. 2004; 134: 25–33.
56. Colthup NB. Introduction to Infrared and Raman Spectroscopy. New York: Academic Press, Inc. 1990:547.
57. Pandey KK. A study of chemical structure of soft and hardwood and wood polymers by FTIR spectros-copy. J Appl Polym Sci. 1999; 71: 1969–1975.
58. Wetzel DL, Srivarin P, Finney JR. Revealing protein infrared spectral detail in a heterogeneous matrix dominated by starch. Vib Spectrosc. 2003; 31: 109–114.
59. Urquhart SG, Hitchcock AP, Smith AP, Ade HW, Lidy W, et al. NEXAFS spectromicroscopy of poly-mers: overview and quantitative analysis of polyurethane polymers. J Electron Spectros Relat Phenom-ena. 1999; 100: 119–135.
60. Moronne MM. Development of X-ray excitable luminescent probes for scanning X-ray microscopy. Ultramicroscopy. 1999; 77: 23–36. PMID:10321038
61. Boese J, Osanna A, Jacobsen C, Kirz J. Carbon edge XANES spectroscopy of amino acids and pep-tides. J Electron Spectros Relat Phenomena. 1997; 85: 9–15.
62. Kaznacheyev K, Osanna A, Jacobsen C, Plashkevych O, Vahtras O, et al. Innershell absorption Spec-troscopy of amino acids. J Phys Chem A. 2002; 106: 3153–3168.
63. Stewart-Ornstein J, Hitchcock AP, Cruz DH, Henklein P, Overhage J, et al. Using intrinsic X-ray absorp-tion spectral differences to identify and map peptides and proteins. J Phys Chem B. 2007; 111: 7691–7699. PMID:17559260
64. Karunakaran C, Gaillard C, Bouchet B, Gnaegi H, Bouleon A, et al. Characterization of wheat grain tis-sues by soft X-ray spectromicroscopy. Saskatoon: Canadian Light Source. 2010:50–51.
65. Karunakaran C, Müssig J, Cutler J, Hitchcock AP. Characterization of interfacial bonding in bio-com-posites by soft X-ray spectromicroscopy. Saskatoon: Canadian Light Source Inc. 2009:116–117.
66. Oraji R, Karunakaran C, Panigrahi S, Hitchcock AP. X-ray spectromicroscopy of the effect of chemical treatment on flax fibres. Saskatoon: Canadian Light Source Inc. 2013:118–119.
67. Yangquanwei Z, Neethirajan S, Karunakaran C. Cytogenetic analysis of quinoa chromosomes using nanoscale imaging and spectroscopy techniques. Nanoscale Res Lett. 2013; 8: 463. doi:10.1186/ 1556-276X-8-463PMID:24191931
68. Jeremic D, Goacher R, Yan R, Karunakaran C, Master E. Direct and up-close views of plant cell walls show a leading role for lignin-modifying enzymes on ensuing xylanases. Biotechnol Biofuels. 2014; 7: 496. doi:10.1186/s13068-014-0176-9PMID:25598840
69. Hitchcock AP, Obst M, Wang J, Lu YS, Tyliszczak T. Advances in the detection of Arsenic in environ-mental samples using low energy X-ray fluorescence in a scanning transmission X-ray microscope: Ar-senic Immobilization by an Fe(II)-xxidizing freshwater bacteria. Environ Sci Technol. 2012; 46: 2821–2829. doi:10.1021/es202238kPMID:22283463
70. Cody GD, Brandes J, Jacobsen C, Wirick S. Soft X-ray induced chemical modification of polysaccha-rides in vascular plant cell walls. J Electron Spectros Relat Phenomena. 2009; 170: 57–64.
71. Jacobsen C, Lindaas S, Williams S, Zhang X. Scanning luminescence X-Ray microscopy—Imaging fluorescence dyes at suboptical resolution. J Microsc-Oxford. 1993; 172: 121–129.
72. Quaroni L, Obst M, Nowak M, Zobi F. Three-dimensional mid-infrared tomographic imaging of endoge-nous and exogeendoge-nous molecules in a single intact cell with subcellular resolution. Angew Chem Int Ed Engl. 2015; 54: 318–322. doi:10.1002/anie.201407728PMID:25395248