Assessment of Habitat Suitability Is Affected
by Plant-Soil Feedback: Comparison of Field
and Garden Experiment
Lucie Hemrová2, Jana Knappová1,2, Zuzana Münzbergová1,2*
1Department of Botany, Faculty of Science, Charles University in Prague, Prague, Czech Republic,
2Institute of Botany, Academy of Sciences of the Czech Republic, Průhonice, Czech Republic
Abstract
Background
Field translocation experiments (i.e., the introduction of seeds or seedlings of different spe-cies into different localities) are commonly used to study habitat associations of spespe-cies, as well as factors limiting species distributions and local abundances. Species planted or sown in sites where they naturally occur are expected to perform better or equally well compared to sites at which they do not occur or are rare. This, however, contrasts with the predictions of the Janzen-Connell hypothesis and commonly reported intraspecific negative plant-soil feedback. The few previous studies indicating poorer performance of plants at sites where they naturally occur did not explore the mechanisms behind this pattern.
Aims and Methods
In this study, we used field translocation experiments established using both seeds and seedlings to study the determinants of local abundance of four dominant species in grass-lands. To explore the possible effects of intraspecific negative plant-soil feedback on our results, we tested the effect of local species abundance on the performance of the plants in the field experiment. In addition, we set up a garden experiment to explore the intensity of intraspecific as well as interspecific feedback between the dominants used in the
experiment.
Key Results
In some cases, the distribution and local abundances of the species were partly driven by habitat conditions at the sites, and species performed better at their own sites. However, the prevailing pattern was that the local dominants performed worse at sites where they naturally occur than at any other sites. Moreover, the success of plants in the field experi-ment was lower in the case of higher intraspecific abundance prior to experiexperi-mental setup. In the garden feedback experiment, two of the species performed significantly worse in soils conditioned by their species than in soils conditioned by the other species. In addition, the performance of the plants was significantly correlated between the two a11111
OPEN ACCESS
Citation:Hemrová L, Knappová J, Münzbergová Z (2016) Assessment of Habitat Suitability Is Affected by Plant-Soil Feedback: Comparison of Field and Garden Experiment. PLoS ONE 11(6): e0157800. doi:10.1371/journal.pone.0157800
Editor:Dusan Gomory, Technical University in Zvolen, SLOVAKIA
Received:March 23, 2016
Accepted:June 3, 2016
Published:June 23, 2016
Copyright:© 2016 Hemrová et al. This is an open access article distributed under the terms of the Creative Commons Attribution License, which permits unrestricted use, distribution, and reproduction in any medium, provided the original author and source are credited.
Data Availability Statement:Data are given in the supplementary information.
Funding:The work was supported by the grant Agency of Czech Republic (www.gacr.cz, Grant no. 16-09659S to ZM) and partly by the Czech Academy of Sciences (www.cas.cz, RVO 67985939), and by Ministry of Education of the Czech Republic (www. msmt.cz). This article has been written during
implementation of the project“Integration of the
experimental and population biology using new
methods of interdisciplinary issues–the way to
excellence with young scientists”, No. CZ.1.07/2.3.00/
experiments, suggesting that plant-soil feedback is a likely explanation of the patterns observed in the field.
Conclusions
All of the results indicate that intraspecific negative plant-soil feedback, either biotic or abi-otic, may be a key factor determining the performance of the plants in our field translocation experiment. The possible effects of negative feedback should thus be considered when evaluating results of translocation experiments in future studies.
Introduction
Understanding the factors determining the distribution of species in the landscape as well as their local abundances is one of the most important topics in current ecology ([1–3]). The asso-ciation of species with specific environmental conditions is commonly studied using transloca-tion (transplant) experiments [4]. In these experiments, species are typically planted or sown to compare performance or other attributes among various sites at which they naturally do and do not occur. For example, many recent studies have used such an approach to explore the intensity of edaphic associations of different species in tropical rainforests (e.g., [5–10]). Simi-larly, habitat associations have also been explored using transplant experiments in temperate forest trees [11] and herbs [12]. The same experimental design, i.e., sowing or planting plants at occupied and unoccupied sites, is also commonly used to study the importance of habitat vs. dispersal limitations of species at a range of spatial scales, with a majority of these studies being performed in grassland ecosystems (e.g., [13–20]).
In all of the above experiments, it is expected that species planted or sown at sites where they naturally occur will perform better or equally well compared to the sites at which they do not occur or are rare. Better performance at sites naturally occupied by the species is taken as support for the idea that these species show strong habitat associations and are thus mainly habitat-limited. Equal performance at all sites, on the other hand, is considered to demonstrate that the species are primarily dispersal-limited [21].
While most of the above cited experiments found that the species in question perform better or equally well at occupied sites than at unoccupied sites, exceptions to this pattern have been found in a range of studies of some species and experimental areas (e.g., [5], [6], [13], [14], [22]), indicating that other results, i.e., lower performance at occupied than at unoccupied sites, might occur. None of these studies, however, extensively explored the possible explana-tions for such a pattern.
Lower performance at occupied compared to unoccupied sites can theoretically be expected to occur based on the Janzen-Connell hypothesis ([23], [24]). This hypothesis suggests that, due to the existence of specialist natural enemies, species are more likely to recruit and establish under heterospecifics than under conspecifics, leading to the maintenance of high diversity in natural communities (see tests in e.g., [25–27]). Recently, similar effects have also been investi-gated in terms of plant-soil feedback (e.g., [28], [29]). Negative plant-soil feedback can be viewed as one possible mechanism responsible for the Janzen-Connell effect, promoting species coexistence and diversity by decreasing the local abundance of species at sites where they previ-ously occurred, leading to their higher abundances in other areas [28]. Indeed, much literature supports the expectation that local species could perform worse at their home sites than at other sites due to the accumulation of species-specific pathogens and/or predators, or due to Fund (ESF) and the national budget of the Czech
Republic through the Operational Programme Education for Competitiveness (OPEC). The funders had no role in study design, data collection and analysis, decision to publish, or preparation of the manuscript.
the species-specific use of soil nutrients (e.g., [30–32]). This possibility is, however, often not considered in transplant experiments designed to study the determinants of species distribu-tions and local abundances. This can lead to incorrect conclusions regarding habitat associa-tions of the species in question.
In this study, we used a field translocation experiment that was established using both seeds and seedlings to study the determinants of local abundance for four dominant species in grass-lands. Based on the above evidence, it may be expected that intraspecific plant-soil feedback may be an important factor affecting the results of our experiment. More specifically, it can be expected that intraspecific feedback will be stronger in places where the species of interest are dominant in comparison with localities where they are in a subordinate position or absent. To explore this, we tested the effect of local species abundance (measured on a continuous scale) on the performance of the plants in the field translocation experiment. In addition, we set up an additional two-phase garden experiment to explore the intensity of intraspecific and inter-specific feedback between the dominant species used in the field experiment. Specifically, we attempted to answer the following questions: 1) Are there any differences in the abiotic condi-tions between the localities dominated by the different species? 2) Does the performance of plants transplanted to different localities differ between localities with a different dominant? 3) What are the effects of the dominants on the soil chemical composition in the garden experi-ment? 4) Is plant performance in the second phase of the garden experiment affected by the species cultivated in the soil in the first phase? 5) Do the results of the field and garden experi-ments differ between early and later stages of plant development? 6) Is there any congruence between the results from the field and garden experiments?
Methods
Model species
We used four different dominant plant species of dry grasslands in northern Bohemia, Czech Republic, Europe [33], as model species. They includeAnthericum ramosumL. (Liliaceae),
Bra-chypodium pinnatum(L.) BEAUV. (Poaceae),Bromus erectusHuds. (Poaceae) andInula
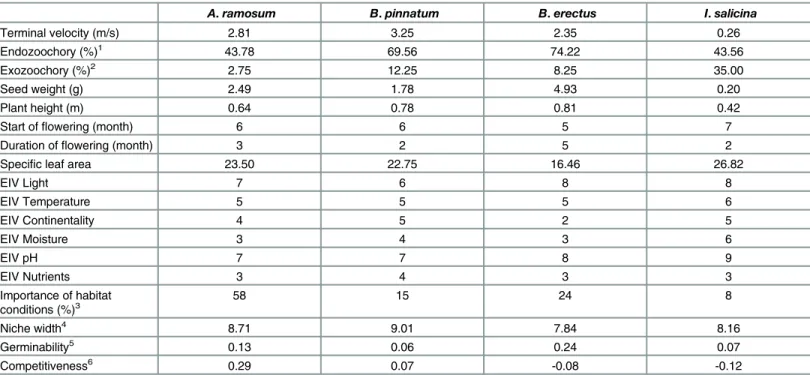
sali-cinaL. (Asteraceae) [34]. All of these species are long-lived, clonally growing perennials with a wide distribution across Europe [34]. A comparison of specific life history traits and habitat requirements of these species is given inTable 1. Most of the data given inTable 1come from [35]. Data on the importance of habitat conditions are based on [33]. Data on niche width are based on the approach of ([36]) and were calculated in Knappová and Münzbergová [37]. Data on field germinability and field competitiveness were assessed based on data from seed sowing experiment on abandoned fields in the area ([20]).
Experimental localities
Habitat conditions
We compared habitat conditions at the different localities to identify possible differences among them. At each locality, we collected 3 mixed soil samples, each containing a mixture of three smaller samples collected within 1 m2, in a dense stand of the respective dominant spe-cies. At the mixed locality, we collected four mixed samples, each in close proximity to one transplant transect (described below). We analyzed actual and potential pH using H2O and KCl, respectively; the content of total carbon, organic carbon, carbon in carbonates; and the total phosphorus, nitrogen, calcium, potassium and magnesium in each mixed sample [38].
To characterize local microclimatic conditions at the localities, we used TMS3 climatic sta-tions (TOMST Co.,www.tomst.com). These stations integrate three temperature sensors, humidity sensors and a datalogger. Calibrated temperature sensors (DS7505U + Maxim, Dallas Semiconductor) located in low, middle and upper positions record the temperature at 6 cm below the soil surface, on the surface and 15 cm above the surface. Humidity is measured based on the delayed passage of an electric current along a conductor at a depth between 0 and 15 cm Table 1. Characteristics of the target species.Sources of the data are given in the methods. EIV stands for Ellenberg indicator values.
A.ramosum B.pinnatum B.erectus I.salicina
Terminal velocity (m/s) 2.81 3.25 2.35 0.26
Endozoochory (%)1 43.78 69.56 74.22 43.56
Exozoochory (%)2 2.75 12.25 8.25 35.00
Seed weight (g) 2.49 1.78 4.93 0.20
Plant height (m) 0.64 0.78 0.81 0.42
Start offlowering (month) 6 6 5 7
Duration offlowering (month) 3 2 5 2
Specific leaf area 23.50 22.75 16.46 26.82
EIV Light 7 6 8 8
EIV Temperature 5 5 5 6
EIV Continentality 4 5 2 5
EIV Moisture 3 4 3 6
EIV pH 7 7 8 9
EIV Nutrients 3 4 3 3
Importance of habitat
conditions (%)3 58 15 24 8
Niche width4 8.71 9.01 7.84 8.16
Germinability5 0.13 0.06 0.24 0.07
Competitiveness6 0.29 0.07 -0.08 -0.12
1The value represents % seed viability after simulated endozoochory, 2the values represent % seeds attached to a sheep fur after shaking 10 times, 3
the values represent % of variance in distribution of the species in the studied region by data on local habitat conditions and past land use at the localities.
4the value represents niche width assessed for each species using a co-occurrence based approach as explained in the methods. 5,6
Field germinability andfield competitiveness were assessed based on data from seed sowing experiment on abandonedfields in the area as described in the methods. Field germinability was assessed as the total number of individuals of particular species present in the second year following the sowing, expressed as proportion of sown viable seeds. Field competitiveness was calculated as log response ratio (LRR;) as follows LRR = ln(Nundisturbed/
Ndisturbed) where N stands for the total number of individuals established in undisturbed and disturbed plots respectively. The higher absolute value of
LRR, the larger difference between seedling numbers at disturbed and undisturbed plots, positive numbers denote more seedlings being established in undisturbed plots. In this way the resulting variable express the ability of species to establish under vegetation canopy (positive LRR values), or in other words, species preference of gaps or early successional stages (negative LRR values).
Fig 1. Map showing the position of the studied localities.Aerial photograph and relief model provided by the Czech Office for Surveying, Mapping and Cadastre (www.cuzk.cz).
doi:10.1371/journal.pone.0157800.g001
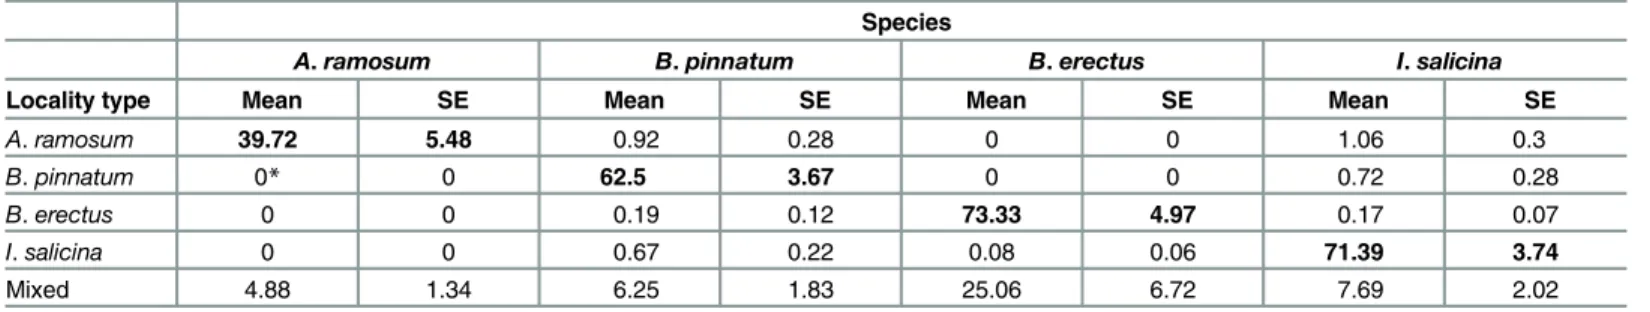
Table 2. The cover of all dominant species on each of the five locality types.
Species
A.ramosum B.pinnatum B.erectus I.salicina
Locality type Mean SE Mean SE Mean SE Mean SE
A.ramosum 39.72 5.48 0.92 0.28 0 0 1.06 0.3
B.pinnatum 0* 0 62.5 3.67 0 0 0.72 0.28
B.erectus 0 0 0.19 0.12 73.33 4.97 0.17 0.07
I.salicina 0 0 0.67 0.22 0.08 0.06 71.39 3.74
Mixed 4.88 1.34 6.25 1.83 25.06 6.72 7.69 2.02
The data are % cover values based on the data collected in 1 m2squares subsequently used for the sowing experiment. There were 6 squares per locality and 3 localities with a single dominant species and one mixed locality with 8 squares. The cover of the local dominant is shown inbold. *indicates species presence at the locality even though it was not recorded when setting the sowing plots.
below ground using the principle known as Time Domain Transmission. The sensor measures the delay at a frequency of 100–200 MHz. This method has the greatest resistance to salinity and temperature dependence. The inaccuracy of the measurement between the sensors under the same conditions is below ± 3% (www.tomst.com). Three stations were placed at each local-ity between August 2012 and August 2014, and the temperatures and moisture were recorded every 15 minutes. We used these data to calculate mean, minimum and maximum daily tem-perature and moisture for each station.
Field experiment
The field translocation experiment consisted of sowing seeds and planting seedlings of all four dominants at localities with the different natural dominants. We decided to use both sowing and transplant experiments, as our previous studies in the same system showed different levels of success for these two approaches for different species (e.g., [13]). In addition, due to the very slow growth of plant species under the conditions at the studied localities (e.g., [39,40], the seedlings did not reach the size of the transplants over the course of the experiment, and we thus evaluated different parts of the life cycle using this approach. This is also the reason we studied different plant characteristics for the sowing and planting experiments.
For the sowing experiment, we set up 6 experimental plots (1 × 1 m) at each locality. The plots were placed in a homogenous dense stand of the local dominant and were at least 2 m apart. The plots were always set up near the transects used in planting (see below). At each plot, the % cover of each of the four dominant species was recorded before the establishment of the experiment in autumn 2011 (Table 2). The plots were then disturbed, removing all of the vegetation, including roots. A central square (0.5 × 0.5 m) was divided into quarters to create subplots, and each dominant was sown into one of these subplots. The seeds were sown into the same subplots in two sequential years (autumn 2011 and 2012) because it was not possible to establish new plots in 2012 due to the small size of some localities.
The seeds for the sowing experiment were collected in 2011 and 2012 from at least 3 popula-tions per species in the studied area and were then mixed. The seeds were stored in paper bags at room temperature before sowing. To set up the sowing experiment, we used 100 seeds per plot forA.ramosum,B.pinnatumandB.erectus. ForI.salicina, which has small seeds that are difficult to count, we used a 2-ml tube full of seeds, corresponding to approximately 265 seeds, in autumn 2011. Due to low germination ofI.salicinain the spring of 2012, we increased the number of sown seeds for this species to 25 ml, corresponding to approximately 3313 seeds per plot in autumn 2012. The number of seedlings in the experimental plots was recorded in June and October 2012 and in September 2013. In each recording period, the number of seedlings of each species was recorded in its sowing quarter as well as in the quarters of sowing with the other dominant species. The seedlings in the quarters sown with the other dominants were assumed to have come from the seed bank or from seed rain and served as controls.
Plants used in the seedling transplant experiment were pre-grown in an experimental gar-den at the Institute of Botany, Czech Academy of Sciences, Průhonice, Czech Republic. The seeds used for this purpose were collected in 2010 from at least 3 populations in the studied area. The seeds obtained from each species were mixed and used for the experiment. The seeds were sown into pots filled with garden soil in a greenhouse in January 2011. The seeds ofA.
ramosumwere stratified in the soil in the garden for a month prior to sowing and left to
At each locality, the seedlings were planted along transects. At most localities, we set up 2 transects that were approximately 24 m long (all of the transects together at each locality were always 48 m long). In the case of smaller localities, up to four shorter transects were established. The transects were always positioned in dense homogenous stands of the local dominant. In cases where a markedly different vegetation patch occurred along the transect, the transect was interrupted. At the mixed locality, we used 4 transects that were approximately 12 m long, and each of these was positioned in a vegetation patch in which one of the dominants was clearly in the minority. We planted 40 individuals of each of the 4 dominants along the transects, 30 cm apart, and alternating in the following sequence:A.ramosum,B.pinnatum,B.erectusandI.
sal-icina. By regularly alternating the four species, we aimed to ensure that all species were planted
across the whole locality. A circle with a 10 cm diameter was disturbed by removing all of the vegetation and roots up to 10 cm depth at each planting location, and the planted individual was marked. The open circles around the plants were maintained during the entire experiment by weeding at each recording time (see below). The seedlings were marked for future identifica-tion, watered immediately after planting and not further treated in any way.
The planted seedlings were revisited at the end of June/beginning of July (summer) and the end of October/beginning of November (autumn) each year (2011 to 2014), with the last recording occurring in summer 2014. During each recording period, we recorded seedling sur-vival, length of the longest leaf for each plant (length of the longest stalk inI.salicina), number of rosettes for each plant (no. of leaves forA.ramosum) and flowering characteristics, including the number of fertile stalks and the length of the longest fertile stalk. Dead plants were replaced in summer 2011 but were not replaced afterwards.
To characterize the local effects of our model species on conspecifics and on each other, we recorded the percent cover of all four dominant species in a 30 × 30 cm square around each planted individual before the initial weeding. These data were used to determine the effect of abundance of each of the dominants on seedling size and survival.
Feedback experiment
To test whether the performance of a dominant at a site is affected by the feedback between the plant and the soil, we set up a feedback experiment in a common garden at the Institute of Bot-any, Czech Academy of Sciences, Průhonice, Czech Republic. We used a classical two-phase feedback experiment (e.g. [41], [42]). To do so, we collected soil from two localities in the study region in March 2013. These localities were selected from within the vicinity of the localities used in the field experiment and represented the two most distinct soil types among the locali-ties used in the field experiments. Both of these localilocali-ties were next to dry grasslands at the edges of field roads and the soil was collected from exposed slopes along the roads. Therefore, the soil at these locations was bare and not affected by any of our dominant species or any other vegetation. We then transferred the soil to the common garden. The soil of each origin was thoroughly mixed and sieved by a sieve with a 0.5 cm mesh size to remove large stones. The experimental design described below was then applied separately to the soil of each origin.
before sowing. The pots were placed into a partly heated greenhouse (the temperature was pre-vented from dropping below 10°C). We continuously weeded out all unwanted species arriving by seed rain from all of the pots.
In October 2013, the plants, including their roots, were removed from the pots, and all of the soil that was conditioned by a single species, as well as the control soil, was thoroughly mixed, resulting in 5 different soil types for each soil origin (soil conditioned by each of the 4 dominants and a control consisting of unconditioned soil). The soil was then sifted using a sieve with a 0.5 cm mesh size to remove larger root fragments. We took 3 samples from each soil type and soil origin to analyze actual and potential pH using H2O and KCl, the content of total carbon, organic carbon, carbon in carbonates and the total phosphorus, nitrogen, calcium, potassium and magnesium in each sample as described above. Note that the samples for the soil analyses are not true replicates as they came from the same soil mixture. Thus, the results based on these analyses should be considered with caution. Afterwards, we mixed part of the soil conditioned by all four dominants into an even mixture, hereafter referred to as mixed soil type. As a result, we had 6 soil types in total for each soil origin.
In the second (feedback) phase of the experiment, 480 square pots of 10 × 10 × 10 cm were filled with the soil (40 pots per soil type × 6 soil types × 2 sites of soil origin). The seeds for the second phase of the experiment were collected from at least two populations between July and September 2013 and were mixed. In December 2013, we sowed 50 seeds of each dominant per pot (800 seeds forI.salicina). At the same time, seeds were also placed on Petri dishes and seed germination in the growth chamber (20°C day/5°C night with 12-hour photoperiod) was fol-lowed until all seeds either germinated or rotted (50 seeds per Petri dish (800 forI.salicina), 3 replicates per species). Each dominant was sown into 10 pots of each soil type. The pots were kept in the experimental garden to experience the winter frosts until the end of March 2014, when they were transferred to a partly heated greenhouse (the temperature was prevented from dropping below 10°C). The emerging seedlings were regularly counted. To reduce density dependence, we removed some of the seedlings to allow a maximum of 1 seedling per 6 cm2(16 seedlings per pot). Most seeds germinated by the end of May 2014. At this time, all of the seed-lings except for one were removed from each pot. When no seedseed-lings survived in a pot, we trans-planted into the pot a seedling of the same species, soil type and soil origin from another pot.
We measured the size of the seedlings at the end of May, in mid-July and at the beginning of September 2014. After the third measurement, the plants were harvested, separated into above-and below-ground parts, dried to a constant weight above-and weighed.
Data analysis
Habitat conditions. To characterize habitat conditions at the experimental localities, we used a multivariate direct gradient linear analysis approach, the redundancy analysis (RDA). RDA is a form of constrained ordination which examines how much of the variation in one set of variables (the dependent variables) can be explained by other (independent) variables. It is the multivariate analog of simple linear regression [43]. The dependent variables (soil condi-tions) were standardized before the analyses to account for the fact that they were measured in different units. To test if the locality types (i.e., localities with different dominants) differ in soil composition, we used a Monte Carlo permutation test. In addition to comparisons of all of the locality types together, we also tested pairwise differences between different locality types. In these tests, the samples from the same locality were permuted together. The multivariate analy-ses were done using Canoco 4 [44].
the soil surface and daily minima for soil moisture, as we assumed high temperature and low moisture to be the most important limiting factors at the localities. To express the differences among the localities, we calculated the daily deviation in these values from the overall daily mean for each locality. First, we calculated the mean of each daily value across all of the data-loggers and localities and then we subtracted it from each individual value. For temperature, we expressed these deviations in degrees Celsius. For moisture, we calculated percent devia-tions, as the absolute values did not have a simple quantitative explanation. To test for the dif-ferences among locality types, we used analysis of variance (ANOVA) and tested for the effects of day and datalogger nested within locality, nested within locality type.
Field experiment. To analyze the results of the field translocation experiment, we per-formed tests for each target species (i.e., sown or planted species) separately. For the sowing experiment, we analyzed the number of seedlings in the plots at each recording time sepa-rately (i.e., summer 2012, autumn 2012 and summer 2013). Because the results for the single time periods were largely comparable, we decided to present only the results from the last period. The analyses were conducted using generalized linear models (GLM) with a Poisson distribution. The predictors were locality type (localities dominated byA.
ramo-sum,B.pinnatum,B.erectus,I.salicinaand the mixed locality), locality nested within
locality type, plot nested within locality and cover of each dominant species in the area of the sowing plots before the experiment was established. While we also wanted to test for an inter-action between cover of each dominant species and locality type, this test was not possible due to the low number of replicates (sowing plots). Such a test was, however, done for the transplant experiment below. The number of seedlings of a given sown species recorded in the subplots in which it was not sown was used as a covariate in this analysis. When plotting the data, the number of seedlings in the controls was divided by 3 (i.e., recalculated to the same area as the area of the sown subplots) and subtracted from the number of seedlings in the sown subplot.
In the field transplant experiment, we used plant size at each recording time as a dependent variable (i.e., autumn 2011, summer 2012, autumn 2012, summer 2013, autumn 2013 and sum-mer 2014). The size of the plants at the time of planting, i.e. in sumsum-mer 2011, was used as a covariate in the tests. To describe plant size, we used length of the longest leaf, number of rosettes or leaves and their product (considered to be an estimate of plant biomass, see e.g., [20]) as dependent variables. The length of the longest leaf was square root-transformed and the estimated plant biomass was log-transformed to achieve normality. We also analyzed plant survival in each recording period. The predictors of plant performance in the experiment were locality type, locality nested within locality type, cover of each dominant species and the inter-action between cover of each dominant species and locality type. The effects of these predictors on leaf length and plant biomass were tested using ANOVA, the effects on the number of rosettes/leaves were tested using GLM with a Poisson distribution, and the effects on plant sur-vival were tested using logistic regression. Because the results of the analyses based on the num-ber of rosettes/leaves, leaf length and plant biomass were largely similar, only the results for plant biomass are presented further.
A.ramosumandI.salicinanever flowered in the experiment.B.pinnatumflowered only in 0.1% cases andB.erectusflowered in 1.4% cases. As a result, the data on plant flowering were not analyzed.
Feedback experiment. To explore the possible mechanisms explaining the intensity of plant-soil feedbacks, we tested the effects of soil origin (two source localities), soil type (soil conditioned by each target species, unconditioned soil, and the mixture of all of the condi-tioned soils) and their interaction on chemical composition (pH and content of nitrogen, phos-phorus, carbon, calcium, magnesium and potassium) of the soil after the conditioning phase. This was done using RDA analysis using the same approaches as were used when testing for differences in soil chemistry among the locality types. In addition to analyzing the overall effect of soil type on soil composition, we also explored the pairwise differences among all pairs of soil types. Because the effect of soil type turned out to be stronger than the effect of soil origin and there was no interaction between soil origin and soil type, only the results for soil type are shown in the results.
To analyze the effects of plant-soil feedbacks on plant performance, we performed tests for each target species separately. The dependent variables were the number of germinated seed-lings, plant size over the course of the experiment and aboveground and belowground biomass of the plants at the end of the experiment. The predictors were soil type, soil origin and their interaction. The effects of all predictors on plant performance were tested using GLM with a gamma distribution of the dependent variable, except for the effects on the number of germi-nated seedlings, which was tested using GLM with a Poisson distribution. As the results for plant size were largely similar to the results for aboveground and belowground biomass, the results for plant size are not shown or discussed further. In the results, we include tests of soil origin. In spite of few significant main effects of soil origin and their interactions, the patterns in the two soil origins were largely similar. For the purpose of the graphical presentation of the data and the comparison of the experiments described below, the data from the two soil origins were combined. Comparison of the two experiments based on data from each soil origin sepa-rately largely corresponded to the patterns based on the combined dataset.
Comparison of the experiments. To compare the results from the two experiments (the field experiment and the feedback experiment), the performance of each species in each soil type (i.e., at different locality types or in soils conditioned by the different species) was
expressed as Fct= ln(Sct/Stt), where Sctis the mean performance of target speciestgrown in soil conditioned by speciesc(at the locality type dominated by speciesc) and Sttis the mean perfor-mance of target speciestgrown in soil conditioned by itself (at its locality type). Performance was expressed as the number of seedlings, transplant survival and aboveground biomass for the field experiment and the number of seedlings and aboveground and belowground biomass for the feedback experiment. The value of Fctthus represents the intensity of feedback of the condi-tioning species on the tested species (feedback experiment) or the difference in performance of the species in its own locality compared to an alien locality type (field experiment). Negative values indicate that the species performs better in soil conditioned or dominated by itself. To compare the two experiments, we calculated Pearson correlations between the Fctvalues from both experiments based on different performance measures.
Results
Even though the five locality types (i.e., localities with one of the four dominants or with a mix-ture of all four dominants) differed in the abundance of the individual dominants (by defini-tion),B.pinnatumandI.salicinaoccurred relatively frequently at all locality types (Table 2). The mixed locality hosted all of the dominants in medium abundances, i.e., lower than that at the locality dominated by the given species, but higher than at the other localities (Table 2).
Habitat conditions
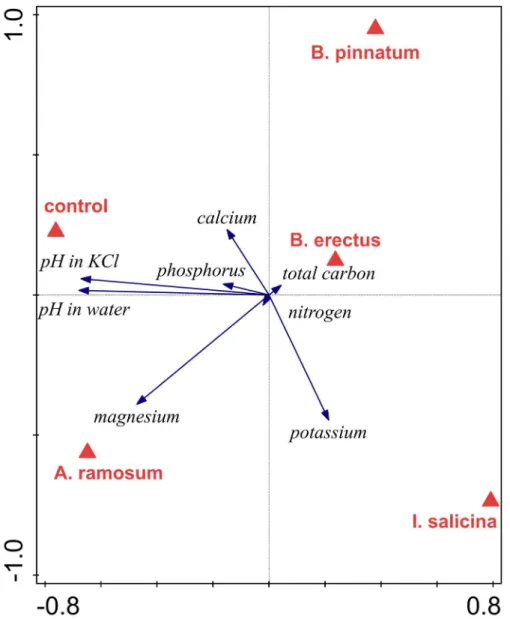
Redundancy analysis (RDA) of the soil chemical composition indicated that the locality types were marginally significantly different in overall soil composition (p = 0.052, 31.7% of the total variance explained). The localities that deviated the most were those dominated byI.salicina, which was separated from the others along the first ordination axis (Fig 2). These localities were characterized by high magnesium and potassium content and low pH. The second ordi-nation axis mainly separated the localities dominated byA.ramosum, which were character-ized by high calcium content, from the mixed locality, which was charactercharacter-ized by a high phosphorus content. A pairwise comparison between locality types suggested significant differ-ences in chemical soil composition between the localities dominated byA.ramosumandI. sali-cinaand those dominated byA.ramosumand B.pinnatum(p = 0.002 in both cases). No other pairwise differences in chemical soil composition were significant (p>0.05 in all cases).
The comparison of temperatures and moisture among the localities with different domi-nants showed a significant effect of locality type in all tests (p<0.001). The localities that devi-ated the most were those domindevi-ated byB.pinnatum. The average daily maximum temperature was 2.2°C higher and the average soil moisture was 16% lower than that of the average locality. At the other extreme, the mixed locality was on average 4.97°C colder and 51% wetter than all of the other localities (Table 3).
Field experiment
The number of seedlings in the sowing experiment was significantly affected by locality (except
forB.pinnatumseedlings) as well as by locality type for all dominants (Table 4, data inS1
Table). The number of established seedlings ofA.ramosumwas significantly higher at its own localities, the mixed locality and localities dominated byB.erectus. In contrast, the number of seedlings ofB.pinnatum,B.erectusandI.salicinaat their own localities was lower than at the other localities (Fig 3). The number of seedlings ofA.ramosum,B.pinnatumandB.erectus sig-nificantly decreased with their respective increasing cover at the sowing plots before removing the vegetation and setting up the sowing experiment. The number of seedlings ofI.salicina increased with increasing cover ofA.ramosumandB.erectusand decreased with increasing cover ofB.pinnatumat the sowing plot (Table 4).
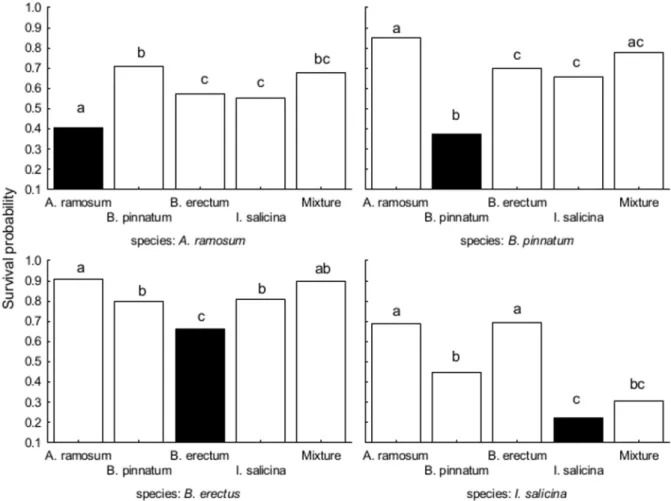
Survival and biomass of all dominants in the transplant experiment were significantly affected by locality type as well as by locality (Table 4, data inS2 Table). Locality explained more variability in survival but less variability in biomass forA.ramosum,B.erectusandI. sali-cinathan locality type. InB.pinnatum, the pattern was opposite (Table 4).
Survival of each species was the lowest when transplanted at the locality dominated by itself (Fig 4). In addition,A.ramosum,B.pinnatumandB.erectusgrowing at their own localities were smaller than at other localities. Biomass ofI.salicinawas similar at localities dominated
byB.erectus,B.pinnatumand itself, but it was significantly lower at localities dominated byA.
ramosumand at the mixed locality (Fig 5). Survival ofA.ramosumdecreased with the cover of
B.pinnatumin its surroundings and increased with the cover ofB.erectus. In addition, the
positive at the localities dominated byB.erectusand at the mixed locality, but was negative at localities dominated byI.salicina. Biomass ofA.ramosumsignificantly increased with increas-ing cover ofA.ramosumin its surroundings. The probability of survival ofB.erectuswas independent of cover of any species in its surroundings. Biomass ofB.erectussignificantly increased with increasing cover ofI.salicinain its surroundings. Survival and biomass ofI. sali-cinasignificantly increased with increasing cover ofA.ramosumin its surroundings. There was also a significant interaction between locality type and cover ofI.salicinaforI.salicina bio-mass. Specifically,I.salicinabiomass increased with increasing cover ofI.salicinain the sur-roundings in its own localities but decreased at other locality types. Neither survival nor Fig 2. Redundancy analysis (RDA) comparing chemical composition of the soils of different locality types.The effect of locality type (identity of dominant) is marginally significant (p = 0.052, 31.7% of the total variation explained). First axis explained 21.7% and the second axis explained 5.9% of the total variation in the data.
doi:10.1371/journal.pone.0157800.g002
Table 3. Deviations of maximum daily temperature at soil surface and of minimum daily soil moisture from the daily mean across all the localities.
Locality type Temperature Soil moisture
A.ramosum -0.51 -6.2
B.pinnatum 2.16 -16.0
B.erectus 0.30 -1.0
I.salicina -0.87 10.1
Mixed -4.97 50.9
The data are based on values measured by three dataloggers per a locality (four dataloggers in mixed locality) from 1stAugust 2012 to 30thAugust 2014). All the values are signi
ficantly different from each other at p<0.05.
Table 4. The effect of locality type, locality nested within locality type, cover of each dominant species (within the area of the sowing plots before setting the experiment or in the surroundings of the transplanted individual) and its interaction with locality type on the number of seedlings, sur-vival of transplanted plants and their aboveground biomass in field experiment.
Target species
A.ramosum B.pinnatum B.erectus I.salicina
No. seedlings
Df F p F P F P F p
Loc. type 4 16.16 <0.001 13.48 <0.001 33.04 <0.001 25.88 <0.001
Locality in loc. type
8 4.64 <0.001 1.65 0.128 3.7 0.001 7.42 <0.001
A.ramosum cover
1 3.87 0.054 1.11 0.297 3.42 0.069 45.69 <0.001
B.pinnatum cover
1 0.00 0.983 6.95 0.011 0.30 0.584 4.03 0.049
B.erectus cover
1 0.03 0.854 0.36 0.553 4.79 0.032 17.17 <0.001
I.salicina cover
1 1.01 0.319 2.23 0.140 0.00 0.950 1.28 0.263
Residuals Df = 63 Df = 63 Df = 63 Df = 63
Survival Df Dev. p Dev. P Dev. P Dev. p
Loc. type 4 17.44 0.001 43.81 <0.001 18.75 <0.001 52.29 <0.001
Locality in loc. type
8 24.12 0.002 29.21 <0.001 24.13 0.002 59.05 <0.001
A.ramosum cover
1 0.32 0.57 0.09 0.763 0.81 0.369 3.79 0.052
B.pinnatum cover
1 6.81 0.009 0.08 0.78 0.11 0.735 0.22 0.64
B.erectus cover
1 4.25 0.039 1.46 0.226 0.64 0.422 0.1 0.757
I.salicina cover
1 0.52 0.47 1.25 0.263 0 0.958 0.32 0.57
Loc. type x B.erectus
4 6.31 0.043 3.54 0.316 4.18 0.124 0.28 0.867
Residuals Df = 343 Df = 322 DF = 375 Df = 320
Aboveground biomass
Df F p F p F P F p
Loc. Type 4 5.9 <0.001 4.87 <0.001 17.56 <0.001 12.66 <0.001
Locality in loc. type
8 2.82 0.006 8.78 <0.001 5.76 <0.001 4.58 <0.001
A.ramosum cover
1 13.21 <0.001 0.04 0.841 2.81 0.094 21.15 <0.001
B.pinnatum cover
1 0.9 0.343 0.37 0.542 0.1 0.753 3.19 0.076
B.erectus cover
1 0.56 0.457 1.4 0.237 0.59 0.442 0.73 0.393
I.salicina cover
1 2.51 0.115 3.64 0.058 8.43 0.004 0.95 0.332
Loc. type xI. salicina
4 1.42 0.228 0.52 0.721 2.33 0.056 2.58 0.039
Residuals Df = 205 Df = 224 Df = 318 Df = 160
The interactions are shown in the table only if a given interaction was significant for at least one target species. The columns represent the sown/ transplanted species. The significant values with p0.05 are inbold.
Fig 3. The effects of locality type (field experiment) and soil type (i.e. cultivating species in the feedback experiment) on proportion of germinated seeds of A)Anthericum ramosum, B)
biomass ofB.pinnatumwas affected by the cover of any of the dominant species in its sur-roundings (Table 4).
Feedback experiment
Soil type had a significant effect on the chemical composition of the soil (p = 0.002, 23.4% of the total variance explained). The first ordination axis (explaining 15.4% of the total variance) clearly separated the control soil and the soil conditioned byA.ramosumfrom the soils condi-tioned by other species (Fig 6). The control soil and the soil conditioned byA.ramosumhad a higher pH and contained more phosphorus, carbon and magnesium than the other soils. The second ordination axis (explaining 5.2% of the total variance) separated the soil conditioned by
B.pinnatum, which had high calcium content, from the soils conditioned byA.ramosumandI.
salicina, which had high magnesium and potassium content (Fig 6). All pairwise comparisons
significantly different (p>0.05). Black columns represent dominant species on its locality/soil type. As the
patterns of the feedback in the two soil origins were largely similar, they were combined in the graphs for simplicity.
doi:10.1371/journal.pone.0157800.g003
Fig 4. The effects of locality type on the proportion of surviving individuals in the field experiment.The effects are shown for each dominant species separately. Each panel represents one tested species, columns within the panel represent the locality types. Columns within a panel sharing the same letter are not significantly different (p>0.05). Black columns represent dominant
species on its locality type.
of soils conditioned by different dominants showed a significant difference (p<0.05) except for the difference between control soil and soil conditioned byA.ramosum(p = 0.37).
In the feedback experiment, the germination ofA.ramosumandI.salicina, but not other species, was significantly affected by the origin of the soil (Table 5, the data inS3 Table). In addi-tion, seed germination inI.salicinawas significantly affected by soil type and by the interaction between the soil type and the origin of the soil.I.salicinagerminated worst in the soil condi-tioned by itself and germinated the best in the soil condicondi-tioned byA.ramosum(Table 5,Fig 3). different (p>0.05). Black columns represent dominant species on its locality/soil type. As the patterns of the
feedback in the two soil origins were largely similar, they were combined in the graphs for simplicity.
doi:10.1371/journal.pone.0157800.g005
Fig 6. Redundancy analysis (RDA) comparing chemical composition of control soil and the soils conditioned by different dominant species in feedback experiment.The effect of conditioning is significant (p = 0.002, 23.4% of the total variance explained). First axis explained 15.4% and the second axis explained 5.2% of the total variation in the data.
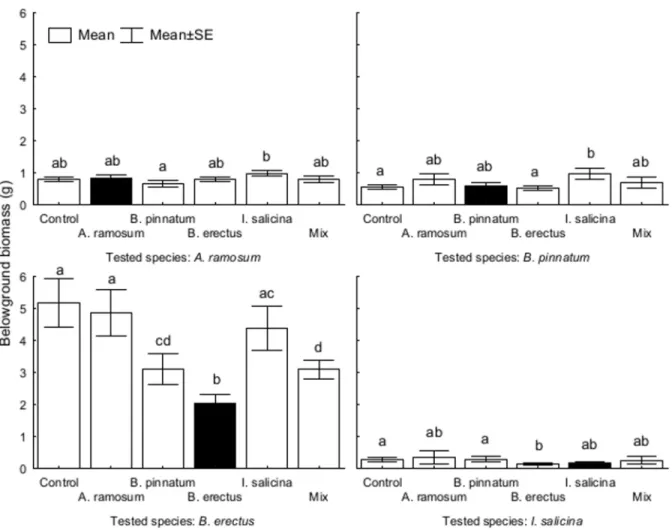
Aboveground biomass was significantly affected by the origin of the soil inI.salicinabut not the other species. InI.salicinaandB.erectus, biomass was also affected by soil type. In both species, the aboveground biomass was significantly lower in soil conditioned by itself than in the control soil (Fig 5). InB.pinnatumandB.erectus, the effect of soil type interacted with the effect of soil origin (Table 5).
Belowground biomass was significantly affected by the origin of the soil inA.ramosum,B.
pinnatumandI.salicina. However, soil type had a significant effect only on the biomass ofB.
erectus, which was lower in soil conditioned by itself compared to the soils conditioned by the
other species. There was also a significant interaction between the soil type and the origin of the soil forB.pinnatumandB.erectus(Table 5,Fig 7).
Comparison of the field and feedback experiments
The number of seedlings in the feedback experiment was positively correlated with the number of seedlings (Fig 8) and plant survival and negatively correlated with aboveground biomass in the field sowing experiment (Table 6). The only other significant correlation was between aboveground and belowground biomass in the feedback experiment (Table 6). In contrast to the significant correlation in plant performance between the two experiments, we did not detect any significant correlation in soil chemistry between the experiment types (p>0.12 in all cases). The exception was for soil pH, which was marginally significantly correlated between the two datasets (p = 0.055, r = 0.70).
Discussion
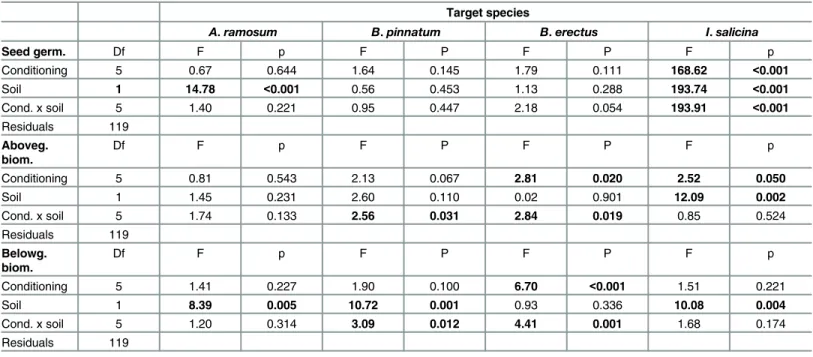
The results of the field experiment provide only limited support for the idea that local domi-nants perform better at the sites where they dominate. Specifically,A.ramosumgerminated better at its own localities and at the mixed locality, indicating that localities where it is highly Table 5. The effect of soil origin, soil type and their interaction on the number of seedlings, and on aboveground and belowground biomass of dif-ferent dominant species in feedback experiment.
Target species
A.ramosum B.pinnatum B.erectus I.salicina
Seed germ. Df F p F P F P F p
Conditioning 5 0.67 0.644 1.64 0.145 1.79 0.111 168.62 <0.001
Soil 1 14.78 <0.001 0.56 0.453 1.13 0.288 193.74 <0.001
Cond. x soil 5 1.40 0.221 0.95 0.447 2.18 0.054 193.91 <0.001
Residuals 119
Aboveg. biom.
Df F p F P F P F p
Conditioning 5 0.81 0.543 2.13 0.067 2.81 0.020 2.52 0.050
Soil 1 1.45 0.231 2.60 0.110 0.02 0.901 12.09 0.002
Cond. x soil 5 1.74 0.133 2.56 0.031 2.84 0.019 0.85 0.524
Residuals 119
Belowg. biom.
Df F p F P F P F p
Conditioning 5 1.41 0.227 1.90 0.100 6.70 <0.001 1.51 0.221
Soil 1 8.39 0.005 10.72 0.001 0.93 0.336 10.08 0.004
Cond. x soil 5 1.20 0.314 3.09 0.012 4.41 0.001 1.68 0.174
Residuals 119
The significant values with p0.05 are inbold.
abundant are clearly more suitable for the establishment of its seedlings, even though appar-ently not for subsequent growth. Additionally, the number ofA.ramosumseedlings was lower in plots with high cover of conspecifics before sowing. This may suggest the importance of local habitat conditions at the locality level in combination with the presence of negative local intraspecific plant-soil feedback at the plot level. In addition, localities dominated byA. ramo-sumsignificantly differed in soil composition from localities dominated by two other species
(B.pinnatumandI.salicina). While this result could be interpreted as an effect of differences
in habitat conditions between the localities, it could also be caused by plant-soil feedback mani-fested through differential nutrient acquisition by the different plant species. However,A.
ramosumwas the only species not having a significant effect on soil chemistry in the feedback
experiment. Still, differences in nutrient acquisition could be a possible explanation, as we com-pared localities ofA.ramosumto localities with other species that all had an effect. Finally, the results forA.ramosumare partly in line with the results of a study by Chýlová and Münzber-gová [33], in which the distribution ofA.ramosumwas demonstrated to be the most strongly determined by environmental conditions compared to many other species in the same grass-land community. In addition,Černá and Münzbergová [45] demonstrated a strong preference
for its native soil inA.ramosum.
Fig 7. The effects of soil conditioning by each dominant species on plant belowground biomass of different dominant species in the feedback experiment.Each panel represents one tested species. The columns within each panel represent the types of soil conditioning. Columns within the panel sharing the same letter are not significantly different (p>0.05).
In spite of the findings described above, the overall results of this study show weak support for the environmental determination of species distributions, which is in contrast to a range of studies indicating strong habitat associations in various species (e.g., [5–10]). It is, however, in line with another body of literature showing that dispersal limitation is an important driver of species distributions and abundances in the landscape and that local habitat conditions are thus of minor importance (e.g., [13–19]).
An important discovery of our study is the fact that several of the local dominants perform significantly worse at the localities they naturally occupy than at localities dominated by the other species. In the follow-up feedback experiment, we demonstrated that the poorer Fig 8. Comparison between the field and field back experiment.The graph shows the relative performances values (Fct) based on number of seedlings in the two experiments. As the patterns of the
feedback in the two soil origins were largely similar, they were combined in the graphs for simplicity.
doi:10.1371/journal.pone.0157800.g008
Table 6. Pearson correlation coefficients of relative performances (Fct) of individuals in feedback and field experiment.
Feedback Field experiment
No. seedlings Aboveg. biomass Belowg. biomass No. seedlings Survival Aboveg. biomass
Feedback
No. seedlings 0.36 -0.01 0.74 0.72 -0.79
Aboveg. biomass 0.36 0.76 0.28 0.12 -0.07
Belowg. biomass -0.01 0.76 0.18 -0.27 0.13
Field exp.
No. seedlings 0.74 0.28 0.18 0.41 -0.66
Survival 0.72 0.12 -0.27 0.41 -0.44
Aboveg. biomass -0.79 -0.07 0.13 -0.66 -0.44
Significant values (p<0.05) are inbold.
performance of the species at the localities they naturally occupy could be at least partly explained by negative intraspecific plant-soil feedback ([31], [41]). Via negative intraspecific feedback, the local dominant could suppress individuals of the same species in its surround-ings, e.g., by the accumulation of specialist pathogens or by a disproportional use of some nutrients that are limiting for that particular species ([32], [46]). As our sowing experiment in the field was established in disturbed plots, it is possible that the detected negative intraspecific feedback was conservative, as we removed roots of the plants and opened the space, which may have reduced some negative effects. Thus, negative intraspecific feedback in the field may be even more common than we reported.
In our feedback experiment, negative intraspecific feedbacks were clearly detected in the germination ofI.salicina. A similar but weaker effect was also apparent for its aboveground biomass. In addition,B.erectusgrew the poorest in its own soil, indicating that this species also suppressed itself by intraspecific plant-soil feedback. These results are largely in line with the results of the field experiment, indicating thatI.salicinaandB.erectusperformed worse at localities dominated by their own species than at localities dominated by any other species. The performance ofI.salicinaandB.erectusin our field experiment could largely be explained by the intraspecific feedback effects of either biotic or abiotic factors. In contrast, there was no indication of negative intraspecific feedback in the feedback experiment forA.ramosumandB.
pinnatum, but these two species still survived worse at localities dominated by themselves than
at localities dominated by any other species in the field transplant experiment. Other explana-tions therefore need to be sought to explain this pattern.
One possible explanation could be the slow growth and low amounts of root biomass ofA.
ramosumandB.pinnatumin the feedback experiment. As a result, the effect of these species
on the soil could be weaker than those ofI.salicinaandB.erectus. Still, these plants could have relatively strong negative feedback effects in the field, as the field soil is exposed to these plants for a much longer period of time and the root systems of the plants in the field are likely much larger.
Another possible explanation is that these results are caused by modifications of the biotic component of the environment that are not linked to the soil environment, as predicted by the Janzen-Connell hypothesis ([23], [24]). This could include the effects of specific pathogens or herbivores affecting aboveground plant organs, as was demonstrated in a range of studies in tropical rainforests (e.g., [47–49]). These studies suggest that possible differences in habitat requirements in different species are overwhelmed by the negative effects of accumulated path-ogens and herbivores on the individuals of a particular species, i.e., a mechanism close to the plant-soil feedback, but not necessarily restricted to organisms in the soil. We are, however, not aware of any study demonstrating similar effects in temperate grassland systems. Neither are we aware of any specific pathogens or herbivores strongly affecting the aboveground parts of the plants in our system.
transplant plots, as the roots extend further than the aboveground biomass and all of the domi-nant species are largely clonal [56]. However, we did not find any evidence that the plants would survive or grow more poorly in the case of higher conspecific density in the surround-ings in the transplant experiment. The only conspecific effect in the transplant experiment was the positive effect ofA.ramosumdensity in the surroundings on the biomass of transplanted
A.ramosum. In contrast, the cover of conspecific plants in the area of the sowing experiment
before the vegetation was disturbed and the sowing experiment was established, had a negative effect on the number of seedlings in three out of the four species studied. This is in line with the expectations based on negative intraspecific plant-soil feedback. While most studies on plant-soil feedback explore the effects of feedback on plant biomass, our recent study demon-strated that plant-soil feedback may be equally important in seed germination and seedling establishment [57].
Negative plant-soil feedback is commonly considered to be an important mechanism con-tributing to plant species coexistence, and thus increases the diversity of plant communities (e.g. [41], [58]). Several authors (e.g., [29], [59–61]) demonstrated that negative feedback is especially strong in rare species, while abundant species maintain their abundance thanks to feedbacks that are neutral or positive. In this context, the finding of possible negative feedbacks in the dominant species was not an expected result. If the dominants are truly experiencing negative plant-soil feedbacks, they should over time be replaced by other species and lose their dominant position. We do not have any direct long term data that would allow us to support or reject this expectation. However, our personal observation of the localities over the last 15 years does not indicate any strong shifts in species dominance.
The absence of any relationship between the intensity of intraspecific negative plant-soil feedback and species dominance was also demonstrated in several previous studies (e.g., [62–
64]). In addition, van der Putten et al. [65] and Olff et al. [66] demonstrated that dominant spe-cies may, in fact, also experience strong intraspecific negative plant-soil feedback. However, in these systems, dominant replacement was observed as a result of the negative feedback, while no such dominant replacement is known in our system.
This controversy, i.e., stable dominance of the species in our system in spite of expected strong negative feedbacks, can have two non-exclusive explanations. First, it may be related to the fact that all four dominant species grow clonally [56] and the establishment and growth of new vegetative ramets may be much less sensitive to the effects of negative soil-feedback than the establishment of new genetic individuals. Alternatively, the plants may experience negative soil feedback, but the dynamics of the system occur very slowly and possible changes are there-fore not visible over the course of a decade in these long-lived plants. This explanation is sup-ported by the fact that previous studies from the same and in similar systems demonstrated that plants respond more strongly to past landscape structure than to the landscape structure at present ([33], [35], [67]).
would actually lead to their replacement by other species. To further elucidate the issue, field competition experiments and field experiments using sterilized soil to eliminate the soil organ-isms would be helpful to test the competitive hierarchy between the species under different conditions and to identify the importance of soil biota for species performance and interac-tions. Finally, because our results indicate that the plant-soil feedback in our system is at least partly driven by changes in nutrient content of the soil, nutrient addition experiments should be used to test whether the negative plant-soil feedback can be caused by nutrient depletion by the dominant or if the changes in soil biota are more important.
Supporting Information
S1 Table. Primary data showing number of seedlings in the field experiment. (DOCX)
S2 Table. Primary data showing plant biomass and survival in the field experiment. (DOCX)
S3 Table. Primary data showing the results of the feedback experiment. (DOCX)
Acknowledgments
We thank to A. El-khouli, Ahmed, O. Beran, H. Kebrtová, M. Knapp, D. Parysová, and J. Popelka for their help during the field work and to I. Chmelařová, I. Jarošincová and V.
Oli-vová for technical assistance with feedback experiment and POPEKOL discussion group and two anonymous reviewers for helpful comments on the manuscript.
Author Contributions
Conceived and designed the experiments: LH JK ZM. Performed the experiments: LH JK. Ana-lyzed the data: ZM. Contributed reagents/materials/analysis tools: ZM. Wrote the paper: ZM JK LH.
References
1. Burrows MT, Schoeman DS, Richardson AJ, Molinos JG, Hoffmann A, Buckley LB, et al. Geographical limits to species-range shifts are suggested by climate velocity. Nature. 2014; 507(7493):492–+. doi:
10.1038/nature12976WOS:000333402000039. PMID:24509712
2. Caughlin TT, Ferguson JM, Lichstein JW, Bunyavejchewin S, Levey DJ. The importance of long-dis-tance seed dispersal for the demography and distribution of a canopy tree species. Ecology. 2014; 95 (4):952–62. doi:10.1890/13-0580.1WOS:000334573600015. PMID:24933814
3. Volkov I, Banavar JR, He FL, Hubbell SP, Maritan A. Density dependence explains tree species abun-dance and diversity in tropical forests. Nature. 2005; 438(7068):658–61. doi:10.1038/nature04030
WOS:000233593100048. PMID:16319890
4. Kawecki TJ, Ebert D. Conceptual issues in local adaptation. Ecology Letters. 2004; 7(12):1225–41. doi:
10.1111/j.1461-0248.2004.00684.xWOS:000225078000013.
5. Andersen KM, Turner BL, Dalling JW. Seedling performance trade-offs influencing habitat filtering along a soil nutrient gradient in a tropical forest. Ecology. 2014; 95(12):3399–413.
WOS:000346851400017.
6. Fine PVA, Mesones I, Coley PD. Herbivores promote habitat specialization by trees in amazonian for-ests. Science. 2004; 305(5684):663–5. doi:10.1126/science.1098982WOS:000222992100046.
PMID:15286371
7. Fine PVA, Miller ZJ, Mesones I, Irazuzta S, Appel HM, Stevens MHH, et al. The growth-defense trade-off and habitat specialization by plants in Amazonian forests. Ecology. 2006; 87(7):S150–S62.
8. Palmiotto PA, Davies SJ, Vogt KA, Ashton MS, Vogt DJ, Ashton PS. Soil-related habitat specialization in dipterocarp rain forest tree species in Borneo. Journal of Ecology. 2004; 92(4):609–23. doi:10.1111/
j.0022-0477.2004.00894.xWOS:000222869400006.
9. Baltzer JL, Thomas SC, Nilus R, Burslem D. Edaphic specialization in tropical trees: Physiological cor-relates and responses to reciprocal transplantation. Ecology. 2005; 86(11):3063–77. doi:
10.1890/04-0598WOS:000233419600022.
10. Stropp J, van der Sleen P, Quesada CA, ter Steege H. Herbivory and habitat association of tree seed-lings in lowland evergreen rainforest on white-sand and terra-firme in the upper Rio Negro. Plant Ecol-ogy & Diversity. 2014; 7(1–2):255–65. doi:10.1080/17550874.2013.773103WOS:000336082900018. 11. Ibanez I, McCarthy-Neumann S. Integrated assessment of the direct and indirect effects of resource
gradients on tree species recruitment. Ecology. 2014; 95(2):364–75. doi:10.1890/13-0685.1
WOS:000331429500011. PMID:24669730
12. Albrecht MA, McCarthy BC. Seedling establishment shapes the distribution of shade-adapted forest herbs across a topographical moisture gradient. Journal of Ecology. 2009; 97(5):1037–49. doi:10.
1111/j.1365-2745.2009.01527.xWOS:000268928200022.
13. Münzbergová Z. Effect of spatial scale on factors limiting species distributions in dry grassland frag-ments. J Ecol. 2004; 92(5):854–67. ISI:000223906500013.
14. Ehrlén J, Münzbergová Z, Diekmann M, Eriksson O. Long-term assessment of seed limitation in plants: results from an 11-year experiment. J Ecol. 2006; 94(6):1224–32. ISI:000240920400017.
15. Moore KA, Elmendorf SC. Propagule vs. niche limitation: untangling the mechanisms behind plant spe-cies' distributions. Ecology Letters. 2006; 9(7):797–804. doi:10.1111/j.1461-0248.2006.00923.xPMID:
16796569
16. Seifert B, Fischer M. Experimental establishment of a declining dry-grassland flagship species in rela-tion to seed origin and target environment. Biological Conservarela-tion. 2010; 143(5):1202–11. doi:10.
1016/j.biocon.2010.02.028
17. Harrison S, Cornell H, Moore KA. Spatial niches and coexistence: testing theory with tarweeds. Ecol-ogy. 2010; 91(7):2141–50. doi:10.1890/09-0742.1PMID:20715636
18. Dullinger S, Hulber K. Experimental Evaluation of Seed Limitation in Alpine Snowbed Plants. Plos One. 2011; 6(6). doi:10.1371/journal.pone.0021537
19. Hemrová L, Münzbergová Z. Identification of suitable unoccupied habitats: direct versus an indirect approach. Preslia. 2012; 84(4):925–37. WOS:000313145000004.
20. Knappová J, Knapp M, Münzbergová Z. Spatio-temporal variation in contrasting effects of resident veg-etation on establishment, growth and reproduction of dry grassland plants: implications for seed addi-tion experiments. PLoS ONE. 2013; 8(6):e65879. doi:10.1371/journal.pone.0065879PMID:23755288
21. Münzbergová Z, Herben T. Seed, dispersal, microsite, habitat and recruitment limitation: identification of terms and concepts in studies of limitations. Oecologia. 2005; 145(1):1–8. ISI:000231779500001.
PMID:16028092
22. Vítová A, LepšJ. Experimental assessment of dispersal and habitat limitation in an oligotrophic wet
meadow. Plant Ecol. 2011; 212(8):1231–42. WOS:000292820600001.
23. Janzen DH. Herbivores and the number of tree species in tropical forests. American Naturalist. 1970; 104(940):501–28. doi:10.1086/282687WOS:A1970I416100001.
24. Connell JH. On the role of natural enemies in preventing competitive exclusion in some marine animals and in rain forest trees. In: den Boer PJ, Gradwell GR, editors. Dynamics of populations. Oosterbeek, Netherlands: Centre for agricultural publishing and documentation.; 1970. p. 14.
25. Packer A, Clay K. Soil pathogens and spatial patterns of seedling mortality in a temperate tree. Nature. 2000; 404(6775):278–81. doi:10.1038/35005072WOS:000086022200047. PMID:10749209 26. Johnson DJ, Beaulieu WT, Bever JD, Clay K. Conspecific Negative Density Dependence and Forest
Diversity. Science. 2012; 336(6083):904–7. doi:10.1126/science.1220269WOS:000304145600062.
PMID:22605774
27. Johnson DJ, Bourg NA, Howe R, McShea WJ, Wolf A, Clay K. Conspecific negative density-dependent mortality and the structure of temperate forests. Ecology. 2014; 95(9):2493–503.
WOS:000342340200012.
28. Petermann JS, Fergus AJF, Turnbull LA, Schmid B. Janzen-Connell effects are widespread and strong enough to maintain diversity in grasslands. Ecology. 2008; 89(9):2399–406. doi:10.1890/07-2056.1
WOS:000259259300005. PMID:18831160
29. Mangan SA, Schnitzer SA, Herre EA, Mack KML, Valencia MC, Sanchez EI, et al. Negative plant-soil feedback predicts tree-species relative abundance in a tropical forest. Nature. 2010; 466(7307):752–
30. Brinkman EP, Van der Putten WH, Bakker EJ, Verhoeven KJF. Plant-soil feedback: experimental approaches, statistical analyses and ecological interpretations. Journal of Ecology. 2010; 98(5):1063–
73. doi:10.1111/j.1365-2745.2010.01695.xWOS:000280667200009.
31. van der Putten WH, Bardgett RD, Bever JD, Bezemer TM, Casper BB, Fukami T, et al. Plant-soil feed-backs: the past, the present and future challenges. Journal of Ecology. 2013; 101(2):265–76. doi:10.
1111/1365-2745.12054WOS:000317923300001.
32. Bardgett RD, Wardle DA. Aboveground-Belowground Linkages: Biotic Interactions, Ecosystem Pro-cesses, and Global Changes: Oxford University Press; 2010.
33. Chýlová T, Münzbergová Z. Past land use co-determines the present distribution of dry grassland plant species. Preslia. 2008; 80(2):183–98. ISI:000258002600003.
34. Tutin TG, Heywood VH, Burges NA, Moore DM, Valentine DH, Walter SM, et al. Flora Europaea. Cam-bridge: Cambridge University Press; 2001. p. 2392.
35. Hemrová L, Münzbergová Z. The effects of plant traits on species' responses to present and historical patch configurations and patch age. Oikos. 2015; 124(4):437–45. doi:10.1111/oik.01130
WOS:000352240500007.
36. Fridley JD, Vandermast DB, Kuppinger DM, Manthey M, Peet RK. Co-occurrence based assessment of habitat generalists and specialists: a new approach for the measurement of niche width. Journal of Ecology. 2007; 95(4):707–22. doi:10.1111/j.1365-2745.2007.01236.xWOS:000247320100014. 37. Knappová J, Münzbergová Z. Low seed pressure and competition from resident vegetation restricts dry
grassland specialists to edges of abandoned fields. Agriculture Ecosystems and Environment. 2015; 200:200–207
38. Pánková H, Münzbergová Z, Rydlová J, Vosátka M. Differences in AM fungal root colonization between populations of perennial Aster species have genetic reasons. Oecologia. 2008; 157(2):211–20.
ISI:000257956000003. doi:10.1007/s00442-008-1064-4PMID:18523810
39. Münzbergová Z. Determinants of species rarity: Population growth rates of species sharing the same habitat. Am J Bot. 2005; 92(12):1987–94. WOS:000233761700008. doi:10.3732/ajb.92.12.1987
PMID:21646117
40. Munzbergova Z. Population dynamics of diploid and hexaploid populations of a perennial herb. Annals of Botany. 2007; 100(6):1259–70. doi:10.1093/aob/mcm204WOS:000250664200014. PMID:
17881342
41. Bever JD, Westover KM, Antonovics J. Incorporating the soil community into plant population dynam-ics: the utility of the feedback approach. Journal of Ecology. 1997; 85(5):561–73. doi:10.2307/2960528
WOS:A1997YB78800001.
42. Kulmatiski A, Beard KH, Stevens JR, Cobbold SM. Plant-soil feedbacks: a meta-analytical review. Ecology Letters. 2008; 11(9):980–92. doi:10.1111/j.1461-0248.2008.01209.x
WOS:000259263000010. PMID:18522641
43. LepšJ,Šmilauer P. Multivariate Analysis Ecological Data using CANOCO: Cambridge University
Press; 2003. 269 p.
44. ter Braak C,Šmilauer P. Canoco reference manual and users guide to Canoco forWindows: Software
for canonical community ordination (version 4). Ithaca: Microcomputer Power; 1998.
45. Černá L, Münzbergová Z. Conditions in Home and Transplant Soils Have Differential Effects on the Performance of Diploid and Allotetraploid Anthericum Species. Plos One. 2015; 10(1). doi:10.1371/ journal.pone.0116992WOS:000348205300046.
46. van Dam NM, Qiu BL, Hordijk CA, Vet LEM, Jansen JJ. Identification of Biologically Relevant Com-pounds in Aboveground and Belowground Induced Volatile Blends. Journal of Chemical Ecology. 2010; 36(9):1006–16. doi:10.1007/s10886-010-9844-9WOS:000281971400011. PMID:20737198 47. Bagchi R, Swinfield T, Gallery RE, Lewis OT, Gripenberg S, Narayan L, et al. Testing the
Janzen-Con-nell mechanism: pathogens cause overcompensating density dependence in a tropical tree. Ecology Letters. 2010; 13(10):1262–9. doi:10.1111/j.1461-0248.2010.01520.xWOS:000281895000007.
PMID:20718845
48. Wright SJ. Plant diversity in tropical forests: a review of mechanisms of species coexistence. Oecolo-gia. 2002; 130(1):1–14. doi:10.1007/s004420100809WOS:000173032500001.
49. Terborgh J. Enemies Maintain Hyperdiverse Tropical Forests. American Naturalist. 2012; 179(3):303–
14. doi:10.1086/664183WOS:000300454400002. PMID:22322219
50. Pacala SW, Silander JA. Field tests of neighborhood population dynamic models of 2 annual weedspe-cies. Ecological Monographs. 1990; 60(1):113–34. doi:10.2307/1943028WOS:A1990CP95700005. 51. Johansson ME, Keddy PA. Intensity and asymmetry of competition between plant pairs of different
degrees of similarity—an experimental-study on 2 guilds of wetland plants. Oikos. 1991; 60(1):27–34.
52. Hendry RJ, McGlade JM, Weiner J. A coupled map lattice model of the growth of plant monocultures. Ecological Modelling. 1996; 84(1–3):81–90. doi:10.1016/0304-3800(94)00128-6WOS:
A1996TP69300008.
53. Keddy PA. Competition. Plants and Vegetation: Origins, Processes, Consequences. 2007:186–224.
BCI:BCI201200024565.
54. Herben T, Brezina S, Skalova H, Hadincova V, Krahulec F. Variation in plant performance in a grass-land: Species-specific and neighbouring root mass effects. Journal of Vegetation Science. 2007; 18 (1):55–62. doi:10.1111/j.1654-1103.2007.tb02515.xWOS:000245427300007.
55. Aguiar MR, Lauenroth WK, Peters DP. Intensity of intra- and interspecific competition in coexisting shortgrass species. Journal of Ecology. 2001; 89(1):40–7. doi:10.1046/j.1365-2745.2001.00523.x
WOS:000168273200005.
56. Klimesova J, de Bello F. CLO-PLA: the database of clonal and bud bank traits of Central European flora. Journal of Vegetation Science. 2009; 20(3):511–6. doi:10.1111/j.1654-1103.2009.01050.x
WOS:000266244100013.
57. Münzbergová Z,Šurinová M. The importance of species phylogenetic relationships andspecies traits for the intensity of plant-soil feedback. Ecosphere. 2015; 6(11). doi:10.1890/ES15-00206.1
58. Bever JD. Soil community feedback and the coexistence of competitors: conceptual frameworks and empirical tests. New Phytologist. 2003; 157(3):465–73. doi:10.1046/j.1469-8137.2003.00714.x
WOS:000181333500006.
59. Klironomos JN. Feedback with soil biota contributes to plant rarity and invasiveness in communities. Nature. 2002; 417(6884):67–70. doi:10.1038/417067aWOS:000175307200038. PMID:11986666 60. Anacker BL, Klironomos JN, Maherali H, Reinhart KO, Strauss SY. Phylogenetic conservatism in
plant-soil feedback and its implications for plant abundance. Ecology Letters. 2014; 17(12):1613–21. doi:10.
1111/ele.12378PMID:25328022
61. Heinze J, Bergmann J, Rillig MC, Joshi J. Negative biotic soil-effects enhance biodiversity by restricting potentially dominant plant species in grasslands. Perspectives in Plant Ecology Evolution and System-atics. 2015; 17(3):227–35. doi:10.1016/j.ppees.2015.03.002WOS:000355499000006.
62. MacDougall AS, Rillig MC, Klironomos JN. Weak conspecific feedbacks and exotic dominance in a species-rich savannah. Proceedings of the Royal Society B-Biological Sciences. 2011; 278 (1720):2939–45. doi:10.1098/rspb.2010.2730WOS:000294244900011.
63. Reinhart KO. The organization of plant communities: negative plant-soil feedbacks and semiarid grass-lands. Ecology. 2012; 93(11):2377–85. WOS:000310834900009. PMID:23236909
64. Speek TAA, Schaminee JHJ, Stam JM, Lotz LAP, Ozinga WA, van der Putten WH. SPECIAL ISSUE: The Role of Below-Ground Processes in Mediating Plant Invasions Local dominance of exotic plants declines with residence time: a role for plant-soil feedback? Aob Plants. 2015; 7:8.
WOS:000357417200002.
65. van der Putten WH, Vandijk C, Peters BAM. Plant-specific soil-borne diseases contribute to succession in foredune vegetation. Nature. 1993; 362(6415):53–6. WOS:A1993KP97600057.
66. Olff H, Hoorens B, de Goede RGM, van der Putten WH, Gleichman JM. Small-scale shifting mosaics of two dominant grassland species: the possible role of soil-borne pathogens. Oecologia. 2000; 125 (1):45–54. doi:10.1007/pl00008890WOS:000090013100006.