Hematopoietic Stem Cells
Shunsuke Nakamura1,4, Motohiko Oshima1,4, Jin Yuan1,4, Atsunori Saraya1,4, Satoru Miyagi1,4,
Takaaki Konuma1, Satoshi Yamazaki2,5, Mitsujiro Osawa1,4, Hiromitsu Nakauchi2,5, Haruhiko Koseki3,4, Atsushi Iwama1,4*
1Department of Cellular and Molecular Medicine, Graduate School of Medicine, Chiba University, Chiba, Japan,2Division of Stem Cell Therapy, Center for Stem Cell Biology and Regenerative Medicine, Institute of Medical Science, University of Tokyo, Tokyo, Japan,3RIKEN Research Center for Allergy and Immunology, Yokohama, Japan,4Japan Science and Technology Agency (JST), CREST, Tokyo, Japan,5ERATO, Chiyoda-ku, Tokyo, Japan
Abstract
Background:The polycomb-group (PcG) proteins function as general regulators of stem cells. We previously reported that retrovirus-mediated overexpression ofBmi1, a gene encoding a core component of polycomb repressive complex (PRC) 1, maintained self-renewing hematopoietic stem cells (HSCs) during long-term culture. However, the effects of overexpression ofBmi1on HSCsin vivoremained to be precisely addressed.
Methodology/Principal findings:In this study, we generated a mouse line whereBmi1can be conditionally overexpressed under the control of the endogenousRosa26promoter in a hematopoietic cell-specific fashion (Tie2-Cre;R26StopFLBmi1). Although overexpression of Bmi1 did not significantly affect steady state hematopoiesis, it promoted expansion of functional HSCs during ex vivoculture and efficiently protected HSCs against loss of self-renewal capacity during serial transplantation. Overexpression ofBmi1had no effect on DNA damage response triggered by ionizing radiation. In contrast, Tie2-Cre;R26StopFLBmi1HSCs under oxidative stress maintained a multipotent state and generally tolerated oxidative stress better than the control. Unexpectedly, overexpression ofBmi1had no impact on the level of intracellular reactive oxygen species (ROS).
Conclusions/Significance:Our findings demonstrate that overexpression ofBmi1confers resistance to stresses, particularly oxidative stress, onto HSCs. This thereby enhances their regenerative capacity and suggests that Bmi1 is located downstream of ROS signaling and negatively regulated by it.
Citation:Nakamura S, Oshima M, Yuan J, Saraya A, Miyagi S, et al. (2012) Bmi1 Confers Resistance to Oxidative Stress on Hematopoietic Stem Cells. PLoS ONE 7(5): e36209. doi:10.1371/journal.pone.0036209
Editor:Kevin D. Bunting, Emory University, United States of America
ReceivedDecember 30, 2011;AcceptedMarch 28, 2012;PublishedMay 11, 2012
Copyright:ß2012 Nakamura et al. This is an open-access article distributed under the terms of the Creative Commons Attribution License, which permits unrestricted use, distribution, and reproduction in any medium, provided the original author and source are credited.
Funding:This work was supported in part by MEXT KAKENHI and the Global COE Program (Global Center for Education and Research in Immune System Regulation and Treatment), MEXT, Japan, a grant for Core Research for Evolutional Science and Technology (CREST) from the Japan Science and Technology Corporation (JST), a grant from the Tokyo Biochemical Research Foundation, and a grant from Astellas Foundation for Research on Metabolic Disorders. No additional external funding was received for this study. The funders had no role in study design, data collection and analysis, decision to publish, or preparation of the manuscript.
Competing Interests:The authors have declared that no competing interests exist.
* E-mail: [email protected]
Introduction
Hematopoietic stem cells (HSCs) are defined as primitive cells that are capable of both self-renewal and differentiation into any of the hematopoietic cell lineages. Cell fate decisions of HSCs (self-renewal vs. differentiation) are precisely regulated to maintain their numbers and lifespan. Defects in these processes lead to hematopoietic insufficiencies and to the development of hemato-poietic malignancies.
The polycomb-group (PcG) proteins play key roles in the initiation and maintenance of gene silencing through histone modifications. PcG proteins belong to two major complexes, Polycomb repressive complex 1 and 2 (PRC1 and PRC2). PRC1 monoubiquitylates histone H2A at lysine 119 and PRC2 trimethylates histone H3 at lysine 27 [1]. Of note, PcG proteins have been implicated in the maintenance of self-renewing stem cells [2–4]. Among PcG proteins, Bmi1, a core component of
PRC1, plays an essential role in the maintenance of self-renewal ability of HSCs at least partially by silencing theInk4a/Arflocus [5–8]. Bmi1 also maintains multipotency of HSCs by keeping developmental regulator gene promoters poised for activation [9]. Furthermore, Bmi1 has been implicated in the maintenance of the proliferative capacity of leukemic stem cells [5]. Consistent with these findings, levels of BMI1 expression in the human CD34+
cell fraction have been reported to correlate well with the progression and prognosis of myelodysplastic syndrome and chronic and acute myeloid leukemia [4,10], suggesting a role of BMI1 in leukemic stem cells.
We previously reported that overexpression of Bmi1 using a retrovirus maintains self-renewal capacity of HSCs and markedly expands multipotent progenitorsex vivo, resulting in an enhance-ment of repopulating capacity of HSCs after culture. Likewise, forced expression ofBMI1was demonstrated to promote leukemic transformation of human CD34+
However, the effects of overexpression ofBmi1on hematopoiesis remained to be precisely addressed.
In this study, we generated mice overexpressing Bmi1 in a hematopoietic cell-specific manner. We analyzed the effects of overexpression of Bmi1 on hematopoiesis under steady state conditions as well as under multiple stresses. Our findings revealed a protective function for Bmi1 in HSCs from stresses, such as ROS, that usually limit the lifespan of HSCs.
Results
Generation of Mice OverexpressingBmi1in Hematopoietic Cells
To generate tissue-specificBmi1-transgenic mice, we knocked a
loxP-flankedneor
-stop cassette followed by Flag-taggedBmi1, anfrt -flanked IRES-eGFP cassette, and a bovine polyadenylation sequence into theRosa26locus (Figure 1A). The obtained mice (hereafter referred to asR26StopFLBmi1) were crossed withTie2-Cre
mice [12] to driveBmi1expression in a hematopoietic cell-specific manner. Quantitative RT-PCR analysis of bone marrow (BM) Lineage marker-Sca-1+
c-Kit+
(LSK) cells confirmed 6-fold over-expression of Bmi1 inTie2-Cre;R26StopFLBmi1 mice compared to theTie2-Crecontrol mice (Figure 1B). Western blot analysis also verified overexpression of Bmi1 protein in BM c-Kit+progenitor cells fromTie2-Cre;R26StopFLBmi1mice (Figure 1C).
Steady State Hematopoiesis inTie2-Cre;R26StopFLBmi1
Mice
We first investigated the effect of overexpression ofBmi1 on hematopoiesis in a steady state. Unexpectedly, 10-week-old Tie2-Cre;R26StopFLBmi1mice did not exhibit any significant differences in the numbers of total BM cells, CD34-LSK HSCs, LSK cells, multipotent progenitors (MPPs), common myeloid progenitors (CMPs), granulocyte/macrophage progenitors (GMPs), megakar-yocyte/erythroid progenitors (MEPs), or common lymphoid progenitors (CLPs) compared to the Tie2-Cre control mice (Figure 1DandFigure S1A). The number of white blood cells (WBC) in peripheral blood (PB) did not change upon forced expression of Bmi1. Only the proportion of PB Gr-1+
/Mac-1+ myeloid cells in Tie2-Cre;R26StopFLBmi1
mice was significantly higher than in the control mice, although the difference was not drastic (a difference of only about 2%) (Figure 1D). Furthermore,
Tie2-Cre;R26StopFLBmi1mice did not show any significant differ-ences in the numbers of total spleen cells, LSK cells in the spleen, total thymic cells, or CD4+
CD8-, CD4-CD8+
, or CD4+ CD8+
cells in the thymus compared to the control mice (Figure S1A). These findings indicate that overexpression of Bmi1 does not largely compromise differentiation of HSCs. We further analyzed the cell cycle status of CD34-LSK HSCs by Pyronin Y staining, but again did not detect any changes (Figure S1B). These results indicate that overexpression ofBmi1 only slightly perturbs hematopoiesis under steady state conditions, suggesting that the level of endogenous Bmi1 is sufficient to repress the transcription of its target genes.
Colony-forming Capacity of Hematopoietic Stem and Progenitor Cells OverexpressingBmi1
We next evaluated the proliferative and differentiation capacity ofTie2-Cre;R26StopFLBmi1HSCsin vitro. Single CD34-LSK HSCs were clonally sorted into 96-microtiter plates with the medium supplemented with stem cell factor (SCF), thrombopoietin (TPO), interleukin-3 (IL-3), and erythropoietin (EPO) and allowed to form colonies. At day 14 of culture, the colonies were counted and
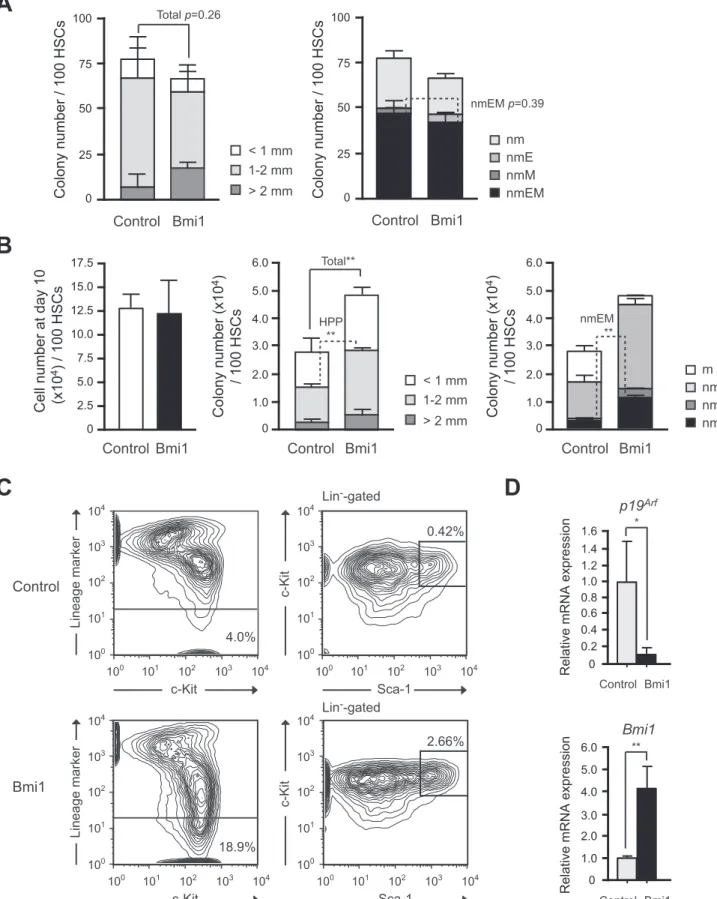
individually collected for morphological examination. Both Tie2-Cre control and Tie2-Cre;R26StopFLBmi1 HSCs gave rise to comparable numbers of high proliferative potential (HPP) and low proliferative potential (LPP) colonies with a diameter greater than and less than 1 mm, respectively (Figure 2A). The morphological analysis of colonies revealed that the number of colony-forming unit (CFU)-neutrophil/macrophage/erythroblast/ megakaryocyte (nmEM) was also comparable between the two groups (Figure 2A). CFU-nmEM is a major subpopulation among CD342LSK HSCs and its frequency is well correlated with that of functional HSCs [13]. These findings indicate that overexpression ofBmi1in freshly isolated CD34-LSK HSCs does not affect their colony-forming capacity or differentiationin vitro.
We previously reported that overexpression of Bmi1 by retroviral transduction efficiently maintains hematopoietic stem and progenitor cells during long-term culture [7]. We re-evaluated the effect of forced expression of Bmi1 using Tie2-Cre;R26-StopFLBmi1
HSCs. CD34-LSK cells were cultured for 10 days in a serum-free medium supplemented with SCF and TPO, a cytokine combination which supports the proliferation of HSCs and progenitors rather than their differentiation [14]. Although
Tie2-Cre;R26StopFLBmi1HSCs did not show any growth advantage over the control (Figure 2B), the Tie2-Cre;R26StopFLBmi1 HSC culture contained significantly more HPP-colony-forming cells (CFCs) and CFU-nmEM than the control (Figure 2B). Corre-spondingly, flow cytometric analysis revealed more LSK cells in the Tie2-Cre;R26StopFLBmi1 HSC culture than in the control culture at day 14 (Figure 2C). There was no significant difference in the frequency of apoptotic cells between the control and Tie2-Cre;R26StopFLBmi1HSC cultures (Figure S2A). Of note, however, theTie2-Cre;R26StopFLBmi1HSC culture contained a significantly higher proportion of LSK cells in the G0/G1stage of cell cycle than the control (Figure S2B). These findings suggest that overexpression of Bmi1 slows down cell cycle of immature hematopoietic cells in culture, leading to no growth advantages over the control cells in spite of an increase in immature progenitors in culture. As we reported previously, theInk4a/Arf
locus is a critical target of Bmi1 in HSCs [8]. Quantitative RT-PCR confirmed thatp19Arfwas closely repressed in transcription uponBmi1overexpression (Figure 2D). These results support our previous finding that HSCs overexpressingBmi1retain their self-renewal capacity better than the control HSCs under the culture stress.
Overexpression ofBmi1Enhances Expansion of HSCsex vivoand Protects HSCs During Serial Transplantation
HSCs are exposed to various stresses including replicative and oxidative stresses during serial transplantation and eventually lose self-renewal capacity [16,17]. We hypothesized that the effects of
overexpression ofBmi1 on HSCs would manifest under stressful conditions such as serial transplantations. Therefore, we per-formed competitive repopulation assays using 56105 fresh BM Figure 1. Generation of mice overexpressingBmi1in hematopoietic cells.(A) Strategy for making a knock-in allele forBmi1downstream of theRosa26promoter. AloxP-flankedneor
-stop cassette followed by Flag-taggedBmi1, anfrt-flankedIRES-eGFPcassette, and a bovine polyadenylation
sequence was knocked-in theRosa26locus. (B) Quantitative RT-PCR analysis ofBmi1in BM LSK cells fromTie2-CreandTie2-Cre;R26StopFLBmi1mice.
mRNA levels were normalized toHprt1expression. Expression levels relative to that inTie2-CreLSK cells are shown as the mean6S.D. (n = 3). (C)
Western blotting analysis of Bmi1 in c-Kit+BM cells fromTie2-CreandTie2-Cre;R26StopFL
Bmi1mice.a-tubulin was used as the loading control. (D)
Hematopoietic analysis of 10-week-oldTie2-CreandTie2-Cre;R26StopFLBmi1
mice. Absolute numbers of BM cells, CD34-LSK cells, and LSK cells in
bilateral femurs and tibiae are presented as the mean6S.D. (upper panels,Tie2-Cre; n = 7,Tie2-Cre;R26StopFLBmi1; n = 8). PB analysis of 10-week-old
Tie2-CreandTie2-Cre;R26StopFLBmi1mice. White blood cell (WBC) counts and lineage contribution of myeloid, B, and T cells are shown as the mean6
S.D. (lower panels,Tie2-Cre; n = 7,Tie2-Cre;R26StopFLBmi1
; n = 8). **p,0.01.
nmEM nmM nmE nm
A
> 2 mm < 1 mm 1-2 mm
B
Cell number at day 10 (x10
4)
/ 100 HSCs
Colony number / 100 HSCs 0 50 75 100
25
0 2.5 5.0 7.5 10.0 12.5 15.0 17.5
nmEM nmE nm m
> 2 mm < 1 mm 1-2 mm
Colony number
(x10
4)
/ 100 HSCs
0 3.0 4.0 5.0 6.0
1.0 2.0
Total**
HPP ** Control Bmi1
Control Bmi1 Control Bmi1
Colony number / 100 HSCs 0 50 75 100
25
Control Bmi1
Colony number
(x10
4)
/ 100 HSCs
0 3.0 4.0 5.0 6.0
1.0 2.0
Control Bmi1
c-Kit
4.0%
0.42%
102 103 104
100
Lineage marker
101 102
103 104
100 101
c-Kit 10
2 103 104
100 101
Sca-1
102 103 104
100 101
18.9%
2.66%
c-Kit
102 103 104
100
Lineage marker
101 102
103 104
100 101
c-Kit 10
2 103 104
100 101
Sca-1
102 103 104
100 101
C
D
nmEM **
Control
Bmi1
0 0.2 0.4 0.6 0.8 1.2 1.4 1.6
Relative mRNA expression
0 2.0 4.0 6.0
Relative mRNA expression
Control Bmi1
Control Bmi1
p19Arf
Bmi1 1.0
1.0 3.0 5.0
Total p=0.26
nmEM p=0.39
Lin--gated
Lin--gated
** *
Figure 2. Effects of overexpression of Bmi1 on HSCsin vitro.(A) Colony formation by HSCs isolated from Tie2-Cre(Control) and Tie2-Cre;R26StopFLBmi1(Bmi1) mice. Single CD34-LSK cells were sorted into 96-well microtiter plates containing the SF-O3 medium supplemented with
10% FBS and multiple cytokines (10 ng/ml SCF, 10 ng/ml TPO, 10 ng/ml IL-3, and 3 u/ml EPO) and allowed to form colonies. At day 14 of culture, the colonies were counted and individually collected for morphological examination. Absolute numbers of LPP and HPP-CFCs which gave rise to colonies
cells along with 56105competitor BM cells (Figure 4A) or the
total cells produced from 20 CD34-LSK cells after a 10-day culture period along with 26105competitor BM cells (Figure 4B).
The flow cytometric analysis of PB revealed little or no difference in the chimerism of donor cells between Tie2-Cre and Tie2-Cre;R26StopFLBmi1 cells at 12 weeks after the primary transplan-tations. However, in the secondary and tertiary transplantations, the chimerism ofTie2-Crecells significantly declined while that of
Tie2-Cre;R26StopFLBmi1 cells drasticaly increased. Tie2-Cre cells
after 10-day culture failed to reconstitute hematopoiesis in the quaternary transplantation, whileTie2-Cre;R26StopFLBmi1cells still established robust repopulation (Figure 4B). The chimerism of donor cells in BM LSK cells mirrored the changes in the PB. These results clearly indicate that overexpression ofBmi1protects HSCs against the loss of self-renewal capacity during serial transplantation. The findings thus far suggest that overexpression ofBmi1confers stress resistance onto HSCs.
colony types were defined by the composition of colonies (right panel). Colonies were recovered and examined by microscopy to determine colony types. Composition of colonies is depicted as n, neutrophils; m, macrophages; E, erythroblasts; and M, megakaryocytes. (B) Colony formation by HSCs
cultured for 10 days. CD34-LSK cells fromTie2-Cre(Control) andTie2-Cre;R26StopFLBmi1(Bmi1) mice were cultured in the SF-O3 serum-free medium
supplemented with 50 ng/ml of SCF and TPO. At day 10 of culture, the cells were counted (left panel) and plated in methylcellulose medium to allow formation of colonies in the presence of 20 ng/ml SCF, 20 ng/ml TPO, 20 ng/ml IL-3, and 3 u/ml EPO. Absolute numbers of LPP and HPP-CFCs
(middle panel) are shown as the mean6S.D. for triplicate cultures. Absolute numbers of each colony type are shown in the right panel. (C) Flow
cytometric analysis of CD34-LSK HSCs at day14 of culture. Representative flow cytometric profiles of LSK cells in cultures of CD34-LSK HSCs from
Tie2-Cre(Control) andTie2-Cre;R26StopFLBmi1
(Bmi1) mice are depicted. The proportion of Lin-and LSK cells in total cells are indicated. (D) Quantitative
RT-PCR analysis of the expression ofp19Arf,andBmi1inTie2-Cre(Control) andTie2-Cre;R26StopFLBmi1(Bmi1) LSK cells. LSK cells were purified by cell
sorting from CD34-LSK cultures in (C) at day 14 of culture. Each value was normalized toHprt1expression and the expression level of each gene in
control cells was arbitrarily set to 1. Data are shown as the mean6S.D. for triplicate analyses. *p,0.05, **p,0.01.
doi:10.1371/journal.pone.0036209.g002
Number of CD34-LSK cells injected
1/14~1/5
1/13~1/5
1/3~1/1
1/2~1/1 Fresh control
Fresh Bmi1
Cultured control
Cultured Bmi1
1/7 4/7 3/8 7/10 10/10 9/9 1/2
0.5 1 1.5 2 5 10 20
5/7 6/7 8/8 8/10 9/10 10/10 1/1
1/10 6/10 6/10 5/5 1/8
1/9 4/10 7/10 6/6 1/8
95% CI Frequency
***
% of negative mice
Fresh control
Fresh Bmi1
cultured control
cultured Bmi1
10 37 100
Number of CD34-LSK cells
0 5 10 15 20
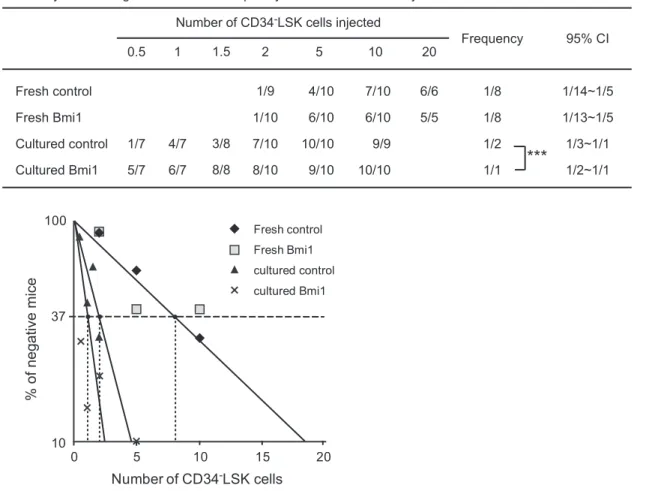
Summary of % of engrafted mice and frequency of HSCs in CRU assays
Figure 3. Overexpression ofBmi1enhances expansion of HSCsex vivo.Competitive repopulating unit (CRU) assays using limiting numbers
of CD34-LSK cells fromTie2-Cre(Control) mice andTie2-Cre;R26StopFLBmi1
(Bmi1) mice. Freshly isolated CD34-LSK cells were immediately used for BM
transplantation, or CD34-LSK cells were cultured in the SF-O3 serum-free medium supplemented with 50 ng/ml SCF and TPO for 10 days, and then a
fraction of the culture cells corresponding to the indicated number (0.5,10) of initial CD34-LSK cells was subjected to BM transplantation. The test
cells (CD45.2) were transplanted along with 26105competitor BM cells (CD45.1) into CD45.1 recipient mice lethally irradiated at a dose of 9.5 Gy.
Percent chimerism of donor cells in the recipient PB was determined at 16 weeks after transplantation. The mice with chimerism more than 1% in all three lineages (myeloid, B, and T cells) were considered successfully engrafted and the others were defined as negative mice. The frequency of HSCs was calculated using L-Calc software. The proportion of engrafted mice, frequency of functional HSCs, and the 95% confidence interval (CI) are
summarized in the table and each data is plotted in the bottom panel. ***p,0.001.
Overexpression of Bmi1has no Impact on Radioprotection
DNA damage is intimately linked to stem cell aging. Heritable DNA damage accrued in stem cells leads to stem cell senescence or apoptosis, which over time can lead to the depletion of the stem cell pool and reduced regenerative capacity of stem cells [18]. Bmi1 is rapidly recruited to sites of DNA damage and is required for DNA damage-induced ubiquitination of histone H2A at lysine 119. Loss of Bmi1 leads to impaired repair of DNA double-strand breaks (DSBs) by homologous recombination [19,20]. In glioblas-toma multiforme (GBM) cells, Bmi1 was co-purified with DSB response proteins, such as ATM and the histone cH2AX, and non-homologous end joining (NHEJ) repair proteins. Of interest, BMI1 overexpression in normal neural stem cells enhanced ATM recruitment to the chromatin, the rate ofcH2AX foci resolution, and resistance to radiation [21]. In order to understand the role of
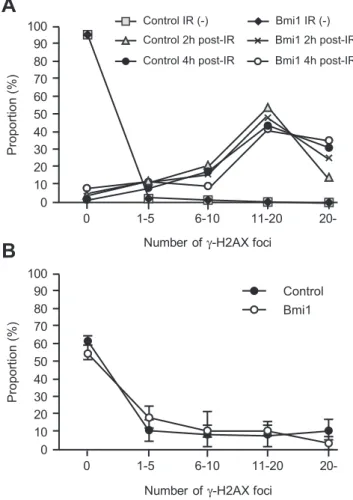
overexpressed Bmi1 in HSCs, we examined the radioresistance of HSCs by quantifying the number of cH2AX foci following genotoxic stress, a metric which reflects DNA DSBs.
We purified CD34-LSK cells fromTie2-Cre andTie2-Cre; R26-StopFLBmi1mice and irradiated them at a dose of 2 Gy. At 2 and 4 hours after irradiation, cells were stained with anti-cH2AX. We expected rapid resolution ofcH2AX by overexpression ofBmi1, but no significant difference was observed in the number of cH2AX foci betweenTie2-CreandTie2-Cre;R26StopFLBmi1HSCs (Figure 5A). HSCs recovered from the recipients of tertiary transplantation did not show any difference in the number of cH2AX foci, either (Figure 5B). We then tested hematopoietic recovery after irradiation in mice. We irradiated recipient mice reconstituted withTie2-Cre andTie2-Cre;R26StopFLBmi1 BM cells at a dose of 5 Gy, and monitored hematopoietic recovery for 4 weeks. The recovery of hematopoietic components in PB as well as
% of donor cells in PB
0 40 60 80 100
20
C B C B C B
*
*
1st 2nd 3rd
% of donor cells in LSK
0 40 60 80 100
20
C B C B
1st 3rd
**
**
% of donor cells in PB
0 40 60 80 100
20
C B C B C B
1st 2nd 3rd
% of donor cells in LSK
0 40 60 80 100
20
C B C B C B
1st 2nd 3rd
A
B
**
**
**
**
**
**
C B
4th
Serial transplantation: BM cells
Serial transplantation: cultured CD34
-LSK cells
Figure 4. Overexpression ofBmi1protects HSCs during serial transplantation.(A) Serial transplantation of BM cells. BM cells (56105) from Tie2-Cre (denoted as ‘‘C’’) and Tie2-Cre;R26StopFLBmi1
(denoted as ‘‘B’’) mice (CD45.2) along with 56105competitor BM cells (CD45.2) were
transplanted into CD45.1 recipient mice lethally irradiated at a dose of 9.5 Gy. For serial transplantation, BM cells were collected from all recipient
mice at 12–20 weeks after transplantation and pooled together. Then, 56106BM cells were transplanted into lethally irradiated recipient mice
without competitor cells. Third and fourth transplantation were similarly performed using 56106pooled BM cells. Percent chimerism of donor cells in
the recipient PB and BM LSK cells was determined at 16 weeks post-transplantation. Results are shown as the mean6S.D. (n = 6, 3rdtransplantation;
n = 4). (B) Serial transplantation of cultured CD34-LSK cells. CD34-LSK cells were cultured in the SF-O3 serum-free medium supplemented with 50 ng/
ml of SCF and TPO for 10 days. Then, the cells in culture corresponding to the 20 initial CD34-LSK cells were injected into a recipient mouse along
with 26105competitor BM cells (CD45.2) as described in (A) (n = 6, 4thtransplantation; n = 5). *P,0.05, **P,0.01.
BM LSK cells was comparable between the two groups (Figure S3). These findings suggest that overexpression ofBmi1does not afford an advantage to HSCs in their ability to resist genotoxic stress.
Overexpression of Bmi1Confers Resistance to Oxidative Stress on HSCs
HSCs contain lower levels of reactive oxygen species (ROS) than their mature progeny in order to maintain their quiescent state. ROS reportedly act through p38 mitogen-activated protein kinase (MAPK) to limit the lifespan of HSCs [16,22]. It has been demonstrated that prolonged treatment with the antioxidant N -acetyl-L-cysteine (NAC) or an inhibitor of p38 MAPK extends the lifespan of HSCs in serial transplantation assays, suggesting that oxidative stress is one of the major factors that affects HSC function during these assays [16,17,23]. Given that Tie2-Cre;R26-StopFLBmi1
HSCs retain self-renewal capacity during serial transplantation, overexpression ofBmi1 may bestow a protective effect onto HSCs against oxidative stress.
To address this question, we cultured HSCs in the presence of buthionine sulfoximine (BSO), which depletes intracellular gluta-thione and thereby increases intracellular ROS levels. We found that highly purified CD34-LSK HSCs were susceptible to an increase in ROS levels because treatment with BSO significantly suppressed their growth and induced cell death (data not shown). After 3 days of BSO treatment, surviving cells were subjected to colony-forming assays. Both Tie2-Cre control and Tie2-Cre;R26-StopFLBmi1 HSCs cultured with BSO gave rise to significantly fewer colonies than HSCs cultured without BSO. Interestingly,
Tie2-Cre;R26StopFLBmi1
HSCs gave rise to a significantly more colonies than the control HSCs (Figure 6A). Notably, the number of HPP colonies was reduced 48-fold after treatment of control HSCs with BSO, but only 3-fold upon overexpression ofBmi1. The frequency of CFU-nmEM was also less perturbed following treatment with BSO in HSCs overexpressingBmi1. These results indicate a role for Bmi1 in the resistance to oxidative stress.
Bmi1 regulates mitochondrial function by regulating the expression of a cohort of genes related to mitochondrial function and ROS generation. Bmi1-deficient cells have impaired mito-chondrial function, which causes a marked increase in the intracellular levels of ROS [24]. Based on these observations, we then measured the intracellular ROS levels in CD34-LSK cells at day 14 of culture. Unexpectedly, overexpression ofBmi1did not affect the levels of ROS in either LSK HSCs/MPPs or Lin- Sca-1low/2c-Kit+
downstream progenitors (Figure 6B). Overexpres-sion ofBmi1had no significant effect on the ROS levels even in the presence of BSO (Figure S4). Likewise, treatment of cells with the antioxidant NAC promoted cell growth and increased the proportion of LSK cells in both control and Tie2-Cre;R26-StopFLBmi1 culture similarly (Figure 6C and data not shown). These results indicate that an excess of Bmi1 does not regulate the generation or scavenging of ROS, but confers resistance to higher levels of ROS on HSCs through unknown mechanisms.
Discussion
In this study, we generated a new mouse line whereBmi1can be conditionally overexpressed in a hematopoietic cell-specific fashion and analyzed the effect of overexpression of Bmi1 in detail. Overexpression of Bmi1 did not significantly affect steady state hematopoiesis, but it efficiently protected HSCs from stresses. Our findings suggest that overexpression ofBmi1confers resistance to stresses on HSCs, thereby augmenting their regenerative capacity. Recent findings have established that the regulation of oxidative stress in HSCs is critical for the maintenance of HSCs. In this study, we demonstrated that overexpression of Bmi1 protects HSCs from loss of self-renewal capacity at least in part by increasing the capacity of HSCs to resist oxidative stress. It has been reported thatBmi1-deficient mice have an increased level of intracellular ROS due to de-regulated expression of genes related to mitochondrial function and ROS generation [24,25]. However, an excess of Bmi1 in this study had no effect on the levels of intracellular ROS. Thus, it is hypothesized that Bmi1 is negatively regulated downstream of the ROS signal and an excess of Bmi1 overcomes this negative regulation. Indeed, ROS reportedly primes Drosophila hematopoietic progenitors for differentiation and this process involves downregulation of PcG activity [26]. ROS signaling activates p38 and eventually releases the transcrip-tional repression of p16Ink4a and p19Arf, critical targets of Bmi1 [16]. Furthermore, recent studies including ours have revealed that PcG proteins are downregulated and dissociate from the
Ink4a/Arflocus when cells are exposed to intra- or extracellular stress, including tissue culture- and oncogene-induced stress
Proportion (%)
0 1-5 6-10 11-20
20-0 10 20 30 40 50 60 70 80 90 100
Number of γ-H2AX foci
Control IR (-) Bmi1 IR (-)
Control 2h post-IR Bmi1 2h post-IR
Control 4h post-IR Bmi1 4h post-IR
Proportion (%)
0 1-5 6-10 11-20
20-0 10 20 30 40 50 60 70 80 90 100
Number of γ-H2AX foci
Control Bmi1
A
B
Figure 5. DNA damage response of Tie2-Cre;R26StopFLBmi1 HSCs. (A) DNA damage response of CD34-LSK cells from Tie2-Cre
(Control) and Tie2-Cre;R26StopFLBmi1 (Bmi1) mice in vitro. Purified
CD34-LSK cells were irradiated (IR) at a dose of 2 Gy. At 2 and 4 hours
after irradiation, cells were stained with anti-cH2AX. Numbers ofcH2AX
foci expressed per cell are depicted. (B) DNA damage response of
CD34-LSK cells from Tie2-Cre (Control) and Tie2-Cre;R26StopFL
Bmi1
(Bmi1) mice in vivo. LSK cells were purified from the recipients of
tertiary transplantation and stained with anti-cH2AX. Numbers of
cH2AX foci expressed per cell are depicted as the mean6S.D. (n = 3).
nmEM nmM nmE nm
A
> 1 mm < 1 mm
B
Colony number / 100 HSCs
Colony number / 100 HSCs
C
Lin
-Sca-1
+c-Kit
+c-Kit
102 103 104 100
Lineage marker
101 102 10310
4
100 101
Sca-1
102 103 104 100 101
102 103 104 100 101 c-Kit
102 103 104 100 Lineage marker 101 102 103 104 100 101 c-Kit Sca-1
102 103 104 100 101
102 103 104 100 101 c-Kit
102 103 104 100 Lineage marker 101 102 103 104 100 101
102 103 104 100 101
102 103 104
100 101
102 103 104 100 Lineage marker 101 102 103 104 100 101 c-Kit
102 103 104 100 101
102 103 104 100 101 c-Kit
c-Kit Sca-1 c-Kit Sca-1
% of Max
0 20 40 60 80 100 0 20 40 60 80 100
Lin
-Sca-1
low/-c-Kit
+102 103 104
100 101 100 101 102 103 104
0.19
0.50
1.24
2.39
Tie2-Cre
; NAC(-)
Tie2-Cre;R26Stop
FLBmi1
; NAC(-)
Tie2-Cre
; 150
µ
M NAC
Tie2-Cre;R26Stop
FLBmi1
; 150
µ
M NAC
50 100 150 200 250 300 350 400 450 0 50 100 150 200 250 300 350 400 450 500 550 0
BSO
m+
-
-
+
Bmi1
Control
BSO
-
+
-
+
[27,28]. Together, this accumulating evidence suggests that Bmi1 is dynamically regulated in response to oxidative stress, probably downstream of p38. Our preliminary data demonstrated that activated p38 directly phosphorylates Bmi1 in vitro(Oshima and Iwama., unpublished data). Thus, it is possible that p38, which is activated by oxidative stress, attenuates Bmi1 function via direct phosphorylation of Bmi1. How oxidative stress restricts the expression and function of Bmi1 is an important issue to be addressed.
Of note, the effect of Bmi1 overexpression in serial transplan-tation resembles that of overexpression ofEzh2, a gene encoding a core component of PRC2 [29]. Overexpression of PcG genes,
Bmi1 and Scmh1, also induces tolerance of cortical neurons to ischemia [30]. Thus, various cellular stresses may target PcG complexes to release transcriptional repression of PcG-regulated genes, such as tumor suppressor and developmental regulator genes, thereby affecting stemness. All these findings support the notion that enforcement of PcG function is a key for successful regenerative therapies.
Meanwhile, the role of PcG proteins in resistance to oxidative stress is also implicated in cancer. Expression of PcG proteins including BMI1 and EZH2 are often up-regulated in various cancers, particularly in their cancer stem cell fractions [31]. Interestingly, cancer stem cells in some tumors appear to be susceptible to ROS, similar to normal stem cells, and thus develop mechanisms to keep the levels of ROS low [32]. Interference of EZH2 function by the small-molecule histone methyltransferases inhibitor, DZNep, is reported to increase ROS levels in acute myeloid leukemia cells like inBmi1-deficient mice [33]. Converse-ly, our findings in this study suggest that an excess of PcG proteins often observed in aggressive cancer could help cancer stem cells tolerate oxidative stress. In this regard, overexpression of PcG proteins could also be therapeutic targets in cancers including leukemia. Finally, no Tie2-Cre;R26StopFLBmi1 mice developed hematological malignancies during the observation period, up to 18 months after birth. Only one recipient mice with Tie2-Cre;R26StopFLBmi1
BM cells developed acute lymphocytic leuke-mia in the tertiary transplantation. These findings suggest that Bmi1 by itself is not sufficient to induce hematological malignan-cies.
Methods
Ethics Statement
All experiments using the mice were performed in accordance with our institutional guidelines for the use of laboratory animals and approved by the review board for animal experiments of Chiba University (approval ID: 21–150).
Generation of Mice
To generate tissue-specificBmi1-transgenic mice, we used the plasmidR26StopFL, a modified version of pROSA26-1 with aloxP -flankedneor-stop cassette, anfrt-flankedIRES-eGFPcassette, and a
bovine polyadenylation sequence [34]. We cloned a cDNA encoding a flag-tagged Bmi1 upstream of the IRES sequence (R26StopFLBmi1). R1 ES cells were transfected, cultured, and selected as previously described [35]. For conditional expression of
Bmi1, the RosaStopFLBmi1 mice were crossed withTie2-Cre mice. C57BL/6 (CD45.2) mice were purchased from Japan SLC (Shizuoka, Japan). C57BL/6 mice congenic for the Ly5 locus (CD45.1) were purchased from Sankyo-Lab Service (Tsukuba, Japan). Mice were bred and maintained in the Animal Research Facility of the Graduate School of Medicine, Chiba University in accordance with institutional guidelines. This study was approved by the institutional review committees of Chiba University (approval numbers 21–65 and 21–150).
Flow Cytometric Analysis and Cell Sorting
Mouse CD34–LSK HSCs were purified from BM of 8–12-week-old mice. Mononuclear cells were isolated on Ficoll-Paque PLUS (GE Healthcare). Cells were stained with an antibody cocktail consisting of biotinylated anti-Gr-1, Mac-1, interleukin (IL)-7Ra, B220, CD4, CD8a, and Ter119 monoclonal antibodies. The monoclonal antibodies were purchased from eBioScience or BioLegend. Lineage-positive cells were depleted with goat anti-rat IgG microbeads (Miltenyi Biotec) through an LS column (Miltenyi Biotec). Cells were further stained with Alexa FluorH 647 or eFluorH660-conjugated anti-CD34, phycoerythrin (PE)-conjugat-ed Sca-1, and phycoerythrin/Cy7 (PE/Cy7)-conjugat(PE)-conjugat-ed anti-c-Kit antibodies. Biotinylated antibodies were detected with allophycocyanin/Cy7 (APC/Cy7)-conjugated streptavidin. Dead cells were eliminated by staining with Propidium iodide (1mg/ml, Sigma). Analysis and sorting were performed on a FACS Aria II (BD Bioscience).
Cell Cycle Analysis
Fresh BM cells (16107, CD45.2) were transplanted into 8-week-old CD45.1 mice irradiated at a dose of 9.5 Gy without competitor cells. Four months later, BM mononuclear cells were isolated on Ficoll-Paque PLUS. Cells were stained with an antibody cocktail consisting of biotinylated anti-Gr-1, Mac-1, IL-7Ra, B220, CD4, CD8a, Ter119, and CD45.1 monoclonal antibodies. Cells were further stained with Alexa FluorH 700-conjugated anti-CD34, pacific blue-700-conjugated anti-Sca-1, and APC-conjugated anti-c-Kit antibodies. Biotinylated antibodies were detected with APC/Cy7-conjugated streptavidin. Analysis was performed on a FACS Aria II. To analyze the cell-cycle status, cells were incubated with 1mg/ml Pyronin Y (Sigma) at 37uC for
45 min with protection from light. Bulk sorted CD34-LSK cells were incubated in SF-O3 supplemented with 50m
M?2-b-mercap-toethanol, 0.2% BSA, 1% GPS, 50 ng/ml SCF, 50 ng/ml TPO for 10 days at 37uC in a 5% CO2 atmosphere. At day 10 of culture, the cell cycle profiles of culture cells were analyzed using an APC BrdU Flow Kit (BD Pharmingen). The cells were incubated with 10mM BrdU at 37uC for 30 min and then stained
with an antibody cocktail consisting of biotinylated anti-Gr-1, Figure 6. Overexpression of Bmi1 confers oxidative stress on HSCs.(A) Colony formation by HSCs cultured for 3 days. CD34-LSK cells from
Tie2-Cre(Control) andTie2-Cre;R26StopFLBmi1
(Bmi1) mice were cultured in the SF-O3 serum-free medium supplemented with 50 ng/ml SCF, TPO and 0.05 mM of BSO. At day 3 of culture, the cells were plated in methylcellulose medium to allow formation of colonies in the presence of 20 ng/ml SCF,
20 ng/ml TPO, 20 ng/ml IL-3, and 3 u/ml EPO. Absolute numbers of LPP and HPP-CFCs (left panel) are shown as the mean6S.D. for triplicate
cultures. Absolute numbers of each colony types are shown in the right panel. Data are shown as the mean6S.D. for triplicate analyses. Statistical
analyses were performed on the total colony numbers (left panel) and nmEM colony numbers (right panel), respectively. **p,0.01. (B) Levels of ROS
in cells overexpressingBmi1. CD34-LSK cells fromTie2-Cre(Control) andTie2-Cre;R26StopFL
Bmi1(Bmi1) mice were cultured in the SF-O3 serum-free
medium supplemented with 50 ng/ml SCF and TPO. Representative flow cytometric profiles of LSK and Lineage marker-Sca-1low/2c-Kit+
cells in
cultures at day 14 are depicted. (C) Effects of NAC onBmi1culture. CD34-LSK cells fromTie2-CreandTie2-Cre;R26StopFLBmi1
mice were cultured in the
SF-O3 serum-free medium supplemented with 50 ng/ml SCF and TPO in the presence and absence of 150mM NAC. Representative flow cytometric
profiles of LSK cells in cultures at day 14 are depicted. The proportion of Lin-and LSK cells in total cells are indicated.
Mac-1, IL-7Ra, B220, CD4, CD8a, and Ter119 monoclonal antibodies. Cells were further stained with PE-conjugated anti-Sca-1, and PE/Cy7-conjugated anti-c-Kit antibodies. Biotinylated antibodies were detected with APC/Cy7-conjugated streptavidin. Analysis was performed on a FACS Canto II (BD Bioscience).
Colony Assay
Colony assays were performed in methylcellulose-containing Iscove’s modified Dulbecco’s medium (Methocult M3234; Stem-cell Technologies) supplemented with 20 ng/ml mouse SCF, 20 ng/ml mouse IL-3, 20 ng/ml human TPO, and 3 U/ml human EPO (Peprotech), and incubated at 37uC in a 5% CO2 atmosphere. The number of HPP- and LPP-colony-forming cells (CFCs), which generate a colony with a diameter $1 mm and ,1 mm, respectively, were evaluated by counting colonies at day 10–14 of culture. Colonies were individually collected, cytospun onto glass slides, and subjected to Hemacolor (MERCK) staining for morphological examination. To evaluate the proliferative and differentiation capacity of Tie2-Cre;R26StopFLBmi1 HSCs in vitro, single CD34-LSK HSCs were clonally sorted into 96-microtiter plates containing 100ml SF-O3 (Sanko Junyaku) supplemented
with 50mM 2-b-mercaptoethanol, 10% FBS, 1% L-glutamine,
penicillin, streptomycin solution (GPS; Sigma), 10 ng/ml mouse SCF, 10 ng/ml human TPO, 10 ng/ml mouse IL-3, and 3 unit/ ml human EPO (PeproTech). At day 14 of culture, the colonies were counted and individually collected for morphological examination. To evaluate the tolerance of test cells against oxidative stress, CD34-LSK cells were cultured in the presence of DL-Buthionin-(S,R)-sulfoximine (BSO, Sigma) or N-Acetyl-L -cys-teine (NAC, Sigma) for the indicated time periods, then subjected to colony assays or flow cytometric analyses.
Serial Transplantation and CRU Assays
Fresh BM cells (56105, CD45.2) or 10-day cultured CD34-LSK
cells (CD45.2) corresponding to 20 initial CD34-LSK cells were transplanted into 8-week-old recipient mice (CD45.1) irradiated at a dose of 9.5 Gy together with 56105and 26105BM competitor cells from 8-week-old CD45.1 mice, respectively. For serial transplantation, BM cells were collected from all recipient mice at 12–20 weeks after transplantation and pooled together. Then, 56106BM cells were transplanted into 8-week-old B6-CD45.1 mice irradiated at a dose of 9.5 Gy without competitor cells. Third and fourth transplantation were similarly performed using 56106 pooled BM cells. Peripheral blood (PB) cells of the recipient mice were analyzed with a mixture of antibodies that included PE/Cy7-conjugated anti-CD45.1, pacific blue-PE/Cy7-conjugated anti-CD45.2, PE-conjugated Mac-1 and Gr-1, APC-conjugated anti-B220, and APC/Cy7-conjugated anti-CD4 and anti-CD8a antibodies. Cells were analyzed on a FACS Canto II. Percent donor chimerism was calculated as (% donor cells) 6100/(%
donor cells + % recipient cells). To obtain the competitive repopulating units (CRUs), CRU assays were performed with a limiting number of test cells and the data were analyzed using L-Calc software (StemCell Technologies). Peripheral blood cell counts were made using an automated cell counter, Celltec a (Nihon Kohden).
Apoptosis Analysis
Bulk sorted CD34-LSK cells were incubated in SF-O3 supplemented with 50mM?2-b-mercaptoethanol, 0.2% BSA, 1%
GPS, 50 ng/ml SCF, 50 ng/ml TPO for 10 days at 37uC in a 5% CO2 atmosphere. At day 10 of culture, the cultured cells were incubated with APC-conjugated anti-Annexin V (BD Pharmingen)
and propidium iodide at room temperature for 15 min with protection from light. Analysis was performed on FACS Canto II.
Immunostaining ofcH2A.X
Cells were incubated in a culture medium drop on slide glasses pre-treated with poly-L-lysine (Sigma) for 2 hours. After fixation with 2% paraformaldehyde and blocking in 4% sheep serum for 30 min at room temperature, cells were incubated with purified anti-phospho-Histone H2A.X (Ser139) antibody (Cell Signaling Technology) for 12 hours at 4uC. The cells were then washed and incubated with Alexa Flour 555-conjugated anti-rabbit IgG goat polyclonal antibody (Invitrogen) for 60 min at room temperature. DNA was counterstained with 49,6-diamidino-2-phenylindole (DAPI). Images were taken with a Keyence BZ-9000 fluorescence microscope.
RT-PCR
Total RNA was isolated using TRIZOL LS solution or TRIZOL solution (Invitrogen) and reverse transcribed by the ThermoScript RT-PCR system (Invitrogen) with an oligo-dT primer. Real-time quantitative polymerase chain reaction (PCR) was performed with an ABI prism 7300 Thermal Cycler (Applied Biosystems) using FastStart Universal Probe Master (Roche). The combination of primer sequences and probe numbers are as follows: for p16Ink4a, probe #91, 59 -AATCTCCGCGAGGA-AAGC-39, and 59-GTCTGTCTGCAGCGGACTC-39; for
p19Arf, probe #106, 59-GGGTTTTCTTGGTGAAGTTCG-39, 59- TTGCCCATCATCATCACCT-39, and forBmi1, probe#95, 59-AAACCAGACCACTCCTGAACA-39 and 59 -TCTTCTT-CTCTTCATCTCATTTTTGA-39.
Western Blotting
Total cell lysate was resolved by SDS-PAGE and transferred to a PVDF membrane. The blots were probed with a mouse anti-Bmi1 (clone 8A9, kindly provided by Dr. N. Nozaki, MAB Institute, Co. Ltd., Japan), and a horseradish peroxidase-conju-gated secondary antibody. The protein bands were detected with an enhanced chemiluminescence reagent (SuperSignal, Pierce Biotechnology).
Detection of ROS
Cells were stained with an antibody cocktail consisting of biotinylated anti-Gr-1, Mac-1, IL-7Ra, B220, CD4, CD8a, and Ter119 monoclonal antibodies. Cells were further stained with PE-conjugated anti-Sca-1, and PE/Cy7-conjugated anti-c-Kit antibodies. Biotinylated antibodies were detected with APC/ Cy7-conjugated streptavidin. After staining with antibodies, cells were incubated with CellROXTM Deep Red Reagent (5mM, Invitrogen) at 37uC for 30 min with protection from light. Dead cells were eliminated by staining with propidium iodide (1mg/ml,
Sigma). Analysis was performed on a FACS Aria II.
Supporting Information
Figure S1 Steady state hematopoiesis in Tie2-Cre;R26-StopFLBmi1 mice. (A) Hematopoietic analysis of 10-week-old
CD34-LSK cells in the G0 phase of the cell cycle (Pyronin Y-) was shown as the mean 6 S.D. (n = 4) (left panel). Representative flow cytometric profiles are also depicted (right panel).
(EPS)
Figure S2 Apoptosis and cell cycle status of Tie2-Cre;R26StopFLBmi1LSK cells in culture.(A) The proportion of apoptotic cells in the LSK fraction in culture. CD34-LSK cells from Tie2-Cre(Control) andTie2-Cre;R26StopFLBmi1
(Bmi1) mice were cultured in the SF-O3 serum-free medium supplemented with 50 ng/ml SCF and TPO. At day 10 of culture, apoptotic cells were detected by staining culture cells with anti-Annexin V and propidium iodide (PI). The percentage of Annexin V+ PI-apoptotic cells in the LSK fraction is shown as the mean6S.D. (n = 5). (B) The cell cycle status of LSK cells overexpressing Bmi1. CD34-LSK cells from Tie2-Cre (Control) and Tie2-Cre; R26-StopFLBmi1 (Bmi1) mice were cultured in the SF-O3 serum-free medium supplemented with 50 ng/ml SCF and TPO. At day 10 of culture, the cells were incubated with 10mM BrdU at 37uC for 30 min and then analyzed using a BrdU Flow Kit. Data are shown as the mean6SD (n = 4).
(EPS)
Figure S3 Hematopoietic recovery in recipients of Tie2-Cre;R26StopFLBmi1HSCs after irradiation.Fresh BM cells fromTie2-CreandTie2-Cre;R26StopFLBmi1mice (16107, CD45.2) were transplanted into 8-week-old CD45.1 mice irradiated at a dose of 9.5 Gy without competitor cells. Four months later, the recipient mice were irradiated at a dose of 5 Gy. Changes in the PB cell count were monitored for 4 weeks (A) and the absolute
number of BM LSK cells in bilateral femurs and tibiae was examined at 4 weeks post-irradiation (B). Data are shown as the mean6SD (n = 5).
(EPS)
Figure S4 ROS levels inTie2-Cre;R26StopFLBmi1cells in culture.Levels of ROS in cells overexpressing Bmi1 in culture. CD34-LSK cells from Tie2-Cre (Control) and Tie2-Cre;R26-StopFLBmi1 (Bmi1) mice were cultured in the SF-O3 serum-free medium supplemented with 50 ng/ml SCF and TPO. Cells from day 11 or 12 of culture were further cultured for 2 days in the presence of 0.2 mM BSO, then levels of ROS in Lin-Sca-1+c-Kit+ cells and Lin-Sca-1low/2c-Kit+ cells were analyzed using CellROXTM Deep Red Reagent. Data are shown as dots and the mean values are indicated by bars (n = 4).
(EPS)
Acknowledgments
We thank Naohito Nozaki for the anti-Bmi1 antibody, George Wendt for critical reading of the manuscript, and Mieko Tanemura for laboratory assistance.
Author Contributions
Conceived and designed the experiments: SN AI. Performed the experiments: SN M. Oshima JY AS SM TK SY M. Osawa. Analyzed the data: SN AI. Contributed reagents/materials/analysis tools: HK HN. Wrote the paper: SN AI.
References
1. Simon JA, Kingston RE (2009) Mechanisms of polycomb gene silencing: knowns and unknowns. Nat Rev Mol Cell Biol 10: 697–708.
2. Iwama A, Oguro H, Negishi M, Kato Y, Nakauchi H (2005) Epigenetic regulation of hematopoietic stem cell self-renewal by polycomb group genes. Int J Hematol 81: 294–300.
3. Konuma T, Oguro H, Iwama A (2010) Role of the polycomb group proteins in hematopoietic stem cells. Dev Growth Differ 52: 505–516.
4. Sauvageau M, Sauvageau G (2010) Polycomb group proteins: multi-faceted regulators of somatic stem cells and cancer. Cell Stem Cell 7: 299–313. 5. Lessard J, Sauvageau G (2003) Bmi-1 determines the proliferative capacity of
normal and leukaemic stem cells. Nature 423: 255–260.
6. Park IK, Qian D, Kiel M, Becker MW, Pihalja M, et al. (2003) Bmi-1 is required for maintenance of adult self-renewing haematopoietic stem cells. Nature 423: 302–305.
7. Iwama A, Oguro H, Negishi M, Kato Y, Morita Y, et al. (2004) Enhanced self-renewal of hematopoietic stem cells mediated by the polycomb gene product Bmi-1. Immunity 21: 843–851.
8. Oguro H, Iwama A, Morita Y, Kamijo T, van Lohuizen M, et al. (2006) Differential impact of Ink4a and Arf on hematopoietic stem cells and their bone marrow microenvironment in Bmi1-deficient mice. J Exp Med 203: 2247–2253. 9. Oguro H, Yuan J, Ichikawa H, Ikawa T, Yamazaki S, et al. (2010) Poised lineage specification in multipotent hematopoietic stem and progenitor cells by the polycomb protein Bmi1. Cell Stem Cell 6: 279–286.
10. Mihara K, Chowdhury M, Nakaju N, Hidani S, Ihara A, et al. (2006) Bmi-1 is useful as a novel molecular marker for predicting progression of myelodysplastic syndrome and patient prognosis. Blood 107: 305–308.
11. Rizo A, Horton SJ, Olthof S, Dontje B, Ausema A, et al. (2010) BMI1 collaborates with BCR-ABL in leukemic transformation of human CD34+cells. Blood 116: 4621–4630.
12. Kisanuki YY, Hammer RE, Miyazaki J, Williams SC, Richardson JA, et al. (2001) Tie2-Cre transgenic mice: a new model for endothelial cell-lineage analysis in vivo. Dev Biol 230: 230–242.
13. Takano H, Ema H, Sudo K, Nakauchi H (2004) Asymmetric division and lineage commitment at the level of hematopoietic stem cells: inference from differentiation in daughter cell and granddaughter cell pairs. J Exp Med 199: 295–302.
14. Ema H, Takano H, Sudo K, Nakauchi H (2000) In vitro self-renewal division of hematopoietic stem cells. J Exp Med 192: 1281–1288.
15. Shima H, Takubo K, Iwasaki H, Yoshihara H, Gomei Y, et al. (2009) Reconstitution activity of hypoxic cultured human cord blood CD34-positive cells in NOG mice. Biochem Biophys Res Commun 378: 467–472.
16. Ito K, Hirao A, Arai F, Takubo K, Matsuoka S, et al. (2006) Reactive oxygen species act through p38 MAPK to limit the lifespan of hematopoietic stem cells. Nat Med 12: 446–451.
17. Yahata T, Takanashi T, Muguruma Y, Ibrahim AA, Matsuzawa H, et al. (2011) Accumulation of oxidative DNA damage restricts the self-renewal capacity of human hematopoietic stem cells. Blood 118: 2941–2950.
18. Rossi DJ, Jamieson CH, Weissman IL (2008) Stems cells and the pathways to aging and cancer. Cell 132: 681–696.
19. Chagraoui J, He´bert J, Girard S, Sauvageau G (2011) An anticlastogenic function for the Polycomb Group gene Bmi1. Proc Natl Acad Sci USA 108: 5284–5289.
20. Ginjala V, Nacerddine K, Kulkarni A, Oza J, Hill SJ, et al. (2011) BMI1 is recruited to DNA breaks and contributes to DNA damage-induced H2A ubiquitination and repair. Mol Cell Biol 31: 1972–1982.
21. Facchino S, Abdouh M, Chatoo W, Bernier G (2010) BMI1 confers radioresistance to normal and cancerous neural stem cells through recruitment of the DNA damage response machinery. J Neurosci 30: 10096–10111. 22. Shao L, Li H, Pazhanisamy SK, Meng A, Wang Y, et al. (2010) Reactive oxygen
species and hematopoietic stem cell senescence. Int J Hematol 94: 24–32. 23. Jang YY, Sharkis SJ (2007) A low level of reactive oxygen species selects for
primitive hematopoietic stem cells that may reside in the low-oxygenic niche. Blood 110: 3056–3063.
24. Liu J, Liu C, Chen J, Song S, Lee IH, et al. (2009) Bmi1 regulates mitochondrial function and the DNA damage response pathway. Nature 459: 387–392. 25. Rizo A, Olthof S, Han L, Vellenga E, de Haan G, et al. (2009) Repression of
BMI1 in normal and leukemic human CD34+
cells impairs self-renewal and induces apoptosis. Blood 114: 1498–1505.
26. Owusu-Ansah E, Banerjee U (2009) Reactive oxygen species prime Drosophila haematopoietic progenitors for differentiation. Nature 461: 537–541. 27. Bracken AP, Kleine-Kohlbrecher D, Dietrich N, Pasini D, Gargiulo G, et al.
(2007) The polycomb group proteins bind throughout the INK4A-ARF locus and are disassociated in senescent cells. Genes Dev 21: 525–530.
28. Negishi M, Saraya A, Mochizuki S, Helin K, Koseki H, et al. (2010) A novel zinc finger protein Zfp277 mediates transcriptional repression of the Ink4a/Arf locus through polycomb repressive complex 1. PLoS One 5: e12373.
29. Kamminga LM, Bystrykh LV, de Boer A, Houwer S, Douma J, et al. (2006) The Polycomb group gene Ezh2 prevents hematopoietic stem cell exhaustion. Blood 107: 2170–2179.
30. Stapels M, Piper C, Yang T, Li M, Stowell C, et al. (2010) Polycomb group proteins as epigenetic mediators of neuroprotection in ischemic tolerance. Sci Signal 3: ra15.
32. Diehn M, Cho RW, Lobo NA, Kalisky T, Dorie MJ, et al. (2009) Association of reactive oxygen species levels and radioresistance in cancer stem cells. Nature 458: 780–783.
33. Zhou J, Bi C, Cheong LL, Mahara S, Liu SC, et al. (2011) The histone methyltransferase inhibitor, DZNep, up-regulates TXNIP, increases ROS production, and targets leukemia cells in AML. Blood 118: 2830–2839.
34. Sasaki Y, Derudder E, Hobeika E, Pelanda R, Reth M, et al. (2006) Canonical NF-kappaB activity, dispensable for B cell development, replaces BAFF-receptor signals and promotes B cell proliferation upon activation. Immunity 24: 729–739.