ROBERTA MARCONDES MACHADOFIGUEIREDO
Efeito dos ácidos graxos saturados, poli-insaturados
e
trans
no desenvolvimento de aterosclerose e esteatose
hepática em camundongos com ablação gênica do
receptor de LDL
Tese apresentada à Faculdade de Medicina da
Universidade de São Paulo para obtenção do
título de Doutor em Ciências
Programa de: Endocrinologia
Orientadora: Dra. Ana Maria Pita Lottenberg
(Versão corrigida. Resolução CoPGr 5890, de 20 de dezembro de 2010.
A versão original está disponível na Biblioteca FMUSP)
g
·
·
·
a
~
a
g
b
a
DD
g
a
g
✂ ✁
✁✂ ✁
✄
✂ ✁ ✁✂ ✁
✄
(m m
✆
m
✆
m
✆
m
✆
m
✝
m
m
m
m
✞
m
m
m
✞
a
The Journal of Nutrition
Nutrition and Disease
Intake of
trans
Fatty Acids Causes
Nonalcoholic Steatohepatitis and Reduces
Adipose Tissue Fat Content
1–3
Roberta M. Machado,
4Jose´ T. Stefano,
5Claudia P. M. S. Oliveira,
5Evandro S. Mello,
6Fabiana D. Ferreira,
4Valeria S. Nunes,
4Viceˆncia M. R. de Lima,
5Eder C. R. Quinta˜o,
4Sergio Catanozi,
4Edna R. Nakandakare,
4and Ana Maria P. Lottenberg
4*
4Endocrinology and Metabolism Division, Faculty of Medical Sciences of the University, Lipids Laboratory, LIM-10,5Department of
Gastroenterology, LIM-07, and6Department of Pathology, LIM-14, Faculty of Medical Sciences of the University of Sao Paulo, Sao Paulo, 01246-903 Brazil
Abstract
We investigated the effects of dietarytransfatty acids, PUFA, and SFA on body and liver fat content, liver histology, and mRNA of enzymes involved in fatty acid metabolism. LDL receptor knockout weaning male mice were fed for 16 wk
with diets containing 40% energy as eithertransfatty acids (TRANS), PUFA, or SFA. Afterwards, subcutaneous and epididymal fat were weighed and histological markers of nonalcoholic fatty liver disease (NAFLD) were assessed
according to the Histological Scoring System for NAFLD. PPARa, PPARg, microsomal triglyceride transfer protein
(MTP), carnitine palmitoyl transferase 1 (CPT-1), and sterol regulatory element binding protein-1c (SREBP-1c) mRNA
were measured by quantitative RT-PCR. Food intake was similar in the 3 groups, although mice fed the TRANS diet
gained less weight than those receiving the PUFA diet. Compared with the PUFA- and SFA-fed mice, TRANS-fed mice
had greater plasma total cholesterol (TC) and triglyceride (TG) concentrations, less epididymal and subcutaneous fat,
larger livers with nonalcoholic steatohepatitis (NASH)-like lesions, and greater liver TC and TG concentrations.
Macrosteatosis in TRANS-fed mice was associated with a higher homeostasis model assessment of insulin resistance
(HOMAIR) index and upregulated mRNA related to hepatic fatty acid synthesis (SREBP-1c and PPARg) and to
downregulated MTP mRNA. Diet consumption did not alter hepatic mRNA related to fatty acid oxidation (PPARaand
CPT-1). In conclusion, compared with PUFA- and SFA-fed mice, TRANS-fed mice had less adiposity, impaired
glucose tolerance characterized by greater HOMAIRindex, and NASH-like lesions due to greater hepatic lipogenesis.
These results demonstrate the role of trans fatty acid intake on the development of key features of metabolic syndrome. J. Nutr. doi: 10.3945/jn.109.117937.
Introduction
The intake of fat-rich diets and a sedentary lifestyle are related to
the epidemic of obesity in Western societies. Body weight excess
and abdominal obesity predispose to insulin resistance,
dyslipi-demia, hypertension, and a proinflammatory and prothrombotic
status, which are linked to the development of premature
atherosclerotic cardiovascular disease and type 2 diabetes
mellitus (1).
Nonalcoholic fatty liver disease (NAFLD)
7is a clinical and
pathological condition whose severity can range from mild
steatosis to nonalcoholic steatohepatitis (NASH) and even to
cirrhosis and hepatocellular carcinoma (2) in patients without a
history of alcohol abuse. The prevalence of NAFLD is rapidly
increasing, ranging from 15 to 25% in the general population
(3). Recently, a strong association between metabolic syndrome
1
Supported by the State of Sa˜o Paulo Research Foundation (FAPESP no. 06/55516-8). Fats were provided by UNILEVER Best Foods (SP, Brazil) and gas-liquid chromatographic analyses was conducted by Cognis Brasil LTDA.
2
Author disclosures: R. M. Machado, J. T. Stefano, C. P. M. S. Oliveira, E. S. Mello, F. D. Ferreira, V. S. Nunes, V. M. R. d. Lima, E. C. R. Quinta˜o, S. Catanozi, E. R. Nakandakare, and A. M. P. Lottenberg, no conflicts of interest.
3
Supplemental Figure 1 is available with the online posting of this paper at jn. nutrition.org.
* To whom correspondence should be addressed. E-mail: amlottenberg@uol. com.br.
7
Abbreviations used: AST, aspartate aminotransferase; ALT, alanine amino-transferase; CPT-1, carnitine palmitoyl transferase-1; HDL-C, HDL cholesterol; HOMAIR, homeostasis model assessment of insulin resistance; LDL-KO, LDL
receptor knockout; MTP, microsomal triglyceride transfer protein; NAFLD, nonalcoholic fatty liver disease; NASH, nonalcoholic steatohepatitis; SREBP-1c, sterol regulatory element binding protein-1c; TC, total cholesterol; TG, triglyc-eride; TRANS, diet enriched withtransfatty acid.
ã2010 American Society for Nutrition.
Manuscript received November 16, 2009. Initial review completed December 4, 2009. Revision accepted March 11, 2010. 1 of 6
and NAFLD was reported; ~90% of NAFLD cases concurrently
present 1 or more features of metabolic syndrome, whereas 30%
present all features of metabolic syndrome (4).
Although the etiology of NAFLD is not fully understood,
accumulation of fat in the liver has been ascribed to diverse fatty
acid metabolic abnormalities, including increased hepatic
lipo-genesis, impaired mitochondrial fatty acid oxidation, and
increased triglyceride (TG) content of VLDL particles (5,6).
Additionally, fatty liver can be associated with local oxidative
stress, lipid peroxidation, and tumor necrosis factor-
a
produc-tion that may be critical to liver injury, inflammaproduc-tion, fibrosis,
and the development of NASH (6,7).
The individual roles of various nutritional and metabolic
factors in the pathogenesis and natural history of NAFLD are
still incompletely understood. One key contributor could be
insulin resistance, regarded by some as the hallmark and causal
factor of NAFLD, although its occurrence is not obligatory for
NAFLD (8,9). Individuals with uncomplicated steatosis and
NASH have been studied to discern common dietary patterns
and macronutrient intake. Whereas some studies revealed
elevated carbohydrate and fat intake, scientific and clinical
consensus is lacking. Dietary assessment cannot reveal
lip-otoxicity per se (10).
Other studies have shown that both quantity and quality of
dietary fat influences liver fatty acid synthesis (11–13) and
insulin sensitivity (14,15). Dietary fatty acids can induce insulin
resistance (16) and raise the risk of cardiovascular disease (17).
Furthermore, elevated intake of
trans
fatty acids (18) and dietary
SFA are related to the incidence of coronary atherosclerotic
disease (19). The proatherogenic effect of the
trans
fatty acids is
in part attributed to reduced plasma HDL cholesterol (HDL-C)
and increased LDL cholesterol, TG, and lipoprotein (a) (18–20).
However, little is known about the influence of
trans
fatty acids
on hepatic lipid metabolism. In mice, intake of
trans
fatty acids
induced fat accumulation in the liver that resembled NASH (21);
however, PUFA were not included for comparison and the
authors did not evaluate hepatic genes involved in fat
accumu-lation (21).
LDL receptor knockout (LDLr-KO) mice have a plasma
lipoprotein profile that mimics that of humans. When fed a
high-fat diet, these mice develop atherosclerosis, weight gain, and
other features of metabolic syndrome such as
hypertriglyceride-mia, decreased HDL, hyperinsulinehypertriglyceride-mia, and insulin resistance
(22). Therefore, we chose this murine model to compare the
effects of high-fat diets enriched with 3 different fatty acids,
trans
(TRANS), PUFA, and SFA fatty acid, on the development
of NAFLD.
Materials and Methods
Mouse models and diet.LDLr-KO weaning male mice (C57BL/6J; Jackson Laboratory) were fed for 16 wk with 1 of 3 high-fat diets (40%
of energy as fat) enriched withtransfatty acids (TRANS;n= 13), PUFA
(n= 14), or SFA (n= 14). Diets were prepared by Nutriexperimental and
the composition complied with the recommendations of the AIN (23). The fatty acid compositions of the fats used in the diets are shown on
Table 1.
After weaning, male LDLr-KO mice were housed in a temperature-controlled environment (12-h-light/-dark cycle) and were allowed ad libitum access to food and water. Mice were weighed weekly and food intake was estimated daily by weighing the food offered and the residual food from the previous feeding. After a 16-wk period, mice were feed-deprived for 12 h and anesthetized with ketamine (100 mg/kg, intraperitoneal, Ketalar; Parke-Davis) and xylazine (10 mg/kg, intraper-itoneal, Rompum; Bayer). Blood was then drawn from the subclavian
vein. All animal experiments and care were conducted in accordance with the Ethics Committee of the Faculty of Medical Sciences of the University of Sa˜o Paulo.
Livers and epididymal fat pads were dissected, weighed, and immediately frozen. For later determination of subcutaneous adipose
tissue, the remaining carcass was frozen and stored at 2208C until
further analysis.
Blood sampling and lipoprotein profile.Plasma was separated after
centrifugation and samples were stored at 2808C. The following
analyses were performed with enzymatic kits: plasma cholesterol (Cholesterol CHOD-PAP 1489232), TG (Triglyceride GPO-PAP 11488872), glucose (Glucose PAP 84 Labtest Diagnostics, MG), alanine aminotransferase (ALT) (ALT/GTP Liquiform 108, Labtest Diagnostics), and aspartate aminotransferase (AST) (AST/GOT Liquiform 109, Labtest Diagnostics). Insulin was measured using an ELISA (Alpco Diagnostics). The homeostasis model assessment of insulin resistance
(HOMAIR) index was calculated with glucose and insulin concentration
obtained in the feed-deprived state using the following formula: glucose
(mg/dL)3 insulin (mU/mL)/405. The plasma lipoprotein profile was
determined by fast protein liquid chromatography. Whole plasma (100
mL) was injected onto a HR 10/30 30-cm Superose 6 column (Pharmacia
Biotech) and run at a constant flow of 0.5 mL/min with Tris buffer (10
mmol/L Tris, 150 mmol/L NaCl, 1 mmol/L EDTA, and 0.03% NaN3),
pH 7.4. Fractions were collected and pooled according to the elution times expected for VLDL, LDL, and HDL. Aliquots of isolated lipoprotein fractions were used for enzymatic measurement of choles-terol and TG in a Cobas Mira analyzer (F. Hoffman-La Roche).
Subcutaneous adipose tissue extraction. Subcutaneous adipose tissue was extracted after homogenization under mild alkaline
hydrol-ysis. Briefly, after removing the head, the carcasses were heated (908C) in
ethanol (20 mL, 95%, NaOH, 2 mL at 10 mol/L) until complete dissolution of the tissues. The samples were then acidified with HCl (10
mol/L) followed by lipid extraction with hexane (33 40 mL). After
solvent evaporation, lipids were diluted in hexane, transferred to preweighed glass shells, and completely evaporated at room temperature. The glass shells were then weighed to extrapolate the weight of lipids.
Histological analysis and grading of the NAFLD activity. Liver tissue samples of each animal were fixed in 4% formaldehyde and
TABLE 1 Fatty acid compositions of the diets1–3
Fatty acids TRANS PUFA SFA
g/100 g of fat
Lauric, 12:0 0.64 0 0.42
Mirystic, 14:0 0.38 0 0.77
Palmitic, 16:0 14.38 4.57 33.87
Palmitoleic, 16:1cis 0 0 0.25
Stearic, 18:0 17.78 2.83 4.51
Elaidic, 18:1trans 34.70 0 0.31
Oleic, 18:1cis 28.24 40.52 45.17
Linoelaidic, 18:2trans 1.61 0.20 0.45 Linoleic, [18:2 (n-6)cis] 1.33 47.13 13 Linolenic, [18:3 (n-3)cis] 0.10 3.71 0.62
Araquidic, 20:0 0.47 0.36 0.37
Eicosenoic, 20:1 (n-9) 0 0 0.21
Docosanoic, 22:0 0.48 0.32 0
Total saturated 34.12 8.08 39.95
Total monounsaturated 28.24 40.52 45.63 Total polyunsaturated 1.43 50.84 13.62
Totaltrans 36.30 0.48 0.76
1Sources of fats: SFA (11% olive oil, 5% soy bean oil, 84% palm oil); TRANS (100%
hydrogenated soy bean oil); PUFA (54% sunflower oil, 46% canola oil).
2GLC performed by COGNIS Brazil (TRANS fat) and Faculty of Pharmaceutical Science
of the University of Sa˜o Paulo (polyunsaturated and saturated fat).
3Fats were generously provided by Unilever, SP, Brazil.
processed for histological analysis with hematoxylin/eosin and Masson’s Trichrome stains. Histological variables were blindly scored by one of the authors (E.S.M.) using a scoring system adapted from the NASH activity score in accordance with the Pathology Committee of the NASH Clinical Research Network (24). This system numerically rates macro-steatosis (0–3), lobular inflammatory changes (0–3), and hepatocyte ballooning (0–2) and fibrosis (24–26).
Liver lipid concentrations.Measurement of liver cholesterol and TG was performed as previously described (27). Briefly, ~200 mg of tissue (wet weight) was homogenized and lipids were extracted in a chloro-form:methanol (2:1) solution (6 mL). Phases were separated by the
addition of 0.05% H2SO4. Chloroform (1 mL, 0.5% Triton X-100) was
then added to the lower phase and dried under nitrogen at room temperature. The tubes were rinsed with chloroform and dried again. Deionized water (1 mL) was added, tubes were shaken in a water bath
(378C for 15 min), vortexed, and subsequently used for the enzymatic
determination of lipid content.
Liver RNA analysis.Liver tissue total RNA was extracted using Trizol (Invitrogen Life Technologies) according to the manufacturer’s recom-mendations. RNA content was determined spectrophotometrically and RNA integrity verified by visualization of the 28S and 18S RNA bands in a 1% agarose gel stained with ethidium bromide. Transcription levels of
PPARa, PPARg, microsomal TG transfer protein (MTP), carnitine
palmitoyl transferase (CPT-1), and sterol regulatory element binding protein 1-c (SREBP-1c) were determined by quantitative RT-PCR, which was carried out in a Rotor-Gene RG-3000 (Corbett Research) using the SuperScript III Platinum One-Step Quantitative RT-PCR system (Invi-trogen Life Technologies) according to the manufacturer’s instructions.
Primers were designed using the Primer3 Plus (http://primer3. sourceforge.net). The sense and antisense primers for each transcript
were as follows:b-actin, TGTTACCAACTGGGACGACA and
GGGGT-GTTGAAGGTCTCAAA; PPARa, ATGCCAGTACTGCCGTTTTC and
TTGCCCAGAGATTTGAGGTC; PPARg,
CATAAAGTCCTTCCCGC-TGA and GAAACTGGCACCCTCATAAAGTCCTTCCCGC-TGAAAA; MTP, CCTCTTGGCA-GTGCTTTTTC and ATTTTGTAGCCCACGCTGTC; CPT-1, TGCCT-CTATGTGGTGTCCAA and TCAAACAGTTCCACCTGCTG; SREBP-1c, GCGCTACCGGTCTTCTATCA and GGATGTAGTCGATGGCCTTG.
Values of PPARa, PPARg, MTP, CPT-1, and SREBP-1 mRNA were
normalized by corresponding values of housekeepingb-actin mRNA and
additionally normalized to the mean value control livers from mice fed a regular-fat diet (Nuvilab-CR1, Nuvital). These animals were utilized to determine basal conditions. To evaluate the amplification efficiency of each
target gene andb-actin gene, standard curves were constructed from a
control liver RNA sample using duplicate serial dilutions with 5 different
RNA concentrations (500, 100, 20, 4, and 0.8mg/L). Relative
quantifi-cation was calculated using the 22DDCT method (28) for PPARgand
SREBP-1 genes based on their equivalent amplification efficiency with
b-actin. The mathematical model described (29) was used to evaluate
the relative expression ratio of PPARa, MTP, and CPT-1 to b-actin.
Amplification of PPARa, PPARg, MTP, CPT-1, SREBP-1c, and
house-keeping control genes was conducted in duplicate for each sample.
Interassay variation was investigated in 2 different experimental analyses performed on different days.
Statistical analysis.Results are expressed as means6SD. Statistical analysis for the data that passed the normality test was performed using 1-way ANOVA followed by the post hoc Newman-Keuls multiple comparison test for pair wise comparisons. AST and ALT were analyzed
by nonparametric Kruskal-Wallis tests. A value of P , 0.05 was
considered significant. The data were analyzed with the software GraphPad Prism 4 (GraphPad Software).
Results
Food intake did not differ among the groups, even though mice
fed the TRANS diet gained less weight than those fed the PUFA
(16%) and SFA (11%) diets. Moreover, mice in the TRANS
group had ~37% and 36% less subcutaneous fat compared with
mice in the PUFA and SFA groups, respectively. The epididymal
fat pad content, which roughly mimics visceral fat in humans,
was also lower in mice fed the TRANS diet
(Table 2)
. However,
liver weight of the TRANS-fed mice was 66% and 61% higher
as compared with PUFA- and SFA-fed mice, respectively (Table
2;
Supplemental Fig. 1
A
)
. Plasma AST and ALT levels did not
differ among the groups (Table 2).
Liver histology and lipid concentrations.
Liver total
choles-terol (TC) and TG concentrations were significantly greater in
the TRANS-fed mice than in the PUFA- and SFA-fed mice (Table
2). Moreover, mice fed the TRANS diet developed NASH-like
lesions characterized by macrovesicular steatosis (grade 3) and
inflammatory infiltrate (grade 2), whereas mice fed the PUFA
and SFA diets had very mild microvesicular hepatic steatosis
(grade 1) with minimal inflammatory process (grade 1)
(
Sup-plemental Fig. 1
B
). Fibrosis and hepatocellular ballooning were
not observed in all samples and were therefore not scored.
Hepatic lipogenic gene expression.
To investigate the
mechanisms of development of NASH in LDLr-KO mice fed
the TRANS diet, we determined the mRNA of genes involved in
hepatic lipid metabolism. SREBP-1c expression was 130% and
88% higher in TRANS-fed mice than in PUFA- and SFA-fed
mice, respectively. PPAR
g
mRNA was over 4-fold and 2-fold
higher in TRANS-fed mice than in PUFA- and SFA-fed mice,
respectively. Conversely, MTP mRNA was 46% lower in
TRANS-fed mice compared with PUFA-fed mice, suggesting a
diminished liver capacity to export TG (
P
,
0.05). However, the
groups did not differ in expression of genes related to fatty acid
oxidation, PPAR
a
, and CPT-1 (
Table 3
).
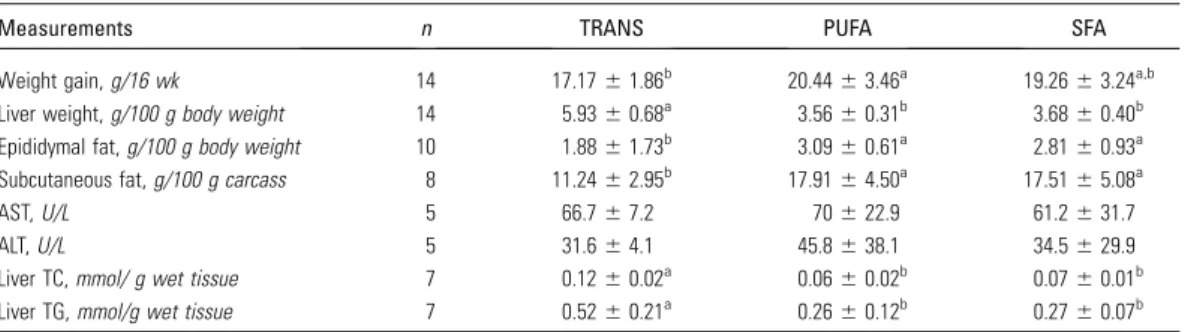
TABLE 2 Body weight gain, relative weights of liver and adipose tissue, liver lipids, and plasma enzyme
levels of LDLr-KO mice fed TRANS, PUFA, or SFA diets for 16 wk1,2
Measurements n TRANS PUFA SFA
Weight gain,g/16 wk 14 17.1761.86b 20.44
63.46a 19.26
63.24a,b Liver weight,g/100 g body weight 14 5.9360.68a 3.56
60.31b 3.68
60.40b Epididymal fat,g/100 g body weight 10 1.8861.73b 3.09
60.61a 2.81
60.93a Subcutaneous fat,g/100 g carcass 8 11.2462.95b 17.91
64.50a 17.51
65.08a
AST,U/L 5 66.767.2 70622.9 61.2631.7
ALT,U/L 5 31.664.1 45.8638.1 34.5629.9
Liver TC,mmol/ g wet tissue 7 0.1260.02a 0.0660.02b 0.0760.01b Liver TG,mmol/g wet tissue 7 0.5260.21a 0.26
60.12b 0.27
60.07b
1Data are presented as means
6SD. Means in a row with superscripts without a common letter differ,P,0.05.
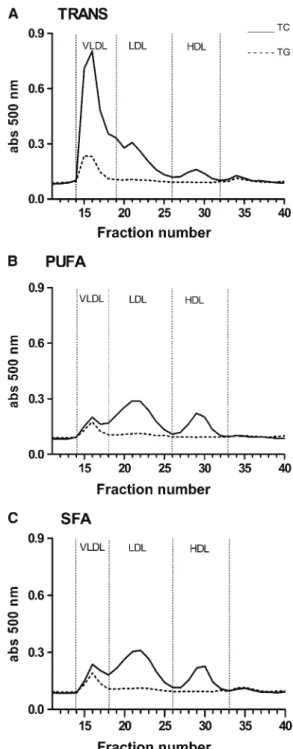
Plasma lipoproteins.
The plasma TG concentration in mice
fed the TRANS diet was 3-fold higher than in mice fed the PUFA
diet and 2-fold higher than in mice fed the SFA diet
(Table 4)
. In
addition, mice fed the TRANS diet had severe
hypercholester-olemia; plasma cholesterol was 5-fold higher than in mice fed the
PUFA diet and 2-fold higher than in mice fed the SFA diet.
PUFA-fed mice developed only mild hypercholesterolemia and their
plasma cholesterol concentration was lower than in SFA-fed
mice
(
Table 4
)
.
VLDL and LDL particles in the TRANS-fed mice had
markedly elevated cholesterol and TG concentrations compared
with the PUFA- and SAT-fed mice. HDL-C concentrations did
not differ among the groups. However, mice fed the TRANS diet
had a higher HDL TG concentration compared with mice fed the
PUFA diet
(
Table 4;
Fig. 1)
.
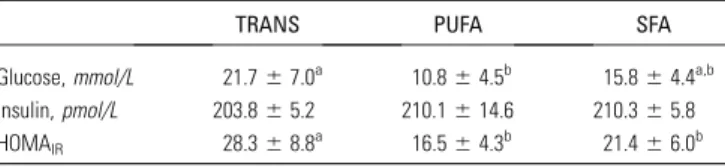
Circulating glucose and insulin.
The blood glucose
concen-tration in feed-deprived mice in the TRANS group was higher
than in the PUFA-fed mice but did not differ from the SFA-fed
mice. Plasma insulin did not differ among groups. Thus, the
calculated HOMA
IRfor mice fed the TRANS diet was higher
than in mice fed the SAT and PUFA diets, indicating greater
insulin resistance in the TRANS group
(Table 5)
.
Discussion
In this study, consumption of all 3 high-fat diets induced
some degree of liver steatosis. However, compared with mice fed
the PUFA and SFA diets, mice fed the TRANS diet had greater
liver weight that was associated with NASH-like lesions. In
agreement with another study (30), the TRANS diet intake
elicited increased transcription of genes involved in liver fat
synthesis such as PPAR
g
and SREBP-1c and was associated with
higher hepatic cholesterol and TG concentrations compared
with the PUFA and SFA diets. However, PPAR
a
and
CPT-1 mRNA were not affected in mice fed the TRANS diet,
suggesting that the liver
b
-oxidative capacity did not differ
among groups. In addition, we have shown that consumption of
the TRANS diet decreased the MTP mRNA compared with the
PUFA diet. This effect could be implicated in a reduction or
TABLE 3 Liver mRNA of LDLr-KO mice fed TRANS, PUFA, or
SFA diets for 16 wk1,2
mRNA TRANS PUFA SFA
Fold of control SREBP-1c 1.7360.90a 0.75
60.60b 0.92
60.50b PPAR-g 0.9960.43a 0.1860.06b 0.3660.10b
MTP 1.560.5b 2.3
60.7a 1.0
60.6b CPT 1.1560.03 1.1760.06 1.1360.05 PPAR-a 1.0260.13 1.1360.17 1.0760.15
1Data are presented as mean
6SD,n= 10. Means in a row with superscripts without a common letter differ,P,0.05.
2Results were standardized tob-actin mRNA and normalized to the mean of livers
from mice fed a diet containing 7% of energy as fat.
TABLE 4 Plasma lipoprotein cholesterol and TG concentrations
in LDLr-KO mice fed TRANS, PUFA, or SFA diets for 16 wk1,2
TRANS PUFA SFA
mmol/L
TC 30612a 4.9
61.6c 9.2
62.6b TG 4.761.9a 1.260.7b 1.760.4b VLDL cholesterol 1867.5a 1.2
60.9b 4.4
63.1b LDL cholesterol 7.563.9a 2.361.3b 4.161.9b HDL-C 1.360.2 1.260.6 1.860.6 VLDL-TG 3.361.2a 0.8
60.4b 1.3
60.4b LDL-TG 0.560.2a 0.2
60.1b 0.3
60.1b HDL-TG 0.3060.27a 0.04
60.03b 0.20
60.23a,b
1Data are presented as means
6SD,n= 8–14. Means in a row without a common letter differ,P,0.05.
2The cholesterol and TG distribution was calculated as the area under the peaks of the
fast protein liquid chromatography profiles of individual plasma samples and converted to absolute numbers.
FIGURE 1 Plasma lipoprotein profiles of mice fed TRANS (A), PUFA (B), or SFA (C) diets for 16 wk. Mice fed the TRANS diet had greater enrichments of cholesterol and TG in VLDL and LDL particles and had more HDL-TG than mice fed the PUFA and SFA diets. HDL-C did not differ among the groups,n= 8–9.
insufficient transfer of TG to nascent ApoB particles and thereby
reduced (impaired) VLDL assembly and secretion. This role of
MTP is well established in the literature (31) and absence of
MTP activity is demonstrated clinically in abetalipoproteinemia
(32).
Varied rodent models of NAFLD demonstrate histological
evidence of hepatic steatosis. Nevertheless, features of NASH
that should include ballooning hepatocyte degeneration or
inflammatory infiltrate in addition to hepatic steatosis (24) are
less frequently demonstrated (25). In the present study,
LDLr-KO mice fed 3 variations of a high-fat diet developed NAFLD.
However, only the TRANS diet consumption induced
NASH-like lesions, characterized by steatosis and mixed lobular
inflammatory infiltrate.
TRANS-fed mice had greater cholesterol and TG
concentra-tions in VLDL and LDL particles compared with the PUFA- and
SFA-fed mice. Moreover, compared with PUFA-fed mice,
TRANS-fed mice had more TG in the HDL particles. TG-enriched HDL
particles are good substrates for hepatic lipase, the enzyme
responsible for the HDL catabolism (33). Greater enzyme activity
can reduce HDL and promote the proatherogenic lipoprotein
pattern associated with
trans
fatty acid consumption.
Our data show that mice fed the TRANS diet gained less
weight than mice fed the PUFA diet and this was likely due to
reduced subcutaneous and epididymal fat. This result might be
explained by a direct effect of
trans
fatty acids on adipose tissue
lipolysis enzymes. However, elucidating mechanisms would
involve measurements of enzyme activity, protein expression as
related to fatty acid mobilization, and transcription factor
activity such as PPAR
a
and PPAR
g
.
Despite the similar plasma insulin concentration found in the
3 groups, only the consumption of the TRANS diet elicited
greater insulin resistance as indicated by HOMA
IR. In the study
by Tetri et al. (21), animals fed a diet enriched with
trans
fatty
acids plus fructose gained more weight than the controls, likely
due to higher energy intake. However, their data cannot be
compared with the current results, because mice fed the TRANS
diet weighed less than the other group even with similar food
intake.
Fat oxidation might be influenced by the degree of
unsatura-tion of fatty acids, being in order linolenic
.
linoleic
.
oleic (34).
In addition, energy expenditure is greater for oleic than for
linoleic and linolenic fatty acids (35) and diets enriched with SFA
reduce fat oxidation and energy expenditure (36). Nonetheless,
it has also been proposed that the oxidative capacity does not
differ among SFA (16:0), PUFA (18:2), and
trans
fatty acids
(
trans
18:1) (34). It is important to emphasize that in our study,
all diets were made with similar amounts of oleic acid and that
the TRANS, PUFA, and SFA diets were enriched, respectively,
with elaidic acid (18:1-
trans
), linoleic acid (18:2), and palmitic
acid (16:0), which appear to have similar oxidative capacities (34).
In a previous study, mice fed a high-fat diet enriched with
(n-3) PUFA developed mild hepatic steatosis but had preserved
mitochondrial
b
-oxidation and phosphorylation (37),
support-ing that the consumption of a high-fat diet enriched with (n-3)
PUFA may cause fatty liver without mitochondrial dysfunction.
In another study with mice, low amounts of
trans
fatty acids
induced oxidative stress (30). These findings raise the hypothesis
that
trans
fatty acids might induce oxidative stress due to
impaired mitochondrial function or increased endoplasmatic
reticulum stress. Intake of conjugated linoleic acids can also lead
to hepatomegaly and decreased adipose tissue mass (38,39).
However, because our diets did not contain conjugated linoleic
acids (Table 1), the present results may be attributed to
trans
fatty acids contained in the TRANS diet.
In conclusion, this study demonstrates that dietary
trans
fatty
acids promote changes similar to human metabolic syndrome,
including proatherogenic plasma lipid profiles, hepatomegaly
due to fat accumulation and inflammatory NASH-like lesions,
and impaired glucose tolerance. Therefore, this investigation
supports other findings that intake of
trans
fatty acids may be
deleterious for human health.
Acknowledgments
R.M.M. and A.M.P.L. designed and conducted the research,
analyzed the data, interpreted the results, and wrote the
manu-script; C.P.M.S.O. interpreted the results and wrote the
man-uscript; J.T.S., V.S.N., F.D.F., and V.M.R.L. conducted the
experiments and analyzed the data; E.S.M. analyzed the data;
S.C. provided the animals; E.R.N. and E.C.R.Q. designed the
research, interpreted the results and wrote the manuscript. All
authors read and approved the final manuscript and none of the
authors had a financial or personal conflict of interest.
Literature Cited
1. Grundy SM, Cleeman JI, Daniels SR, Donato KA, Eckel RH, Franklin
BA, Gordon DJ, Krauss RM, Savage PJ, et al.; American Heart Association, National Heart, Lung, and Blood Institute. Diagnosis and management of the metabolic syndrome: an American Heart Associa-tion/National Heart, Lung, and Blood Institute Scientific Statement. Circulation. 2005;112:2735–52.
2. Bugianesi E, Leone N, Vanni E, Marchesini G, Brunello F, Carucci P,
Musso A, De Paolis P, Capussotti L, et al. Expanding the natural history of nonalcoholic steatohepatitis: from cryptogenic cirrhosis to hepato-cellular carcinoma. Gastroenterology. 2002;123:134–40.
3. Targher G. Non-alcoholic fatty liver disease, the metabolic syndrome
and the risk of cardiovascular disease: the plot thickens. Diabet Med. 2007;24:1–6.
4. Rector RS, Thyfault JP, Wei Y, Ibdah JA. Non-alcoholic fatty liver
disease and the metabolic syndrome: an update. World J Gastroenterol. 2008;14:185–92.
5. Fabbrini E, Mohammed BS, Magkos F, Korenblat KM, Patterson BW,
Klein S. Alterations in adipose tissue and hepatic lipid kinetics in obese men and women with nonalcoholic fatty liver disease. Gastroenterol-ogy. 2008;134:424–31.
6. Browning JD, Horton JD. Molecular mediators of hepatic steatosis and
liver injury. J Clin Invest. 2004;114:147–52.
7. Wei Y, Rector RS, Thyfault JP, Ibdah JA. Nonalcoholic fatty liver
disease and mitochondrial dysfunction. World J Gastroenterol. 2008; 14:193–9.
8. Musso G, Gambino R, De Michieli F, Cassader M, Rizzetto M, Durazzo
M, Faga` E, Silli B, Pagano G. Dietary habits and their relations to insulin resistance and postprandial lipemia in nonalcoholic steatohepa-titis. Hepatology. 2003;37:909–16.
9. Cave M, Deaciuc I, Mendez C, Song Z, Joshi-Barve S, Barve S, McClain
C. Nonalcoholic fatty liver disease: predisposing factors and the role of nutrition. J Nutr Biochem. 2007;18:184–95.
10. Solga S, Alkhuraishe AR, Clark JM, Torbenson M, Greenwald A, Diehl AM, Magnuson T. Dietary composition and nonalcoholic fatty liver disease. Dig Dis Sci. 2004;49:1578–83.
TABLE 5 Effect of TRANS, PUFA, and SFA diets on plasma
glucose, insulin, and HOMAIRin LDLr-KO fed mice1
TRANS PUFA SFA
Glucose,mmol/L 21.767.0a 10.864.5b 15.864.4a,b Insulin,pmol/L 203.865.2 210.1614.6 210.365.8 HOMAIR 28.368.8a 16.564.3b 21.466.0b
1Data are presented as mean
6SD,n= 8. Means in a row with superscripts without a common letter differ,P,0.05.
11. Buettner R, Parhofer KG, Woenckhaus M, Wrede CE, Kunz-Schughart LA, Scho¨lmerich J, Bollheimer LC. Defining high-fat-diet rat models: metabolic and molecular effects of different fat types. J Mol Endocrinol. 2006;36:485–501.
12. Giudetti AM, Sabetta S, di Summa R, Leo M, Damiano F, Siculella L, Gnoni GV. Differential effects of coconut oil- and fish oil-enriched diets on tricarboxylate carrier in rat liver mitochondria. J Lipid Res. 2003;44:2135–41.
13. Spadaro L, Magliocco O, Spampinato D, Piro S, Oliveri C, Alagona C, Papa G, Rabuazzo AM, Purello F. Effects of n-3 polyunsaturated fatty acids in subjects with nonalcoholic fatty liver disease. Dig Liver Dis. 2008;40:194–9.
14. Haag M, Dippenaar NG. Dietary fats, fatty acids and insulin resistance: short review of a multifaceted connection. Med Sci Monit. 2005;11: RA359–67.
15. Due A, Larsen TM, Hermansen K, Stender S, Holst JJ, Toubro S, Martinussen T, Astrup A. Comparison of the effects on insulin resistance and glucose tolerance of 6-mo high-monounsaturated-fat, low-fat, and control diets. Am J Clin Nutr. 2008;87:855–62. 16. Manco M, Calvani M, Mingronr G. Effects of dietary fatty acids on
insulin sensitivity and secretion. Diabetes Obes Metab. 2004;6:402–13. 17. Nicolosi RJ, Wilson TA, Rogers EJ, Kritchevsky D. Effects of specific
fatty acids (8:0, 14:0, cis-18:1,trans-18:1) on plasma lipoproteins, early
atherogenic potential, and LDL oxidative properties in the hamster. J Lipid Res. 1998;39:1972–80.
18. Mozaffarian D, Katan MB, Ascherio A, Stampfer MJ, Willett WC.
Trans fatty acids and cardiovascular disease. N Engl J Med. 2006; 354:1601–13.
19. Mensink RP, Zock PL, Kester AD, Katan MB. Effects of dietary fatty acids and carbohydrates on the ratio of serum total to HDL cholesterol and on serum lipids and apolipoproteins: a meta-analysis of 60 controlled trials. Am J Clin Nutr. 2003;77:1146–55.
20. Mensink RP, Katan MB. Effect of dietarytrans fatty acids on
high-density and low-high-density lipoprotein cholesterol levels in healthy subjects. N Engl J Med. 1990;323:439–45.
21. Tetri LH, Basaranoglu M, Brunt EM, Yerian LM, Neuschwander-Tetri BA. Severe NAFLD with hepatic necroinflammatory changes in mice fed
trans fats and a high-fructose corn syrup equivalent. Am J Physiol Gastrointest Liver Physiol. 2008;295:G987–95.
22. Srivastava RA, Jahagirdar R, Azhar S, Sharma S, Bisgaier CL. Peroxisome proliferator-activated receptor-alpha selective ligand re-duces adiposity, improves insulin sensitivity and inhibits atherosclerosis in LDL receptor-deficient mice. Mol Cell Biochem. 2006;285:35–50. 23. Reeves PG, Nielsen FH, Fahey GC Jr. AIN-93 purified diets for
laboratory rodents: final report of the American Institute of Nutrition ad hoc writing committee on the reformulation of the AIN-76A rodent diet. J Nutr. 1993;123:1939–51.
24. Kleiner DE, Brunt EM, Van Natta M, Behling C, Contos MJ, Cummings OW, Ferrel LD, Liu YC, Torbenson MS, et al. Design and
validation of a histologic scoring system for NAFLD. Hepatology. 2005;41:1313–21.
25. Anstee QM, Goldin RD. Mouse models in non-alcoholic fatty liver disease and steatohepatitis research. Int J Exp Pathol. 2006;87:1–16. 26. Oliveira CP, Stefano JT, de Lima VM, de Sa´ SV, Simplicio FI, de Mello
ES, Correˆa-Giannella ML, Alves VA, Laurindo FR, et al. Hepatic gene expression profile associated with non-alcoholic steatohepatitis protec-tion by S-nitroso-N-acetylcysteine in ob/ob mice. J Hepatol. 2006;45: 725–33.
27. Carr TP, Andresen CJ, Rudel LL. Enzymatic determination of triglyc-eride, free cholesterol, and total cholesterol in tissue lipid extracts. Clin Biochem. 1993;26:39–42.
28. Pfaffl MW. A new mathematical model for relative quantification in real time RT-PCR. Nucleic Acids Res. 2001;29:e45.
29. Livak KJ, Schmittgen TD. Analysis of relative gene expression data using real-time quantitative PCR and the 2(-Delta Delta C(T)) method. Methods. 2001;25:402–8.
30. Cassagno N, Palos-Pinto A, Costet P, Breilh D, Darmon M, Berard AM.
Low amounts oftrans18:1 fatty acids elevate plasma triacylglycerols
but not cholesterol and alter the cellular defense to oxidative stress in mice. Br J Nutr. 2005;94:346–52.
31. Ginsberg HN, Fisher EA. The ever-expanding role of degradation in the regulation of apolipoprotein B metabolism. J Lipid Res. 2009;50:S162–6. 32. Wetterau JR, Aggerbeck LP, Bouma ME, Eisenberg C, Munck A, Hermier M, Schmitz J, Gay G, Rader DJ, et al. Absence of microsomal triglyceride transfer protein in individuals with abetalipoproteinemia. Science. 1992;258:999–1001.
33. Verge`s B. Lipid modification in type 2 diabetes: the role of LDL and HDL. Fundam Clin Pharmacol. 2009;23:681–5.
34. DeLany JP, Windhauser MM, Champagne CM, Bray GA. Differential oxidation of individual dietary fatty acids in humans. Am J Clin Nutr. 2000;72:905–11.
35. Jones PJ, Jew S, AbuMweis S. The effect of dietary oleic, linoleic, and linolenic acids on fat oxidation and energy expenditure in healthy men. Metabolism. 2008;57:1198–203.
36. Kien CL, Bunn JY, Ugrasbul F. Increasing dietary palmitic acid decreases fat oxidation and daily energy expenditure. Am J Clin Nutr. 2005; 82:320–6.
37. Oliveira CP, Coelho AM, Barbeiro HV, Lima VM, Soriano F, Ribeiro C, Molan NA, Alves VA, Souza HP, et al. Liver mitochondrial dysfunction and oxidative stress in the pathogenesis of experimental nonalcoholic fatty liver disease. Braz J Med Biol Res. 2006;39:189–94.
38. Clement L, Poirier H, Niot I, Bocher V, Guerre-Millo M, Krief S, Staels B, Besnard P. Dietary trans-10,cis-12 conjugated linoleic acid induces hyperinsulinaemia and fatty liver in the mouse. J Lipid Res. 2002; 43:1400–9.
39. Ferramosca A, Savy V, Conte L, Colombo S, Einerhand AW, Zara V. Conjugated linoleic acid and hepatic lipogenesis in mouse: role of the mitochondrial citrate carrier. J Lipid Res. 2006;47:1994–2003.
Omega-6 polyunsaturated fatty acids prevent atherosclerosis development in
LDLr-KO mice, in spite of displaying a pro-in
fl
ammatory pro
fi
le similar to
trans
fatty acids
Roberta M. Machado
a, Edna R. Nakandakare
a, Eder C.R. Quintao
a, Patricia M. Cazita
a, Marcia K. Koike
b,
Valeria S. Nunes
a, Fabiana D. Ferreira
a, Milessa S. Afonso
a, Renata P.A. Bombo
a, Adriana Machado-Lima
a,
Francisco G. Soriano
b, Sergio Catanozi
a, Ana Maria Lottenberg
a,*aEndocrinology and Metabolism Division, Faculty of Medical Sciences of the University of Sao Paulo, Lipids Laboratory, LIM 10, SP, Brazil
bDepartment of Medicine Division of Emergency Medicine, Faculty of Medical Sciences of the University of Sao Paulo, LIM 51, SP, Brazil
a r t i c l e
i n f o
Article history:
Received 16 December 2011 Received in revised form 13 June 2012
Accepted 21 June 2012 Available online 29 June 2012
Keywords:
Fatty acids
Transfatty acids Saturated fatty acids Unsaturated fatty acids Atherosclerosis ABCA1 Inflammation
a b s t r a c t
The development of atherosclerosis and the inflammatory response were investigated in LDLr-KO mice on three high-fat diets (40% energy as fat) for 16 weeks:trans(TRANS), saturated (SAFA) oru-6
poly-unsaturated (PUFA) fats. The following parameters were measured: plasma lipids, aortic root total cholesterol (TC), lesion area (Oil Red-O), ABCA1 content and macrophage infiltration (immunohisto-chemistry), collagen content (Picrosirius-red) and co-localization of ABCA1 and macrophage (confocal microscopy) besides the plasma inflammatory markers (IL-6, TNF-a) and the macrophage inflammatory
response to lipopolysaccharide fromEscherichia coli(LPS). As expected, plasma TC and TG concentrations were lower on the PUFA diet than on TRANS or SAFA diets. Aortic intima macrophage infiltration, ABCA1 content, and lesion area on PUFA group were lower compared to TRANS and SAFA groups. Macrophages and ABCA1 markers did not co-localize in the atherosclerotic plaque, suggesting that different cell types were responsible for the ABCA1 expression in plaques. Compared to PUFA, TRANS and SAFA presented higher collagen content and necrotic cores in atherosclerotic plaques. In the artery wall, TC was lower on PUFA compared to TRANS group; free cholesterol was lower on PUFA compared to TRANS and SAFA; cholesteryl ester concentration did not vary amongst the groups. Plasma TNF-aconcentration on PUFA
and TRANS-fed mice was higher compared to SAFA. No difference was observed in IL-6 concentration amongst groups. Regarding the macrophage inflammatory response to LPS, TRANS and PUFA presented higher culture medium concentrations of IL-6 and TNF-aas compared to SAFA. The PUFA group showed
the lowest amount of the anti-inflammatory marker IL-10 compared to TRANS and SAFA groups. In conclusion, PUFA intake prevented atherogenesis, even in a pro-inflammatory condition.
!2012 Elsevier Ireland Ltd. All rights reserved.
1. Introduction
It is well documented that the quantity and type of dietary fatty acids have an important role in the development of cardiovascular disease (CVD), especially due to their impact on plasma lipids, lipoprotein metabolism[1]and inflammatory status[2].
Polyunsaturated fatty acids have beneficial effects on cardio-vascular risk[1], in part because of their hypolipidemic actions, although the underlying mechanisms are incompletely understood.
According to experimental studies[3,4]and clinical trials[1]strong association has been described between cardiovascular disease and saturated fatty acids and more pronounced with TRANS-fat consumption. Although saturated fatty acids have important intracellular functions [5], their high intake raises plasma low density lipoprotein-cholesterol (LDL-c) concentration, increasing cardiovascular risk. Moreover,transfatty acids also induce a
pro-atherogenic lipid profile and adversely decrease high density
lipoprotein cholesterol (HDL-c) concentration[1].
The anti-atherogenic properties of HDL are, in part, attributed to its role in reverse cholesterol transport (RCT) [6], and several proteins and receptors involved in this process (e.g., CETP, LDLr,
apoAI) are modulated by dietary fatty acids [7e9]. The most
important transporters implicated in the cholesterol efflux from *Corresponding author. Av. Dr Arnaldo, 455, 3rd Floor, Room 3305, 01246-000,
SP, Brazil. Tel./fax:þ55 11 3061 7263.
E-mail address:amlottenberg@uol.com.br(A.M. Lottenberg).
Contents lists available atSciVerse ScienceDirect
Atherosclerosis
j o u r n a l h o m e p a g e : w w w . e l s e v i e r . c o m / l o c a t e / a t h e r o s c l e r o s i s
0021-9150/$esee front matter!2012 Elsevier Ireland Ltd. All rights reserved. http://dx.doi.org/10.1016/j.atherosclerosis.2012.06.059
macrophages are the ATP binding cassette transporters A1 (ABCA1) and ABCG1 that work synergistically. ABCA1 transports phospho-lipids (PL) and free cholesterol (FC) onto apolipoprotein AI (apoAI), generating pre-beta HDL, whereas ABCG1 promotes cholesterol efflux from macrophages onto mature HDL particles[10].
In vitro, polyunsaturated fatty acids undesirably diminish
cellular ABCA1 content and, consequently, reduce the cell
choles-terol and phospholipid apolipoprotein-mediated RCT[11,12]. Our
previous data showed that diets enriched withtrans, saturated or polyunsaturated fatty acids did not interfere with the HDL-mediated cholesterol efflux in young adults [13]. These results suggest that the underlying mechanisms involved on the pro-atherogenic capacity oftransand saturated fatty acids seem to be related to other steps of cholesterol transport, which deserve investigation.
The inflammatory process, which contributes to the
develop-ment of atherosclerosis, is also modulated by dietary fatty acids [14]. Macrophages and foam cells in the arterial wall secrete
pro-inflammatory factors such as interleukin-6 (IL-6) and tumor
necrosis factor alpha (TNF-
a
) that increase local inflammation andcontribute to lesion progression[15]. Both saturated fatty acids[16]
andtransfatty acids are known to increase the secretion of
pro-inflammatory markers[17] whereas polyunsaturated fatty acids,
especially the
u
-3 series, can do the opposite[16].Although the many actions of different types of dietary fatty acids on cardiovascular endpoint studies have been described, the
consequences of the simultaneous impact of the inflammatory
processes and plasma lipid metabolism on the development of atherosclerosis are not yet fully elucidated.
Therefore, this study was designed to evaluate the effects of high fat diets enriched withtrans, saturated or polyunsaturated fatty acids on the concomitant impact of plasma lipids and the infl am-matory response on the development of atherosclerotic lesions in LDLr-KO mice.
2. Materials and methods
An expanded methods section is provided in theSupplementary
Material.
Animals and diet: Weaned male LDLr-KO mice with a C57BL/6
background were acquired from The Jackson Laboratory (Bar Harbor, ME, USA) and fed one of the three high-fat diets (40% of energy as fat) enriched withtrans(TRANS;n¼13), saturated (SAFA; n¼14) or polyunsaturated (PUFA;n¼14) fatty acids for 16 weeks. The diets were prepared without cholesterol addition and had similar amounts offiber, cholesterol and phytosterols. The TRANS-fat consisted of 100% partially hydrogenated soy bean oil; the SAFA-fat contained 11% olive oil, 5% soy bean oil and 84% palm oil; the PUFA-fat contained 54% sunflower oil and 46% canola oil. Gas liquid chromatography analyses (GLC) were provided by COGNIS Brazil
(TRANS-fat) and the Faculty of Pharmaceutical Science of the University of São Paulo (SAFA and PUFA-fat). The fatty acid compositions of the fats used on the diets are presented in
Supplemental Table 1.
After weaning, mice were housed (12-h light/dark cycle) in a temperature-controlled environment and allowed access to food
and waterad libitum. Mice were weighed weekly and their daily
food intake was estimated as the difference between the food offered and the residual food in the cages. After a 16-wk period, mice fasted for 12 h were anesthetized as described elsewhere[18]. Blood was drawn from the subclavian vein into 0.1% EDTA. All animal experiments and care were in accordance with the Ethics Committee of the Faculty of Medical Sciences of the University of São Paulo (CAPPesq 670/06).
After perfusion with phosphate-buffered saline (PBS), the livers and hearts, attached to the aortas, were excised and immediately frozen in liquid nitrogen and stored at#80$C.
Blood sampling and lipoprotein profile: Total cholesterol (TC) and
triglyceride (TG) analyses were carried out using enzymatic kits (Roche Diagnostics, IN, USA). The plasma lipoprotein profile was determined in aliquots (100
m
l) isolated from each mouse using fastprotein liquid chromatography (FPLC) as described elsewhere[18].
Plasma TNF-
a
and IL-6 concentrations were measured using ELISAkits (R&D Systems, Minneapolis, MN).
Atherosclerotic lesion analysis: Five to six 4
m
m-sections peranimal, 80
m
m distance from each other, were stained using OilRed-O (ORO; SigmaeAldrich, USA) to measure atherosclerosis as
previously described[19]. Throughout this study all measurements of images were carried out by a by an independent investigator unfamiliar with the experimental groups, using Qwin image anal-ysis software (Leica Imaging Systems, UK). Lesion area was expressed as the means of the areas from analyzed sections. As another measure of the degree of atherosclerotic lesion formation, the whole aorta was delipidated, and TC and free cholesterol (FC)
were determined as previously described [20]. Cholesteryl ester
(CE) was calculated as the difference between the two measure-ments. The total protein content of the residual delipidated aortic tissue was determined using BCA kit (Pierce Ins., Rockford, IL, USA).
Collagen content in the atherosclerotic plaque: Collagen content
was measured in the aortic root, where subsequent sections were stained with Picrosirius-red. Histomorphometry was performed using a digital image system (Qwin image analysis software; Leica Imaging Systems, UK), and collagenfibers were identified by their bright red (thicker fibers) or yellow (thinner fibers) appearance under circularly polarized light at 40%magnification. The collagen volume fraction (CVF, %) was expressed as the percentage of bright area per total plaque area.
Immunohistological analyses of the atherosclerotic lesions: The
immunohistochemical (IHC) analysis for ABCA1 and the macro-phage contents were determined in subsequent sections to those
Abbreviations
apoAI apolipoprotein AI
apo B apolipoprotein B
ABCA1 ATP binding cassette transporters A1
ABCG1 ATP binding cassette transporters G1
CVD cardiovascular disease
CETP cholesteryl ester transfer protein
FPLC fast protein liquid chromatography
HDL high density lipoprotein
LCAT lecithin cholesterol acyl transferase
GLC gas liquid chromatography analysis
LDLr LDL receptor
LDL low density lipoprotein
LDLr-KO LDL receptor knockout
LCAT lecithin cholesterol acyl transferase
PBS phosphate-buffered saline
PUFA diet enriched with polyunsaturated fatty acids
RCT reverse cholesterol transport
SAFA diet enriched with saturated fatty acids
TC total cholesterol
TG triacylglycerol
TRANS diet enriched withtransfatty acid
VLDL very low density lipoprotein
utilized for the atherosclerosis analysis so as to ensure the same arterial site. Briefly, sections were incubated overnight (4$C) with
primary antibodies recognizing ABCA1 (rabbit anti-mouse ABCA1, 1:500; Novus Biologicals, Littleton, CO, USA) or macrophages (rat anti-mouse CD68, 1:600; AbD Serotec, Raleigh, NC, USA), blocked for endogenous peroxidase, incubated with secondary antibodies conjugated with peroxidase (1:500; Abcam, MA, USA; and AbD Serotec, Raleigh, NC, USA) and detected with a DAB substrate kit (Vector Laboratories, CA, USA). The sections were counterstained
with Carazzi’s Hematoxylin. The stained (brown) areas were
measured utilizing Qwin image analysis software (Leica Imaging Systems, UK). The area was expressed as the mean area of the sections for 6e7 animals per group. A negative control was estab-lished by omitting the primary antibodies.
For confocal microscopy, cryostat sections (4
m
m) of the aorticroot were blocked and simultaneously incubated with polyclonal rabbit mouse ABCA1 (1:50, Novus Biologicals) and rat anti-mouse CD68 (1:400, AbD Serotec) in a dark chamber for 90 min. After washing, AlexaFluor"
633-conjugated goat anti-rabbit IgG
and AlexaFluor"
488-conjugated donkey anti-rat (Invitrogen) were utilized to detect ABCA1 and CD68, respectively, with a dual
immunofluorescent staining. The nuclei were stained using DAPI
(SigmaeAldrich). Omission of the primary antibodies was used as the negative control. The sections were observed with a Zeiss LSM 510 Meta confocal laser-scanning microscope using the corre-sponding channel detector.
Peritoneal macrophage culture and stimulation: Peritoneal
macrophages were harvested by peritoneal punction, without adding any stimulant to induce macrophage migration to the peritoneal cavity, using sterile PBS, without EDTA, pH 7.4. Cells were cultured on a 24-mm multiwell plate in RPMI medium (SigmaeAldrich) containing 10% BSA (Invitrogen), penicillin and streptomycin, and were maintained in a 5% CO2incubator at 37$C. After this period the cells were washed remaining only adhered macrophages in the plaque. Cells (0.5%106/well) were stimulated with 1
m
g/mL lipopolysaccharide (LPS) fromEscherichia coli(SigmaChemical Co., St. Louis, MO) for 24 h, and inflammatory factors
(TNF-
a
, IL-6 and IL-10) released into the culture medium wereD
E
F
G
TRANS SAFA PUFAH
0 50 100 150 200 250 µ g /m g p ro te inTC
CE
FC
*
*
*
TRANS SAFA PUFA 0 15000 30000 45000 60000 75000 90000
*
*
A B C A 1 a re a ( µ m ²)TRANS SAFA PUFA 0 15000 30000 45000 60000 75000 90000
*
*
M a c ro p h a g e a re a ( µ m ²)TRANS SAFA PUFA 0 15000 30000 45000 60000 75000 90000
*
*
L e s io n a re a ( µ m ²)TRANS SAFA PUFA 0.00 0.15 0.30 0.45 0.60
*
A B C A 1 :M a c ró fa g o r a ti oA
C
B
SAFA
TRANS
PUFA
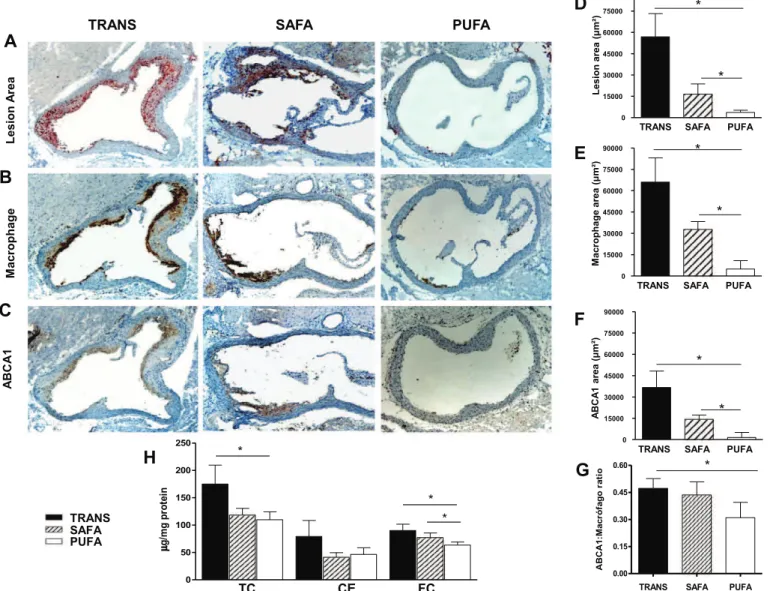
L e s io n A re a A B C A 1 M a c ro p h a g eFig. 1.Dietary fatty acids and the development of atherosclerosis. The atherosclerotic lesion area was determined in the aortas isolated from LDLr-KO mice fed a high fat diet for 16 weeks. Serial sections were analyzed for (A) lipid content using Oil Red-O stain; (B) macrophage infiltrate CD68); and (C) ABCA1 content using immunohistochemistry (anti-ABCA1). The following parameters were quantified: (D) the atherosclerotic lesion area (n¼5); (E) macrophage infiltrate (n¼7) and (F) ABCA1 content (n¼7); (G) determination of the ABCA1: macrophage ratio of the atherosclerotic plaque; (H) aortic cholesterol content in whole aortas (n¼8e13) isolated from LDLr-KO mice fed either a TRANS, SAFA or PUFA
diet for 16 weeks; *p<0.05, **p<0.001. Data were checked for normality and transformation was performed prior to statistical analysis. One-way ANOVA followed by thepost-hoc
NewmaneKeuls Multiple Comparison Test for pair-wise comparisons was performed. Results are shown as the mean&SEM. R.M. Machado et al. / Atherosclerosis 224 (2012) 66e74
measured using a commercial ELISA kit (R&D Systems, Minneap-olis, MN).
Statistical analysis: The data were checked for normality and
appropriate transformation were performed when necessary, prior
to statistical analysis. One-way ANOVA followed by thepost-hoc
NewmaneKeuls Multiple Comparison Test for pair-wise
compari-sons was performed. The correlations were calculated using a Spearman Test. A value ofp<0.05 was considered statistically
significant. The data were analyzed with the GraphPad Prism
software (GraphPad Software Inc., San Diego, CA). Untransformed data are presented in thefigures, tables and text as the mean&SD or SEM.
3. Results
The dietary intake did not differ among the groups. However, animals on the TRANS diet gained significantly less weight during the 16 weeks period than the other groups (weight gain (g): TRANS: 17.17&1.86, SAFA: 19.26&3.24 and PUFA: 20.44&3.46;p<0.05).
3.1. Dietary fatty acids and the development of atherosclerosis
PUFA-fed mice presented the lowest amount of lipids in the
arterial wall, intima macrophage infiltration and ABCA1 content
compared to the SAFA and TRANS-fed mice (Fig. 1AeF).
The atherosclerotic plaque ABCA1: macrophage ratio for the PUFA-fed mice was lower than in the TRANS-fed mice but did not differ from the SAFA-fed mice (Fig. 1G).
Regarding the cholesterol content of the artery wall, TC was lower with PUFA feeding than with TRANS but did not differ from the SAFA feeding. Free cholesterol (FC) was lower in PUFA-fed mice compared to TRANS and SAFA groups; cholesteryl ester (CE) did not vary among the groups (Fig. 1H). The TC on the aorta was positively
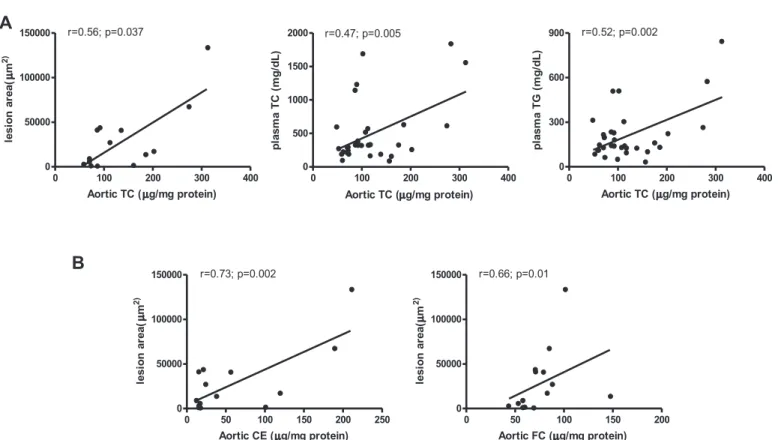
correlated with lesion area (r¼0.56,p¼0.037), plasma TC (r¼0.47, p¼0.005), and plasma TG (r¼0.52,p¼0.002); lesion area was positively correlated with CE and FC of the total aorta (r¼0.73, p¼0.002 andr¼0.66,p¼0.01, respectively) (Fig. 2).
The liver expression of ABCA1 has a primordial role in HDL
biogenesis [21] and consequently on the prevention of
athero-sclerosis[22]. However, in the present study, the intake of diets enriched with TRANS, SAFA or PUFA had similar effects on ABCA1
mRNA expression in the livers of the LDLr-KO mice (Supplemental
Fig. 1).
3.2. Localization of ABCA1 and macrophages on the atherosclerotic plaque
Immunohistochemical analyses suggested that ABCA1 and macrophage expression were found in the same region of the atherosclerotic plaque (Supplemental Fig. 2). However, the dual immunofluorescent staining (Fig. 3), in serial sections, did not show co-localization of macrophages and ABCA1 in the plaques. This suggested that although some expression of ABCA1 can be attrib-uted to macrophages (CD68 positive cells), other cells types are likely responsible for the majority of the ABCA1 expression in the plaque.
3.3. Plasma lipids and lipoprotein profile
The PUFA group had the lowest plasma TC and TG concentration compared to TRANS- and SAFA-fed mice. TRANS-fed mice
devel-oped severe hypercholesterolemia and hypertriglyceridemia
(Table 1). A greater atherogenic lipid profile was observed in the
TRANS group because of the higher amount of cholesterol trans-ported in non-HDL particles (94%), with 67% in VLDL and only 6% in HDL (Table 1). Moreover, the TRANS diet induced a higher VLDL-TG
0 100 200 300 400
0 50000 100000
150000 r=0.56; p=0.037
Aortic TC ( g/mg protein)
le s io n a re a ( m 2 )
0 100 200 300 400
0 500 1000 1500
2000 r=0.47; p=0.005
Aortic TC ( g/mg protein)
p la s m a T C ( m g /d L )
0 100 200 300 400
0 300 600
900 r=0.52; p=0.002
Aortic TC ( g/mg protein)
p la s m a T G ( m g /d L )
0 50 100 150 200
0 50000 100000
150000 r=0.66; p=0.01
Aortic FC ( g/mg protein)
le s io n a re a ( m 2 )
0 50 100 150 200 250
0 50000 100000
150000 r=0.73; p=0.002
Aortic CE ( g/mg protein)
le s io n a re a ( µ µ µ µ µ µ µ µ m 2 )
A
B
Fig. 2.Correlations between (A) aortic total cholesterol (TC) with lesion area, plasma TC and plasma TG concentration: the aortic TC content was positively correlated with lesion area, plasma TC and plasma TG; (B) aortic cholesteryl ester (CE) and free cholesterol (FC) with lesion areas.