Ten genes and two topologies: an
exploration of higher relationships in
skipper butterflies (Hesperiidae)
Ranjit Kumar Sahoo1, Andrew D. Warren2, Niklas Wahlberg3,4, Andrew V. Z. Brower5, Vladimir A. Lukhtanov6,7and Ullasa Kodandaramaiah1 1School of Biology, Indian Institute of Science Education and Research Thiruvananthapuram,
Thiruvananthapuram, Kerala, India
2McGuire Center for Lepidoptera and Biodiversity, Florida Museum of Natural History, University of Florida, UF Cultural Plaza, Gainesville, FL, USA
3Department of Biology, Lund University, Lund, Sweden 4Department of Biology, University of Turku, Turku, Finland
5Evolution and Ecology Group, Department of Biology, Middle Tennessee State University, Murfreesboro, TN, USA
6Department of Insect Systematics, Zoological Institute of Russian Academy of Sciences, St. Petersburg, Russia
7Department of Entomology, St. Petersburg State University, St. Petersburg, Russia
ABSTRACT
Despite multiple attempts to infer the higher-level phylogenetic relationships of skipper butterflies (Family Hesperiidae), uncertainties in the deep clade relationships persist. The most recent phylogenetic analysis included fewer than 30% of known genera and data from three gene markers. Here we reconstruct the higher-level relationships with a rich sampling of ten nuclear and mitochondrial markers (7,726 bp) from 270 genera and find two distinct but equally plausible topologies among subfamilies at the base of the tree. In one set of analyses, the nuclear markers suggest two contrasting topologies, one of which is supported by the mitochondrial dataset. However, another set of analyses suggests mito-nuclear conflict as the reason for topological incongruence. Neither topology is strongly supported, and we conclude that there is insufficient phylogenetic evidence in the molecular dataset to resolve these relationships. Nevertheless, taking morphological characters into consideration, we suggest that one of the topologies is more likely.
Subjects Entomology, Evolutionary Studies, Taxonomy, Zoology
Keywords Skipper butterflies, Hesperiidae, Phylogeny, Contrasting topologies, Incongruence
INTRODUCTION
A robust phylogeny is the key to understanding historical macroevolutionary processes that have shaped extant diversity. For instance, a phylogenetic hypothesis is needed to address questions regarding patterns of morphological evolution, coevolution, and historical biogeography, as well as for a higher-level classification system. Among invertebrates, butterflies have been the most popular study systems in evolutionary biology (Boggs, Watt & Ehrlich, 2003). Relationships among and within butterfly families have been largely studied by phylogenetic analyses of DNA sequence data (Campbell, Brower & Pierce, 2000;Caterino et al., 2001;Braby, Vila & Pierce, 2006;
Submitted24 May 2016
Accepted4 October 2016
Published6 December 2016
Corresponding author
Ranjit Kumar Sahoo, [email protected]
Academic editor
Marta Riutort
Additional Information and Declarations can be found on page 11
DOI10.7717/peerj.2653
Copyright
2016 Sahoo et al.
Distributed under
Nazari, Zakharov & Sperling, 2007;Wahlberg et al., 2009;Simonsen et al., 2011;Heikkila¨ et al., 2012;Wahlberg et al., 2014;Espeland et al., 2015). Yet, the higher-level relationships among skipper butterflies, with more than 4,000 species in about 567 genera (Warren, Ogawa & Brower, 2008) and representing a fifth of the world’s butterfly fauna ( Herna´ndez-Rolda´n et al., 2014), are still unsatisfactorily resolved.
Until recently, the higher-level classification of the family that has been generally followed was that proposed byEvans (1949)based on morphological characters. However, a major problem with skipper systematics is the remarkable uniformity of morphological structure among skipper taxa, which makes phenotype-based grouping extremely challenging (Voss, 1952;Warren, Ogawa & Brower, 2008). Following multiple attempts over the last several decades (Voss, 1952;Ackery, 1984;Scott, 1985;Scott & Wright, 1990;
Chou, 1994;Chou, 1999;Mielke, 2005), a recent study employing molecular data suggested a classification that included five subfamilies (Warren, Ogawa & Brower, 2008). This classification relied on analyses of one mitochondrial and two nuclear markers, a dataset of 2,085 bp. A subsequent analysis that added morphological data (49 characters) to the same molecular data led to a revised classification that included seven subfamilies (Warren, Ogawa & Brower, 2009).
Warren, Ogawa & Brower (2008,2009)used Maximum Parsimony analyses with nodal support estimated through Bremer Support values (Bremer, 1994). Despite some strongly supported monophyletic taxa being recovered, many putative higher clades were unresolved. Specifically, uncertainty remained about relationships among the major clades within the subfamily Pyrginae. Furthermore, support for relationships among the monophyletic subfamilies Heteropterinae, Trapezitinae and Hesperiinae was weak to moderate. The status of Euschemoninae as sister to rest of the family, except Coeliadinae, received very low nodal support (Bremer support = 1), although this placement is corroborated by the early developmental characters of Euschemoninae, which are similar to those of Coeliadinae and Eudaminae (Warren, Ogawa & Brower, 2009).
Yuan et al. (2015)investigated relationships among a small subset of hesperiid taxa— 23 genera from China—using 1,458 bp of mitochondrial sequence data. Their Maximum Likelihood (ML) tree also indicated uncertainty in the position of Eudaminae and Pyrginae. Another study based on complete mitochondrial genomes of six skipper butterflies representing five subfamilies (sensuWarren, Ogawa & Brower, 2009) failed to support the monophyly of Pyrginae (Kim et al., 2014).
In summary, existing studies on the higher-level relationships within this speciose butterfly family have indicated significant conflicts (Warren, Ogawa & Brower, 2008;
(Wolf et al., 2002;Rokas et al., 2003a) or, (f) a near-hard polytomy due to a rapid radiation (Kodandaramaiah et al., 2010).
In order to bring further understanding to the higher-level phylogeny of skipper butterflies, we assembled sequences of 10 gene regions from 270 genera and analyzed a 7,726 bp dataset using both parsimony and model-based tree reconstruction methods. We also compiled the complete mitochondrial genome of 15 skipper species across five subfamilies from GenBank to compare the tree from the mitochondrial genome with that of single mitochondrial and combined nuclear genes. Consistent with the existing conflict across studies (Warren, Ogawa & Brower, 2008;Warren, Ogawa & Brower, 2009;
Kim et al., 2014;Yuan et al., 2015), our analyses showed conflicting topologies at the deeper nodes of the phylogeny. To understand the reasons for the uncertainty in the phylogenetic estimation, we followed an integrative approach with systematic data encoding and tree comparison.
METHODS
Taxon and gene sampling
Our analyses were based on 311 ingroup specimens representing 270 hesperiid genera and 12 outgroup taxa (five Papilionidae, two Hedylidae and five Pieridae). This dataset builds on the previous study byWarren, Ogawa & Brower (2009)that included sequences of three protein-coding genes (mtDNA COI, EF1a and wingless). We sequenced an additional part of COI and seven more genes (ArgKin, CAD, GAPDH, IDH, MDH, RpS2 and RpS5) using protocols and primers from Wahlberg & Wheat (2008). A new primer pair was designed (Table S1) to amplify the gene IDH for certain taxa. We have also included 96 additional specimens representing 71 genera to the present analyses. Our taxon sampling accounts for 60–70% of the genera of Coeliadinae (six genera), Eudaminae (38 genera), Heteropterinae (seven genera), and Trapezitinae (11 genera); 40–50% of Pyrginae (73 genera) and Hesperiinae (134 genera), and 100% of
Euschemoninae (one genus). The sequences for outgroups were acquired from GenBank. We included the morphological, behavioral and ecological data matrix used in Warren, Ogawa & Brower (2009)in certain analyses. The sequences generated during this study were deposited in GenBank. The molecular data matrix in our study comprised 7,726 characters, more than three times that of the previous dataset (Warren, Ogawa & Brower, 2008;Warren, Ogawa & Brower, 2009).
Dataset encoding
Along with the analysis of the concatenated dataset (nt_123), we generated context specific datasets from the concatenated gene matrix for various analyses designed to identify potential sources of conflict and/or poor nodal support. In one analysis, accounting for the impact of compositional heterogeneity, we assigned ambiguity to all the sites that potentially experience synonymous change (degen_1) (Regier et al., 2010;
3rd codon positions (Fig. S1). To account for substitution saturation and degeneracy, we removed the 3rd codon positions and the 1st codon positions coding for Arginine or Lysine (noLRall1 + nt2) (Regier et al., 2008). In further analyses, we removed the 3rd coding positions from the concatenated dataset (nt_12) or only from the mitochondrial genes (nuclear_123 + CO_12).
We also analyzed all the nuclear genes together (nuclear_123) and reconstructed multi-gene and single-gene trees for comparison. In subsequent analyses, we also combined the morphological, ecological and behavioral characters fromWarren, Ogawa & Brower (2009)with certain molecular datasets—nt_123 and nuclear_123. In addition, we analyzed an assembly of all protein coding sequences (13 genes) from the mitochondrial genomes of 15 skipper butterflies acquired from GenBank.
Phylogenetic analyses
We performed Maximum Parsimony analyses in TNT v.1.1 (Goloboff, Farris & Nixon, 2008) using ‘New Technology’ searches (Goloboff, 1999;Nixon, 1999) (consisting of tree fusion, sectorial search, ratchet and tree drift) with 1,000 random addition replicates; nodal supports were derived from 1,000 bootstrap replicates (Felsenstein, 1985). For ML and Bayesian Inference (BI) analyses, we used RAxML v8 (Stamatakis, 2014) and MrBayes v3.2 (Ronquist et al., 2012), respectively, on the XSEDE web server through the CIPRES Science gateway (Miller, Pfeiffer & Schwartz, 2010). For ML analyses, we used the GTR model of substitution with gamma model of rate heterogeneity (GTR+G) and different partition schemes, either gene-based or based on rates of evolution calculated by the program Tree Independent Generation of Evolutionary Rates (TIGER) (Cummins & McInerney, 2011). In gene-based partitions each gene was considered as a separate partition, while in TIGER-based partitions, the characters were binned together based on their rate of evolution regardless of gene origin (used as a partitioning strategy in
Rota & Wahlberg, 2012). TIGER partitions for the dataset were derived from the program TIGER v1.02 that calculates relative rates of evolution of each site in an alignment (Cummins & McInerney, 2011). The data were then divided into seven partitions based on the relative rates using an algorithm developed by Tobias Malm (J. Rota, T. Malm & N. Wahlberg, 2016, unpublished data) such that the first partition consisted of the invariant and very slowly evolving sites and the last partition consisted of sites evolving very quickly. To check whether model selection had any impact on the tree reconstruction, we also performed the above ML analyses using the best fitted model from PartitionFinder v1.1.1 (Lanfear et al., 2012) (detail inFig. S2). For each ML analyses, the node supports were computed from 1,000 bootstrap replicates. Single-gene matrices were analyzed with GTR+G model and the node supports were derived from 500 bootstrap replicates. For single-gene analyses, we dropped the taxa for which the corresponding gene sequence was not available. For the mitogenome analysis, we performed ML tree searches with codon-based partitions and estimated the nodal support from 100 bootstraps.
implemented in MrBayes 3.2 (Ronquist et al., 2012). We assigned the gamma model of rate heterogeneity to all the partitions; the first partition was additionally assigned a proportion of invariable sites. The program MrBayes was set to estimate the base frequencies and shape parameters from the data. Two independent runs with two chains per run were performed for∼30 million generations, sampling trees every 10,000
generations. The convergence of independent runs was analyzed from the values of potential scale reduction factors (PSRF) (PSRF close to one determines convergence) (Gelman & Rubin, 1992); we also checked the plots of log-likelihoods and other parameters on Tracer v1.6 (Rambaut et al., 2014).
Tree comparison
To investigate the differences among the trees from multiple analyses, we compared the trees (except single-gene trees) for their topological incongruence with and without the likelihood scores. While the non likelihood-based incongruence test reflects
differences in branching patterns among the topologies, the likelihood-based comparison calculates the difference between competing hypotheses with distinct topologies for a given dataset (Planet, 2006). For the non likelihood-based tree comparison at the deep level divergences, we used a Lento plot to depict the conflict among different trees in a two-dimensional graph (Lento et al., 1995). We employed the approximate unbiased (AU) test (Shimodaira, 2002) for likelihood-based tree comparisons. To check for incongruence among gene trees, we used partitioned bremer support (PBS) analysis that examines the contribution of each gene partition to the topological support of the consensus tree (Baker & DeSalle, 1997).
RESULTS
Multilocus tree estimation
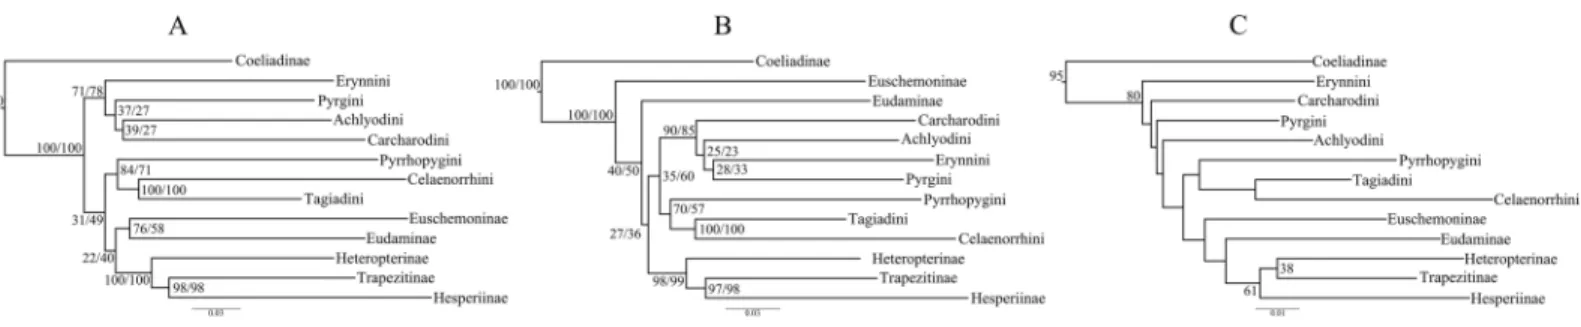
Trees from the concatenated dataset, irrespective of parsimony or ML analysis or the partition scheme used, showed identical relationships among the early branches representing the major clades (sensuWarren, Ogawa & Brower, 2009) (Fig. 1A)— (i) Coeliadinae was sister to the rest of the family, (ii) Pyrginae was paraphyletic, (iii) Euschemoninae was sister to Eudaminae, and (iv) Heteropterinae, Trapezitinae and Hesperiinae were all monophyletic. The topology remained unchanged even after the addition of morphological characters to the concatenated dataset.
However, the ML trees from the combined nuclear dataset (nuclear_123) showed a contrasting topology (Fig. 1B) to that of the concatenated dataset, irrespective of the partitioning scheme: Pyrginae was monophyletic and Euschemoninae was sister to rest of Hesperiidae except Coeliadinae. The topology remained unchanged with the addition of morphological characters to the dataset (nuclear_123 + morph) as well as analyses of the subsets of the combined nuclear matrix (7gene_123, 8gene_123).
ML analyses of non-degenerated datasets (nt_12, degen_1, noLRall1 + nt2) resulted in unresolved tree topologies indicating insufficient phylogenetic signal in the 1st and 2nd codon positions of the dataset (Fig. 1C).
BI analysis of the concatenated dataset showed a topology similar to that ofFig. 1B with a few changes (detail inFig. S3). Randomly sampled 100 trees from the MCMC generations, after discarding burnin, showed the presence of only one topology (as in Fig. 1B); however, a very low proportion (6%) of an alternate topology (as inFig. 1A) was found in one of the runs.
Tree comparison
To test whether multiple tree topologies across ML analyses are equally likely given the datasets, we performed an AU test (Shimodaira, 2002) for both the concatenated and combined nuclear datasets independently. The AU test, without any partitioning scheme, rejected (p < 0.0001) the tree topologies from the non-degenerate datasets (nt_12, degen_1, noLRall1 + nt_2). Hence, we dropped the trees from non-degenerate data sets from further analyses of tree topological similarity at higher taxonomic levels. However, two distinct topologies (Figs. 1Aand1B) were accepted as significant trees (p > 0.05) for the combined nuclear dataset, whereas only one topology (Fig. 1A) was significant (p > 0.05) for the concatenated dataset.
A visual comparison of the two distinct tree topologies (Figs. 1Aand1B) showed that all the subfamily clades (sensuWarren, Ogawa & Brower, 2009) except Pyrginae were monophyletic (BS > 98). Pyrginae was recovered either as monophyletic (BS = 7–60) or paraphyletic. Similarly, Euschemoninae and Eudaminae were either sisters (BS = 58–76) or non-sisters. However, due to the presence of low BS values (<76) in six out of 13 deep nodes across the analyses, we were uncertain whether there existed significant conflict among different tree topologies.
Mito-genomic analysis
five out of 14 internal nodes. The lowest BS (= 32) was obtained for the node containing Eudaminae, the lineages of Pyrginae and the common ancestor of Heteropterinae and Hesperiinae. The node that placed Eudaminae as sister to one of the Pyrginae clades had BS = 42.
We found that the tree topology from the mitogenomic analysis corroborated the deep splits found in the COI gene tree; Eudaminae nested within Pyrginae rendering the latter paraphyletic, which was also the case for the concatenated dataset.
Multiple plausible tree topologies
The presence of multiple tree topologies was not limited to the dataset-specific analyses. Regardless of the partitioning scheme or the dataset (concatenated and combined nuclear dataset) used, almost equal numbers of contrasting tree topologies were present
among the ML-bootstrap trees across multiple analyses (seeFig. S5); hence, it is likely that the topology of the best ML tree is one among two equally likely topologies.
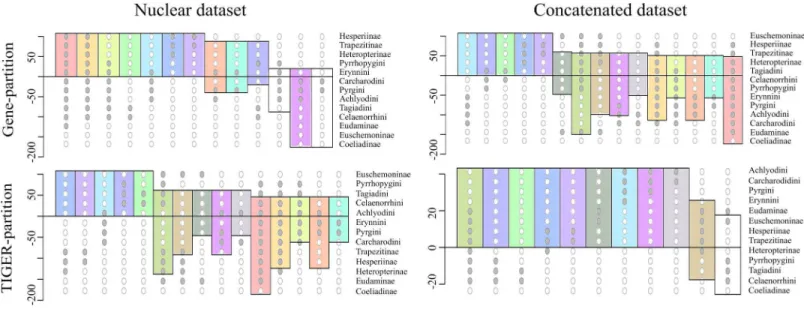
To investigate this further, we extracted 105 model-optimized trees from each of the ML analyses of the concatenated (nt_123) and combined nuclear (nuclear_123) data, separately from datasets with both partitioning schemes (gene partitions and TIGER partitions). The clades in the resulting trees were collapsed to the subfamily level except Pyrginae, which was collapsed to the level of tribes (sensu Warren, Ogawa & Brower, 2009), and were plotted on a Lento plot (Fig. 2) to check for support and conflict for each split. We observed conflicting splits among the trees from the combined nuclear dataset with TIGER partitions, which indicated the presence of multiple topologies; however, trees from the concatenated dataset had no conflicting splits, indicating a single topology. But the case was different when gene partitions were used—multiple topologies resulted from the concatenated dataset and only one of these topologies was recovered from the combined nuclear dataset. The AU test showed equal tree likelihoods (p > 0.05) for multiple topologies for both concatenated and combined nuclear datasets given the respective partition schemes as explained above.
Thus, we found two contrasting tree topologies, respectively supporting (i) monophyly of Pyrginae and non-sister status of Eudaminae and Euschemoninae, and (ii) paraphyly of Pyrginae and sister status of Eudaminae and Euschemoninae. In addition, we noticed that the position of Eudaminae with respect to Pyrginae varied across these contrasting topologies. While Eudaminae was sister to all Hesperiidae except Coeliadinae and Euschemoninae in the former, the latter topology indicated that Eudaminae was sister to the clade containing Heteropterinae, Trapezitinae and Hesperiinae.
congruency for the deeper clades and reanalyzed, expecting an improvement of nodal support and consistency in signal. For example, we combined all those gene markers from which Pyrginae was recovered as monophyletic and expected an improved BS for the Pyrginae clade in the gene cluster analysis. As expected, this gene cluster recovered Pyrginae as monophyletic with higher node support (BS = 80). However, none of the gene clusters recovered the non-sister status of Eudaminae and Euschemoninae even though their sister status was poorly supported in all the gene cluster analyses (Fig. S6). This pattern of incongruence is not an artifact of missing data in our dataset, because sequential removal of taxa with 80–40% of missing data from the analyses changed neither the topology nor the support values at deeper nodes (Table S2); however, such sequential removal gradually reduced the proportion of alternate tree topologies in the tree set from best ML tree search (Fig. S7). Hence, we could not accept the hypothesis that the two contrasting tree topologies are due to incongruence in gene histories; this is also evident from PBS analysis where no pattern of incongruence among gene trees were observed (Fig. S8).
DISCUSSION
signals for the relationships among major clades, clustered them based on their topological congruence and reanalyzed to check for consistency.
Conflicting topologies?
Our analyses indicate the occurrence of two equally likely deep tree topologies (Figs. 1Aand1B). Interestingly, the proximate reasons for the occurrence of these contrasting topologies appear to vary depending on the partitioning scheme used for the analysis. However, neither topology was strongly supported in any analysis and the results from our explorations of incongruence among gene histories were not conclusive. Gene cluster analyses improved the nodal support for the monophyly of Pyrginae but were unable to recover the sister status of Eudaminae and Euschemoninae with good support. Similarly, from the PBS analysis, no pattern of incongruence in gene histories was observed. We conclude that there is insufficient information in the molecular dataset to resolve these relationships despite the extensive taxonomic sampling and large number of molecular characters.
The presence of conflicting topologies has also been reported from many other studies across plants (Soltis, Soltis & Zanis, 2002;Burleigh & Mathews, 2004;Ruhfel et al., 2014) and animals (Rokas et al., 2003a;Song et al., 2012). The possible reasons for topological incongruency are phylogenetic noise or conflict among gene trees (Smith et al., 2015). In case of the former, a concatenation approach is expected to give a better result (Rokas et al., 2003b;Smith et al., 2015). In the latter case, where the conflict is presumed to be a result of gene flow across taxa or incomplete lineage sorting, coalescence based methods have been used for tree reconstruction (Jarvis et al., 2014;Xi et al., 2014;
Smith et al., 2015). However, there was very low node supports across gene trees, indicating that strong conflict across genes does not explain the patterns found here. We predict that a phylogenomic approach would provide a better outlook to this conflicting scenario or resolve the phylogeny, as such an approach has proved instrumental in other studies (Dunn et al., 2008;Kocot et al., 2011;Smith et al., 2011;
Johnson et al., 2013;Jarvis et al., 2014;Richart, Hayashi & Hedin, 2016).
Systematic implications
Our study confirmed that all the subfamilies, possibly except Pyrginae, are monophyletic and received high BS support across multiple analyses. We are uncertain about the monophyly of Pyrginae, as our study reveals homoplastic character distributions that could potentially be explained by the occurrence of ancestral introgression among its early lineages. Hence, when a certain combination of genes was used for phylogenetic
Figure 3 The ML trees from a reduced dataset.The ML trees from the analyses of (A) the concatenated dataset with gene partitions, and (B) the combined nuclear dataset with gene partitions.Clito,Eracon
Pyrginae, is generally supported by morphology. We suggest that the relationships shown in Fig. 1B(also inFig. 3B) should be used as the preferred phylogenetic hypothesis until a better-resolved phylogeny is available.
In addition, we observed unexpected placement of a few taxa within Pyrginae. For instance,Eracon, which was previously classified under Pyrgini (Warren, Ogawa & Brower, 2009), was found herein to group with Achlyodini. Likewise,Clitogrouped within either Pyrgini or Erynnini based on dataset specific analyses. Moreover, we note that bothClitoandEraconsequences in our dataset have >70% missing sites. Hence, it is likely that the presence of insufficient informative sites within these taxa might influence their true positions in the phylogeny (Wiens, 2003;Wiens & Morrill, 2011). Therefore, for systematic implications, we prunedClito,Eraconand three additional taxa with a large percentage of missing data from the dataset and reanalysed with gene partitions (Fig. 3). We observed no change in tree topology or node support values as a result of pruning these taxa. Hence, although they may appear on the tree in unorthodox positions, it is unlikely that presence of these taxa has any impact on our interpretation of higher-level relationships in the dataset as a whole.
We observed that the genusCabirus, previously included within Eudaminae, grouped within Achlyodini (subfamily Pyrginae). Further study of the morphology ofCabirusis needed to corroborate this placement, although its position outside of Eudaminae seems to be correct. Three tribes within Hesperiinae—Aeromachini, Taractrocerini and Baorini—are monophyletic with high BS values. However, we are uncertain about the phylogenetic status of other proposed tribes within Hesperiinae due to prevalence of low BS values along the short internal branches. This indicates the possible occurrences of rapid ancestral radiation within Hesperiinae and needs further investigation.
CONCLUSIONS
With a broad coverage of all known subfamilies, we present the higher-level relationships among skipper butterflies. Our analyses suggest possible conflicting topologies with respect to (i) monophyly or paraphyly of Pyrginae and (ii) sister or non-sister status of Eudaminae and Euschemoninae. However, none of the topologies resulting from our alternative analyses is strongly supported, and incongruences in signal among genes cannot satisfactorily resolve these differences. We surmise that there is insufficient phylogenetic information in the current dataset to resolve these relationships. It is unlikely that adding data from a few more genes will improve the results, but data from entire genomes may result in a better-resolved phylogeny. However, taking morphological characters into consideration, we suggest one of the topologies as most likely (Figs. 1B and3B), and that this topology will aid in future studies on this group.
ADDITIONAL INFORMATION AND DECLARATIONS
Funding
and the Russian Foundation for Basic Research. Vladimir A. Lukhtanov was supported by the grant N 14-14-00541 from the Russian Science Foundation. Ranjit Kumar Sahoo was supported by a research fellowship from Council of Scientific and Industrial Research, India. The funders had no role in study design, data collection and analysis, decision to publish, or preparation of the manuscript.
Grant Disclosures
The following grant information was disclosed by the authors: Department of Science and Technology: DST-RFBR-P-155. The Russian Science Foundation: 14-14-00541.
Council of Scientific and Industrial Research, India.
Competing Interests
The authors declare that they have no competing interests.
Author Contributions
Ranjit Kumar Sahoo conceived and designed the experiments, performed the experiments, analyzed the data, wrote the paper, prepared figures and/or tables, reviewed drafts of the paper.
Andrew D. Warren conceived and designed the experiments, performed the
experiments, analyzed the data, contributed reagents/materials/analysis tools, wrote the paper, reviewed drafts of the paper.
Niklas Wahlberg conceived and designed the experiments, analyzed the data, contributed reagents/materials/analysis tools, wrote the paper, reviewed drafts of the paper.
Andrew V.Z. Brower analyzed the data, contributed reagents/materials/analysis tools, wrote the paper, reviewed drafts of the paper.
Vladimir A. Lukhtanov conceived and designed the experiments, contributed reagents/ materials/analysis tools, wrote the paper, reviewed drafts of the paper.
Ullasa Kodandaramaiah conceived and designed the experiments, performed the experiments, analyzed the data, contributed reagents/materials/analysis tools, wrote the paper, reviewed drafts of the paper.
DNA Deposition
The following information was supplied regarding the deposition of DNA sequences: GenBank:KX947011–KX947012,KX947014–KX947266,KY014330–KY014419, KY019648–KY020025,KY027462–KY028742,KY045507–KY045764.
Data Deposition
The following information was supplied regarding data availability: The raw data has been supplied asSupplemental Dataset Files.
Supplemental Information
REFERENCES
Ackery PR. 1984.Systematic and faunistic studies on butterflies. In: Vane-Wright RI, Ackery PR, eds.The Biology of Butterflies. London: Academic Press, 9–21.
Baker RH, DeSalle R. 1997.Multiple sources of character information and the phylogeny of Hawaiian drosophilids.Systematic Biology46(4):654–673DOI 10.1093/sysbio/46.4.654.
Boggs CL, Watt WB, Ehrlich PR, eds. 2003.Butterflies: Ecology and Evolution Taking Flight. Chicago: University of Chicago Press, 739pp.
Braby MF, Vila R, Pierce NE. 2006.Molecular phylogeny and systematics of the Pieridae (Lepidoptera: Papilionoidea): higher classification and biogeography.Zoological Journal of the Linnean Society147(2):239–275DOI 10.1111/j.1096-3642.2006.00218.x.
Bremer K. 1994.Branch support and tree stability.Cladistics10(3):295–304
DOI 10.1111/j.1096-0031.1994.tb00179.x.
Burleigh JG, Mathews S. 2004. Phylogenetic signal in nucleotide data from seed plants: implications for resolving the seed plant tree of life.American Journal of Botany
91(10):1599–1613DOI 10.3732/ajb.91.10.1599.
Campbell DL, Brower AVZ, Pierce NE. 2000.Molecular evolution of thewinglessgene and its implications for the phylogenetic placement of the butterfly family Riodinidae (Lepidoptera: Papilionoidea).Molecular Biology and Evolution17(5):684–696
DOI 10.1093/oxfordjournals.molbev.a026347.
Caterino MS, Reed RD, Kuo MM, Sperling FAH. 2001.A partitioned likelihood analysis of swallowtail butterfly phylogeny (Lepidoptera: Papilionidae).Systematic Biology
50(1):106–127DOI 10.1080/10635150119988.
Chou I. 1994.Monographia Rhopalocerorum Sinensium. Zhengzhou: Henan Scientific and Technological Publishing House.
Chou I. 1999.Classification and Identification of Chinese Butterflies. Zhengzhou: Henan Scientific and Technological Publishing House.
Cummins CA, McInerney JO. 2011. A method for inferring the rate of evolution of homologous characters that can potentially improve phylogenetic inference, resolve deep divergence and correct systematic biases. Systematic Biology 60(6):833–844
DOI 10.1093/sysbio/syr064.
Dunn CW, Hejnol A, Matus DQ, Pang K, Browne WE, Smith SA, Seaver E, Rouse GW, Obst M, Edgecombe GD, Sørensen MV, Haddock SHD, Schmidt-Rhaesa A, Okusu A, Kristensen RM, Wheeler WC, Martindale MQ, Giribet G. 2008.Broad phylogenomic sampling improves resolution of the animal tree of life.Nature452(7188):745–749DOI 10.1038/nature06614.
Eckert AJ, Carstens BC. 2008.Does gene flow destroy phylogenetic signal? The performance of three methods for estimating species phylogenies in the presence of gene flow.Molecular Phylogenetics and Evolution49(3):832–842DOI 10.1016/j.ympev.2008.09.008.
Espeland M, Hall JPW, DeVries PJ, Lees DC, Cornwall M, Hsu Y-F, Wu L-W, Campbell DL, Talavera G, Vila R, Salzman S, Ruehr S, Lohman DJ, Pierce NE. 2015.Ancient Neotropical origin and recent recolonisation: phylogeny, biogeography and diversification of the
Riodinidae (Lepidoptera: Papilionoidea).Molecular Phylogenetics and Evolution93:296–306
DOI 10.1016/j.ympev.2015.08.006.
Evans WH. 1949.A Catalogue of the Hesperiidae from Europe, Asia, and Australia in the British Museum (Natural History). London: British Museum.
Felsenstein J. 1985. Phylogenies and the comparative method.The American Naturalist
Gelman A, Rubin DB. 1992.Inference from iterative simulation using multiple sequences. Statistical Science7(4):457–472DOI 10.1214/ss/1177011136.
Goloboff PA. 1999.Analyzing large data sets in reasonable times: solutions for composite optima. Cladistics15(4):415–428DOI 10.1111/j.1096-0031.1999.tb00278.x.
Goloboff PA, Farris JS, Nixon KC. 2008.TNT, a free program for phylogenetic analysis. Cladistics24(5):774–786DOI 10.1111/j.1096-0031.2008.00217.x.
Heikkila¨ M, Kaila L, Mutanen M, Pen˜a C, Wahlberg N. 2012.Cretaceous origin and repeated tertiary diversification of the redefined butterflies.Proceedings of the Royal Society B: Biological Sciences279(1731):1093–1099DOI 10.1098/rspb.2011.1430.
Herna´ndez-Rolda´n JL, Bofill R, Dapporto L, Munguira ML, Vila R. 2014.Morphological and chemical analysis of male scent organs in the butterfly genus Pyrgus (Lepidoptera: Hesperiidae). Organisms Diversity & Evolution14(3):269–278DOI 10.1007/s13127-014-0170-x.
Huelsenbeck JP, Larget B, Alfaro ME. 2004.Bayesian phylogenetic model selection using reversible jump markov chain monte carlo.Molecular Biology and Evolution21(6):1123–1133
DOI 10.1093/molbev/msh123.
Jarvis ED, Mirarab S, Aberer AJ, Li B, Houde P, Li C, Ho SYW, Faircloth BC, Nabholz B, Howard JT, Suh A, Weber CC, da Fonseca RR, Li J, Zhang F, Li H, Zhou L, Narula N, Liu L, Ganapathy G, Boussau B, Bayzid MS, Zavidovych V, Subramanian S, Gabaldo´n T, Capella-Gutie´rrez S, Huerta-Cepas J, Rekepalli B, Munch K, Schierup M, Lindow B, Warren WC, Ray D, Green RE, Bruford MW, Zhan X, Dixon A, Li S, Li N, Huang Y, Derryberry EP, Bertelsen MF, Sheldon FH, Brumfield RT, Mello CV, Lovell PV, Wirthlin M, Schneider MPC, Prosdocimi F, Samaniego JA, Velazquez AMV,
Alfaro-Nu´n˜ez A, Campos PF, Petersen B, Sicheritz-Ponten T, Pas A, Bailey T, Scofield P, Bunce M, Lambert DM, Zhou Q, Perelman P, Driskell AC, Shapiro B, Xiong Z,
Zeng Y, Liu S, Li Z, Liu B, Wu K, Xiao J, Yinqi X, Zheng Q, Zhang Y, Yang H,
Wang J, Smeds L, Rheindt FE, Braun M, Fjeldsa J, Orlando L, Barker FK, Jønsson KA, Johnson W, Koepfli K-P, O’Brien S, Haussler D, Ryder OA, Rahbek C, Willerslev E, Graves GR, Glenn TC, McCormack J, Burt D, Ellegren H, Alstro¨m P, Edwards SV, Stamatakis A, Mindell DP, Cracraft J, Braun EL, Warnow T, Jun W, Gilbert MTP, Zhang G. 2014.Whole-genome analyses resolve early branches in the tree of life of modern birds. Science 346(6215):1320–1331DOI 10.1126/science.1253451.
Johnson BR, Borowiec ML, Chiu JC, Lee EK, Atallah J, Ward PS. 2013.Phylogenomics resolves evolutionary relationships among ants, bees, and wasps.Current Biology23(20):2058–2062
DOI 10.1016/j.cub.2013.08.050.
Kim MJ, Wang AR, Park JS, Kim I. 2014. Complete mitochondrial genomes of five skippers (Lepidoptera: Hesperiidae) and phylogenetic reconstruction of Lepidoptera. Gene
549(1):97–112DOI 10.1016/j.gene.2014.07.052.
Kocot KM, Cannon JT, Todt C, Citarella MR, Kohn AB, Meyer A, Santos SR, Schander C, Moroz LL, Lieb B, Halanych KM. 2011.Phylogenomics reveals deep molluscan relationships. Nature 477(7365):452–456DOI 10.1038/nature10382.
Kodandaramaiah U, Pen˜a C, Braby MF, Grund R, Mu¨ller CJ, Nylin S, Wahlberg N. 2010.
Phylogenetics of Coenonymphina (Nymphalidae: Satyrinae) and the problem of rooting rapid radiations.Molecular Phylogenetics and Evolution54(2):386–394
DOI 10.1016/j.ympev.2009.08.012.
Lento GM, Hickson RE, Chambers GK, Penny D. 1995.Use of spectral analysis to test hypotheses on the origin of pinnipeds.Molecular Biology and Evolution12(1):28–52
DOI 10.1093/oxfordjournals.molbev.a040189.
Mielke OHH. 2005.Catalogue of the American Hesperioidea: Hesperiidae (Lepidoptera).Vol. 6. Parana: Sociedade Brasileira de Zoologia.
Miller MA, Pfeiffer W, Schwartz T. 2010.Creating the CIPRES science gateway for inference of large phylogenetic trees. In:Proceedings of the Gateway Computing Environments Workshop (GCE), 14 November 2010. New Orleans: IEEE, 1–8.
Nabholz B, Kunstner A, Wang R, Jarvis ED, Ellegren H. 2011.Dynamic evolution of base composition: causes and consequences in avian phylogenomics.Molecular Biology and Evolution28(8):2197–2210DOI 10.1093/molbev/msr047.
Nazari V, Zakharov EV, Sperling FAH. 2007.Phylogeny, historical biogeography, and taxonomic ranking of Parnassiinae (Lepidoptera, Papilionidae) based on morphology and seven genes. Molecular Phylogenetics and Evolution42(1):131–156DOI 10.1016/j.ympev.2006.06.022.
Nixon KC. 1999.The parsimony ratchet, a new method for rapid parsimony analysis.Cladistics
15(4):407–414DOI 10.1111/j.1096-0031.1999.tb00277.x.
Planet PJ. 2006.Tree disagreement: measuring and testing incongruence in phylogenies.Journal of Biomedical Informatics39(1):86–102DOI 10.1016/j.jbi.2005.08.008.
Pollard DA, Iyer VN, Moses AM, Eisen MB. 2006.Widespread discordance of gene trees with species tree in Drosophila: evidence for incomplete lineage sorting.PLoS Genetics2(10):e173
DOI 10.1371/journal.pgen.0020173.
Rambaut A, Suchard MA, Xie D, Drummond AJ. 2014.Tracer v1.6.Available athttp://beast.bio. ed.ac.um/Tracer.
Regier JC, Shultz JW, Ganley AR, Hussey A, Shi D, Ball B, Zwick A, Stajich JE, Cummings MP, Martin JW, Cunningham CW. 2008.Resolving arthropod phylogeny: exploring phylogenetic signal within 41 kb of protein-coding nuclear gene sequence. Systematic Biology 57(6):920–938 DOI 10.1080/10635150802570791.
Regier JC, Shultz JW, Zwick A, Hussey A, Ball B, Wetzer R, Martin JW, Cunningham CW. 2010.
Arthropod relationships revealed by phylogenomic analysis of nuclear protein-coding sequences.Nature463(7284):1079–1083DOI 10.1038/nature08742.
Richart CH, Hayashi CY, Hedin M. 2016.Phylogenomic analyses resolve an ancient trichotomy at the base of Ischyropsalidoidea (Arachnida, Opiliones) despite high levels of gene tree conflict and unequal minority resolution frequencies.Molecular Phylogenetics and Evolution
95:171–182DOI 10.1016/j.ympev.2015.11.010.
Rokas A, King N, Finnerty J, Carroll SB. 2003a.Conflicting phylogenetic signals at the base of the metazoan tree.Evolution and Development5(4):346–359
DOI 10.1046/j.1525-142X.2003.03042.x.
Rokas A, Williams BL, King N, Carroll SB. 2003b.Genome-scale approaches to resolving incongruence in molecular phylogenies.Nature425(6960):798–804DOI 10.1038/nature02053.
Ronquist F, Teslenko M, van der Mark P, Ayres DL, Darling A, Ho¨hna S, Larget B, Liu L, Suchard MA, Huelsenbeck JP. 2012.MrBayes 3.2: efficient Bayesian phylogenetic inference and model choice across a large model space.Systematic Biology61(3):539–542
DOI 10.1093/sysbio/sys029.
Rota J, Wahlberg N. 2012.Exploration of data partitioning in an eight-gene dataset: phylogeny of metalmark moths (Lepidoptera, Choreutidae).Zoologica Scripta41(5):536–546
Ruhfel BR, Gitzendanner MA, Soltis PS, Soltis DE, Burleigh JG. 2014.From algae to
angiosperms-inferring the phylogeny of green plants (Viridiplantae) from 360 plastid genomes. BMC Evolutionary Biology14(1):23DOI 10.1186/1471-2148-14-23.
Scott JA. 1985.The phylogeny of butterflies (Papilionoidea and Hesperioidea).Journal of Research on the Lepidoptera23(4):241–281.
Scott JA, Wright DM. 1990.Butterfly phylogeny and fossils. In: Kudrna O, ed.Butterflies of Europe. Wiesbaden: Aula-Verlag.
Shimodaira H. 2002.An approximately unbiased test of phylogenetic tree selection.Systematic Biology51(3):492–508DOI 10.1080/10635150290069913.
Simonsen TJ, Zakharov EV, Djernaes M, Cotton AM, Vane-Wright RI, Sperling FAH. 2011.
Phylogenetics and divergence times of Papilioninae (Lepidoptera) with special reference to the enigmatic genera Teinopalpus and Meandrusa.Cladistics27(2):113–137
DOI 10.1111/j.1096-0031.2010.00326.x.
Smith SA, Moore MJ, Brown JW, Yang Y. 2015.Analysis of phylogenomic datasets reveals conflict, concordance, and gene duplications with examples from animals and plants. BMC Evolutionary Biology15(1):150DOI 10.1186/s12862-015-0423-0.
Smith SA, Wilson NG, Goetz FE, Feehery C, Andrade SCS, Rouse GW, Giribet G, Dunn CW. 2011.Resolving the evolutionary relationships of molluscs with phylogenomic tools.Nature
480(7377):364–367DOI 10.1038/nature10526.
Soltis DE, Soltis PS, Zanis MJ. 2002.Phylogeny of seed plants based on evidence from eight genes. American Journal of Botany89(10):1670–1681DOI 10.3732/ajb.89.10.1670.
Song S, Liu L, Edwards SV, Wu S. 2012. Resolving conflict in eutherian mammal phylogeny using phylogenomics and the multispecies coalescent model.Proceedings of the National Academy of Sciences of the United States of America 109(37):14942–14947
DOI 10.1073/pnas.1211733109.
Stamatakis A. 2014.RAxML version 8: a tool for phylogenetic analysis and post-analysis of large phylogenies.Bioinformatics30(9):1312–1313DOI 10.1093/bioinformatics/btu033.
Voss EG. 1952.On the classification of the Hesperiidae.Annals of the Entomological Society of America45(2):246–258DOI 10.1093/aesa/45.2.246.
Wahlberg N, Leneveu J, Kodandaramaiah U, Pen˜a C, Nylin S, Freitas AVL, Brower AVZ. 2009.
Nymphalid butterflies diversify following near demise at the Cretaceous/Tertiary boundary. Proceedings of the Royal Society B: Biological Sciences276(1677):4295–4302
DOI 10.1098/rspb.2009.1303.
Wahlberg N, Rota J, Braby MF, Pierce NE, Wheat CW. 2014.Revised systematics and higher classification of pierid butterflies (Lepidoptera: Pieridae) based on molecular data.
Zoologica Scripta43(6):641–650DOI 10.1111/zsc.12075.
Wahlberg N, Wheat CW. 2008.Genomic outposts serve the phylogenomic pioneers: designing novel nuclear markers for genomic DNA extractions of Lepidoptera.Systematic Biology
57(2):231–242DOI 10.1080/10635150802033006.
Warren AD, Ogawa JR, Brower AVZ. 2008.Phylogenetic relationships of subfamilies and circumscription of tribes in the family Hesperiidae (Lepidoptera: Hesperioidea).Cladistics
24(5):642–676DOI 10.1111/j.1096-0031.2008.00218.x.
Warren AD, Ogawa JR, Brower AVZ. 2009.Revised classification of the family Hesperiidae (Lepidoptera: Hesperioidea) based on combined molecular and morphological data. Systematic Entomology34(3):467–523DOI 10.1111/j.1365-3113.2008.00463.x.
Wiens JJ. 2003.Missing data, incomplete taxa, and phylogenetic accuracy.Systematic Biology
52(4):528–538DOI 10.1080/10635150390218330.
Wiens JJ, Morrill MC. 2011.Missing data in phylogenetic analysis: reconciling results from simulations and empirical data.Systematic Biology60(5):719–731DOI 10.1093/sysbio/syr025.
Wolf YI, Rogozin IB, Grishin NV, Koonin EV. 2002.Genome trees and the tree of life.Trends in Genetics18(9):472–479DOI 10.1016/S0168-9525(02)02744-0.
Xi Z, Liu L, Rest JS, Davis CC. 2014.Coalescent versus concatenation methods and the placement of amborella as sister to water lilies.Systematic Biology63(6):919–932
DOI 10.1093/sysbio/syu055.
Xia X. 2013.DAMBE5: a comprehensive software package for data analysis in molecular biology and evolution. Molecular Biology and Evolution30(7):1720–1728
DOI 10.1093/molbev/mst064.
Yuan X, Gao K, Yuan F, Wang P, Zhang Y. 2015.Phylogenetic relationships of subfamilies in the family Hesperiidae (Lepidoptera: Hesperioidea) from China.Scientific Reports5:11140
DOI 10.1038/srep11140.