www.the-cryosphere.net/10/2731/2016/ doi:10.5194/tc-10-2731-2016
© Author(s) 2016. CC Attribution 3.0 License.
Simulating ice layer formation under the presence
of preferential flow in layered snowpacks
Nander Wever1,2, Sebastian Würzer1,2, Charles Fierz2, and Michael Lehning2,1
1École Polytechnique Fédérale de Lausanne (EPFL), School of Architecture, Civil and Environmental Engineering,
Lausanne, Switzerland
2WSL Institute for Snow and Avalanche Research SLF, Davos, Switzerland
Correspondence to:Nander Wever ([email protected])
Received: 28 July 2016 – Published in The Cryosphere Discuss.: 3 August 2016
Revised: 19 October 2016 – Accepted: 1 November 2016 – Published: 16 November 2016
Abstract.For physics-based snow cover models, simulating the formation of dense ice layers inside the snowpack has been a long-time challenge. Their formation is considered to be tightly coupled to the presence of preferential flow, which is assumed to happen through flow fingering. Recent labo-ratory experiments and modelling techniques of liquid water flow in snow have advanced the understanding of conditions under which preferential flow paths or flow fingers form. We propose a modelling approach in the one-dimensional, mul-tilayer snow cover model SNOWPACK for preferential flow that is based on a dual domain approach. The pore space is divided into a part that represents matrix flow and a part that represents preferential flow. Richards’ equation is then solved for both domains and only water in matrix flow is subjected to phase changes. We found that preferential flow paths arriving at a layer transition in the snowpack may lead to ponding conditions, which we used to trigger a water flow from the preferential flow domain to the matrix domain. Sub-sequent refreezing then can form dense layers in the snow-pack that regularly exceed 700 kg m−3. A comparison of
sim-ulated density profiles with biweekly snow profiles made at the Weissfluhjoch measurement site at 2536 m altitude in the Eastern Swiss Alps for 16 snow seasons showed that several ice layers that were observed in the field could be reproduced. However, many profiles remain challenging to simulate. The prediction of the early snowpack runoff also improved under the consideration of preferential flow. Our study suggests that a dual domain approach is able to describe the net effect of preferential flow on ice layer formation and liquid water flow in snow in one-dimensional, detailed, physics-based
snow-pack models, without the need for a full multidimensional model.
1 Introduction
microwave emission from the snowpack, which is used in remote sensing retrieval algorithms (Rees et al., 2010; Roy et al., 2016). For rock stability of permafrost-affected re-gions, the presence of ice layers near the base of the snow-pack as well as inside the snowsnow-pack was found to prevent liq-uid water from reaching joints in the rocks, thereby improv-ing rock stability (Phillips et al., 2016). Ice layers in snow-packs also impact the access to food resources for wild life in snow-covered areas (e.g. Vikhamar-Schuler et al., 2013). Cli-mate change projections of future increases in rain-on-snow events in high latitudes (Ye et al., 2008), increased snow melt on ice sheets (de la Peña et al., 2015) as well as more frequent melt events in alpine snowpacks (Surfleet and Tullos, 2013) show urgency to be able to determine how these changes af-fect the snowpack microstructure in the future.
For 1-D snow cover models, whether they are physics based or simple, it is notoriously difficult to simulate the for-mation of ice layers. This can be understood as most models do not consider preferential flow, which is a crucial trans-port mechanism to allow downward propagating water flow in sub-freezing snow. Liquid water can thereby reach ar-eas in the snowpack where the cold content is large enough to refreeze the percolating meltwater and form ice layers (Humphrey et al., 2012). In early attempts by Colbeck (1979) and Marsh and Woo (1985) to describe preferential flow in snowpack models, the water flow in snow is considered as a flow in multiple flow paths. In Colbeck (1979), flow paths are defined that differ in size and snowpack properties, which results in different percolation speeds in the individual snow paths when applying Darcy’s law. In Marsh and Woo (1985), the snowpack is divided in flow paths of equal size and snow-pack properties. In their approach, it is determined how much of the total flux is transported in each of the individual flow paths based on data from compartmented lysimeter experi-ments. Both approaches never found widespread adoption, probably because they require a priori specification of the flow path variability (Marsh, 1999). In Katsushima et al. (2009), a description of preferential flow for snowpack mod-els is proposed where water in excess of a threshold in sat-uration (for example in ponding conditions inside the snow-pack) is directly routed to the soil below the snowpack. This approach improved the prediction of snowpack runoff, but it is not able to simulate the formation of ice layers due to percolating meltwater in preferential flow channels, as the water in preferential flow is considered to have left the snow domain of the model. The fact that many snow models ne-glect preferential flow, even when they are used for hydro-logical studies where snowpack runoff is a primary process, may be justified for describing seasonal runoff characteris-tics (Wever et al., 2014a). However, preferential flow may be crucial for understanding the response of a snow cover on short, sub-daily timescales, for example during rain-on-snow events (Katsushima et al., 2009; Rössler et al., 2014; Wever et al., 2014b; Würzer et al., 2016a). Also, for wet snow avalanche formation the exact location at which
liq-Air Air
θice θs,matrix θs,pref
2
3
4 5 1
6
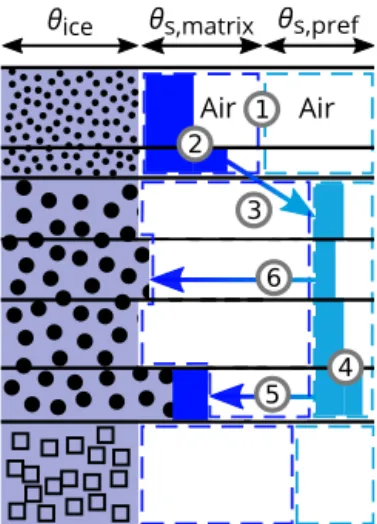
Figure 1.Schematic overview of the dual domain implementation
for the SNOWPACK model, in which the pore space that can be occupied by liquid water is separated into a part for matrix flow (θs,matrix) and a part representing preferential flow (θs,pref). The
numbers refer to processes described in the text.
uid water starts ponding can influence snow stability (Wever et al., 2016) and considering preferential flow may be im-portant for the exact timing of when weak layers are reached by water. Snowpack models developed for avalanche warn-ing purposes (Brun et al., 1992; Lehnwarn-ing et al., 1999) may therefore also benefit from a description of preferential flow processes in snow.
Multidimensional snow cover models have been devel-oped to simulate preferential flow (Illangasekare et al., 1990; Hirashima et al., 2014), but those models simplified and neglected several snowpack processes (i.e. snow settling, snow microstructure evolution), meaning that they are not yet applicable to natural snowpacks. Furthermore, multidi-mensional snow cover models generally require more com-putational power, making them unsuitable for large-scale de-ployment. However, those multidimensional model develop-ments provide crucial insights that allowed for a parametrisa-tion of a dual domain approach for preferential flow for the 1-D, physics-based, detailed SNOWPACK model (Bartelt and Lehning, 2002; Lehning et al., 2002a, b), which we present in this study.
2 Dual domain implementation
in the model is described for both the matrix and preferential flow domain by solving the Richards equation (Wever et al., 2014a) for both domains sequentially at the commonly used SNOWPACK time step of 15 min. After solving the Richards equation for the matrix domain, the exchange of water be-tween the matrix and preferential flow domain is determined and vice versa. If the pressure head exceeds the water en-try pressure head of the layer below (labelled 2 in Fig. 1), water moves from matrix to preferential flow (labelled 3 in Fig. 1). If the saturation in the preferential flow path exceeds a threshold (labelled 4 in Fig. 1), water moves back to the matrix domain (labelled 5 in Fig. 1). Only the matrix part is allowed to undergo phase changes and ice layers form when water moves back from preferential flow to matrix flow and refreezes. Preferential flow always remains in the liquid phase. Refreezing of preferential flow water is mimicked by moving water from preferential flow to the matrix flow do-main (labelled 6 in Fig. 1). Below, the water exchange pro-cesses are described in more detail.
2.1 Defining the dual domains
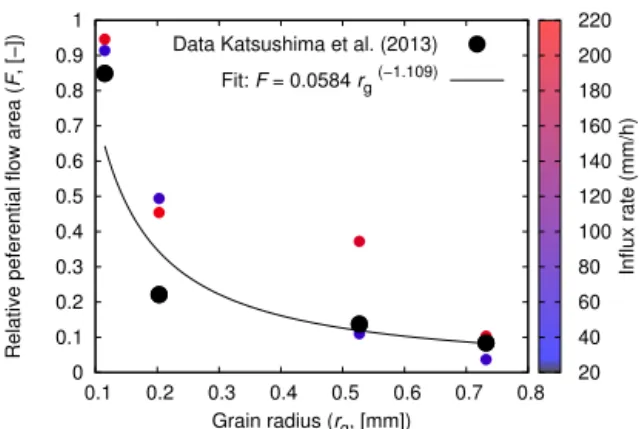
For the dual domain approach, the pore space is subdivided in a matrix and preferential flow domain (denoted with 1 in Fig. 1). For soils, the relative area involved in preferential flow is often found to be a function of the ratio of system in-flux rate over saturated hydraulic conductivity (Glass et al., 1989a, b) for a given soil texture. In the experimental data on snow presented by Katsushima et al. (2013), a more pro-nounced dependence of the preferential flow area with grain size is found, rather than with the system influx rate. We illus-trate their experimental results graphically in Fig. 2. Whereas the grain size shows a distinct pattern of smaller preferential flow area for larger grain sizes, the system influx rate showed a rather ambiguous pattern, where increased influx did not al-ways lead to a larger preferential flow area. The grain sizes used in their experiments span over typical ranges found in natural snowpacks and this dependence is important to take into account. It also has to be noted that the infiltration rates in their experiments exceed typical values in natural condi-tions. We therefore decided to determine the dependence of preferential flow area on grain size using the lowest experi-mental infiltration rate only. A fit to this selection of the data (see Fig. 2) provides the following expression for the prefer-ential flow area (F):
F =0.0584rg−1.109, (1)
whereFis the preferential flow area fraction (–), andrgis the
grain radius (mm). The matrix flow domain is accordingly defined as(1−F ). For fine grained snow (rg≈0.12 mm),
Katsushima et al. (2013) did not observe preferential flow, in contrast with the snow samples with rg≈0.21 mm and
larger. However, typically most parts of the snowpack consist of larger grains than the smallest grain size used in the
0 0.1 0.2 0.3 0.4 0.5 0.6 0.7 0.8 0.9 1
0.1 0.2 0.3 0.4 0.5 0.6 0.7 0.8
Relative peferential flow area (
F
, [−])
Grain radius (rg, [mm])
Data Katsushima et al. (2013)
Fit: F = 0.0584 rg (−1.109)
20 40 60 80 100 120 140 160 180 200 220
Influx rate (mm/h)
Figure 2.Relationship of the area involved in preferential flow as
a function of grain radius. Data points represent laboratory experi-ments by Katsushima et al. (2013), presented quantitatively by Hi-rashima et al. (2014). Data points are coloured based on the water influx rate used in the experiments. The large black dots denote the data points used for determining the fit (solid line), corresponding to the lowest influx rate per grain size class.
iments. Thus, to provide a continuum description of the ma-trix and preferential flow regime, Eq. (1) is used for all grain sizes. For numerical stability,F is limited between 0.01 and
0.90. Generally grain size increases over time in snow, and
this may occasionally lead to a situation where the preferen-tial flow area in the next SNOWPACK time step is reduced below the required one to accommodate for the liquid water present in the preferential flow domain. We therefore addi-tionally ensure thatF is large enough to contain all present
preferential flow water.
For both domains, the relationship between pressure head and liquid water content (LWC) is described by the van Genuchten parametrisation for snow as experimentally de-termined by Yamaguchi et al. (2012). For the matrix flow domain, the saturated LWC is scaled by(1−F )and for the
preferential flow domain byF. Furthermore, we determine
the residual water content for the matrix flow domain using the approach described in Wever et al. (2014a), while set-ting it to 0 for the preferential flow domain. Saturated hy-draulic conductivity is parametrised using the parametrisa-tion for permeability proposed by Calonne et al. (2012).
2.2 Water exchange between matrix and preferential flow domain
found to be the case in laboratory experiments (Katsushima et al., 2013; Avanzi et al., 2016) and was successfully ex-ploited in numerical modelling to initiate preferential flow (Katsushima et al., 2009; Hirashima et al., 2014). The wa-ter entry pressurehwe(m) can be expressed as a function of
grain radius according to Katsushima et al. (2013):
hwe=0.0437 2rg+0.01074. (2)
One important condition to reach the water entry pressure is water ponding on a microstructural transition inside the snowpack (Hirashima et al., 2014; Avanzi et al., 2016). This is denoted with 2 in Fig. 1. To achieve the high LWC value observed in experiments (Avanzi et al., 2016), we use the ge-ometric average to calculate the hydraulic conductivity be-tween snow layers (Wever et al., 2015). In our implemen-tation, the amount of water in the matrix part in excess of the threshold corresponding to the water entry pressure of the layer below is moved to the preferential flow domain in the layer below (denoted with 3 in Fig. 1). A capillary over-shoot condition was found in snow (Katsushima et al., 2013), which means that the capillary pressure in the ponding layer decreases again after preferential flow forms. This increases the liquid water content in the preferential flow paths, and to mimic this effect we allow more water to flow from ma-trix flow to preferential flow once the threshold is exceeded than only the amount of water above the threshold. If after the water in excess of the threshold is moved and the satura-tion (i.e. ratio of water volume to pore volume) in the layer in the matrix domain is still higher than the saturation in the layer below in the preferential flow domain, the saturation is equalised by an equivalent water flow with the following approach. Equal saturation in a specific layer with indexiin
the matrix domain and a layer with indexjin the preferential
flow domain can be expressed as
θmi −θri,m
θi
s,m−θri,m
= θ
j
p−θrj,p
θsj,p−θrj,p
, (3)
where the subscripts m and p denote the matrix and prefer-ential flow domain, respectively,θis the LWC (m3m−3),θr
is the residual LWC (m3m−3) andθs is the saturated LWC
(m3m−3). In the model, layers are counted from below, such that equalising saturation between the matrix domain in the layer above and the preferential flow domain in the layer be-low corresponds toj=i−1.
Given layer thicknesses Lim andLjp for the layers in the
matrix flow and preferential flow domain, respectively, the total LWC in the matrix and preferential flow layer is defined as
θtot=θmiLim+θpjLjp. (4)
Under the requirement of an equal degree of saturation for a given total LWC, we can solve Eq. (3) forθmi :
θmi = −
θri,mθsj,p−θrj,pθsi,m
Lim+θrj,p−θsj,p
θtot
θi
s,m−θri,mLim+
θsj,p−θrj,p
Ljp
, (5)
after whichθpj can be found by applying Eq. (4).
Additionally, if the saturation in the matrix domain ex-ceeds the saturation of the preferential flow domain in a snowpack layer, saturation is equalised using Eq. (5), with
i=j and consequentlyLim=Ljp. This is motivated by the
fact that once snow is wet, no horizontal gradients in pres-sure head are expected to be present in a snow layer; thus, following the van Genuchten water retention curve, the satu-ration of the matrix domain is equal to the satusatu-ration of the preferential flow domain.
Conceptually, water will leave the preferential flow do-main and enter the matrix dodo-main if the pressure head inside the preferential flow domain exceeds the water entry pressure of the dry snow around the preferential flow path. This pro-cedure was able to simulate water spreading on microstruc-tural transitions in the multidimensional snow model by Hi-rashima et al. (2014). However, in our study, this approach rarely succeeded in forming ice layers, as the condition is rather seldom met. This fact can be interpreted in light of the physics behind preferential flow. It was demonstrated that an overshoot condition exists in flow fingers, which means that the tip of a flow finger shows marked higher saturation than the tail. This flow behaviour cannot be described by the Richards equation (DiCarlo, 2013), although the Richards equation continues to provide a correct description above and below the wetting front. The reason why the condition worked in Hirashima et al. (2014) may be due to the fact that the simulations involved high water influx rates, much higher than experienced in natural snowpacks. This would increase the amount of water accumulating on the capillary barrier when liquid water flow over the transition is slower than the water flux arriving from above. In the absence of a solution for this problem (DiCarlo, 2013), we simply apply a threshold in saturation (2th) of the preferential flow domain
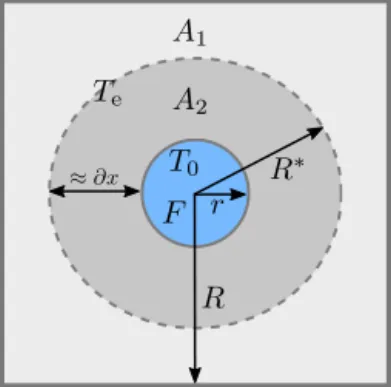
Figure 3.Schematic representation of a preferential flow path with
radiusr and surfaceF inside a 1 m2snowpack (i.e. R=0.5 m), seen from above (not to scale), to approximate∂x. The preferential
flow path is assumed to be at melting temperatureT0, the rest of the
snowpack at temperatureTe.R∗is the radius such that surface areas
A1andA2are equal. When assuming a linear temperature gradient, Teis found at distanceR∗.
2.3 Refreezing preferential flow
In our approach, water in the preferential flow domain is not considered for phase changes. However, in reality preferen-tial flow is known to refreeze, even forming ice structures in the shape of flow fingers inside the snowpack (Kattelmann, 1985; Marsh, 1988; Fierz et al., 2009; Williams et al., 2000). For simplicity, we currently do not consider microstructural changes due to preferential flow, although they may have a strong effect on the water flow in snow. Grain growth and subsequent reduction of capillary forces as well as ice columns may increase the efficiency of the preferential flow paths considerably.
For the thermal effects, we first describe the heat flux be-tween the preferential flow part and the matrix part by assum-ing a pipe with radiusr(m) at melting temperatureT0(K) in
the middle of a 1 m2snowpack at temperature T
e (K) (see
Fig. 3). If we assume that the horizontal temperature gradi-ent inside the snowpack is linear, then the temperatureTeis
found at a radiusR∗(m) such that surface areasA1(m2) and A2 (m2) are equal. We can then approximate Fourier’s law
for heat flow for the heat flux between the preferential flow and matrix domain (QH,p→m, J m−1s−1) as
QH,p→m=κ∂T
∂x ≈κ
(Te−T0)
q 1+F
2π −
q
F π
. (6)
The volumetric content that needs to be transferred from the preferential domain to the matrix domain (denoted with 6 in Fig. 1), in order to satisfy the refreezing capacity provided by the heat fluxQH,p→mover the outer area of the
preferen-tial flow path can be subsequently expressed as
1θw,p→m=N π F LeQH,p→m1t, (7)
whereLeis the latent heat associated with freezing (3.34×
105J kg−1) andNis a factor describing the effect of multiple
flow paths forming areaF. Often, numerous flow paths can
be identified per square metre of snowpack, as for example found in a field study by McGurk and Marsh (1995). They re-port a flow path density between roughly 100 and 300 m−2.
However, this number is not necessarily representative for the number of flow paths actively and concurrently transport-ing water, as often new preferential flow paths form in sub-sequent melt cycles (Schneebeli, 1995). Albert et al. (1999) found only three preferential flow paths per square metre dur-ing the first wettdur-ing of a previously sub-freezdur-ing snowpack. When more flow paths are present, the energy exchange will be more efficient. Additionally, the gradients with the sur-rounding snow will be larger. We useNas a tuning parameter
in the model related to the number of flow paths per square metre.
3 Data and methods 3.1 Data
We simulate 16 subsequent snow seasons (2000–2015) for the Weissfluhjoch (WFJ) measurement site, located at 2536 m altitude in the Eastern Swiss Alps. For this site, a dataset of biweekly snow profiles made in close vicin-ity (<25 m) of the meteorological station used to drive the
SNOWPACK model in this study is available (WSL Insti-tute for Snow and Avalanche Research SLF, 2015; Wever et al., 2015). The snow profiles contain information about grain size and type, judged by the observer using a magnify-ing glass, as well as snow density in sections of typically 20– 50 cm height and snow temperature. Melt–freeze crusts (i.e. parts of the snowpack that have been wet and froze again), as well as ice layers, are explicitly marked as such in the pro-files. Ice lenses (i.e. noncontinuous ice layers) are not marked as an ice layer but are reported in a separate remark. As sub-sequent snow profiles need to be made in undisturbed snow, they also sample spatial variability in addition to the temporal evolution. Furthermore, judging whether a specific layer is a crust or an ice layer is also partly subjective. This is also in-dicated in the data: sometimes the same layer is not identified similarly in subsequent snow profiles, although this may also indicate spatial variability. To account for spatial variability at the measurement site, we select the highest modelled dry snow density within a range of 20 cm above or below an ob-served ice layer, when comparing simulated and obob-served ice layers.
For validating the snowpack runoff simulated by the model, we use the snow lysimeter data from a 5 m2lysimeter,
runoff. Here, we consider the measured snowpack runoff for the period 1 March to 31 May only, and we particularly fo-cus on the first 20 mm w.e. (water equivalent) runoff from the snowpack. This period corresponds to the onset of snowpack runoff, while preventing the statistics from being dominated by the main melt period. We additionally exclude lysimeter data from snow season 2000 and 2005 from the analysis due to suspected problems with the lysimeter in these seasons (Wever et al., 2014a).
3.2 Methods
The simulation set-up of the SNOWPACK model for WFJ is equal to the snow-height-driven simulations in Wever et al. (2015), in which new snowfall amounts are determined from increases in measured snow height. This ensures a simula-tion that closely follows the measured snow height, which will enable a correct comparison of simulated and observed snow profiles. Ice layers observed in the field can range from a few millimetres to a few centimetres and up to 1 m in firn on the Greenland Ice Sheet (Fierz et al., 2009; Machguth et al., 2016). To reduce computational costs, the SNOW-PACK model applies an algorithm to merge elements when they exhibit similar properties. In default setting, this proce-dure typically maintains the layer spacing around 1.5 to 3 cm, except for certain special cases, like buried surface hoar or ice layers inside the snowpack, which should be maintained irrespective of their thickness. This means that in default set-up, with a typical layer spacing of 1.6 cm, the formation of
ice layers is coupled to relatively thick layers compared to ice layers found in natural alpine snowpacks. Forming thin-ner ice layers requires less water and ethin-nergy to refreeze. We therefore performed high-resolution simulations where we lower the threshold above which no merge is allowed from 1.5 to 0.25 cm. Further, for the high-resolution simulations,
we initialise new snow layers during snowfall in steps of 0.5 cm, instead of the default value of 2 cm. This led to a typical layer spacing of 0.45 cm. Results presented here are with the high-resolution simulations, although we discuss the performance of the default resolution as well. Simulations with matrix flow only took on average 2.3 min per simulated
year to complete on a typical desktop PC, using the default SNOWPACK settings. The dual domain approach, which re-quires solving the Richards equation twice, increased the computation time to 8.0 min yr−1. The high-resolution
simu-lations, which we show here, took 71 min yr−1to complete.
Densities of ice layers in the field can vary over a wide range. For example, Marsh and Woo (1984) report a range from 630 to 950 kg m−3, which makes it ambiguous to
deter-mine above which threshold of modelled dry snow density a layer should be considered an ice layer. In the default set-up, a layer with a dry snow density exceeding 700 kg m−3is
con-sidered an ice layer by the SNOWPACK model. However, we apply different thresholds here to verify the sensitivity of the choice of threshold on the results. Indeed, it may be that
sim-ulated layers cannot reach the density of observed thin ice layers due to their larger vertical extent in the model.
4 Results
4.1 Parameter estimation
In the preferential flow formulation we propose, two tuning parameters are left: the threshold in saturation of the prefer-ential flow domain (2th), above which water will flow back
to the matrix part, and a parameter related to the number of flow paths per square metre (N). To determine an optimal set
of parameters, a sensitivity study was carried out. For2th,
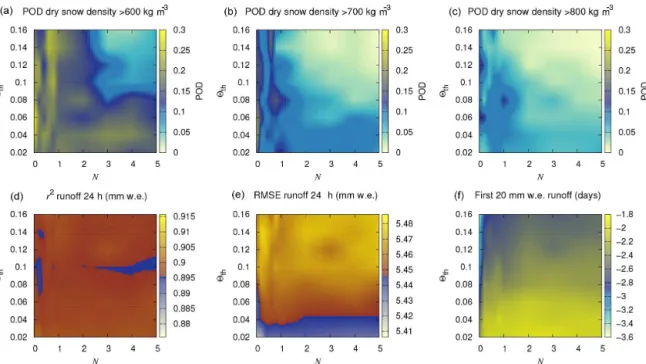
values from 0.02 to 0.16 in steps of 0.02 were used and for N, values 0, 0.2, 0.4, 0.6, 0.8, 1.0, 2.0, 3.0, 4.0, 5.0 were used. Figure 4 shows the probability of detection (POD; i.e. the ratio of observed ice layers that are reproduced by the model over the total number of observed ice layers) for dif-ferent thresholds that define a modelled ice layer, as a func-tion of both tuning parameters. When ice layers are defined by higher densities, the POD decreases. Highest POD is achieved for no or minor freezing (i.e. small values forN),
and a saturation in the preferential flow path around 0.1. The
non-linear relationship in Fig. 4 arises from the delicate bal-ance of refreezing water that is not able to percolate deeper and the amount of ponding possible at microstructural transi-tions, required for water to move back to the matrix domain in order to freeze as an ice layer or lens. For snowpack runoff, highest scores in terms ofr2, RMSE or the arrival date of the
first 20 mm w.e. are generally achieved with refreezing and low thresholds in saturation of the preferential flow domain (see Fig. 4). Both slow down the progression of preferential flow water. It seems difficult to find a set of parameters that will maximise both the reproduction of ice layers, as well as snowpack runoff simulations. Nevertheless, even with opti-mal settings for the formation of ice layers, the early stage of snowpack runoff (i.e. the passage time of the first 20 mm w.e. of runoff) is better reproduced than without considering pref-erential flow.
After executing all 80 SNOWPACK simulations for the sensitivity study, ranks were determined for the POD of ice layers, using 700 kg m−3as density threshold for ice layers, and ther2value for hourly snowpack runoff. The
Figure 4.Interpolated results of the sensitivity study for the parametersN and2thfor the probability of detection (POD) when modelled
dry snow density exceeds 600 kg m−3(a), 700 kg m−3(b), or 800 kg m−3(c)within 20 cm of the observed ice layer. For runoff, ther2for
daily sums of runoff(d), the RMSE error for daily sums of runoff(e)and the number of days difference between modelled and measured
passage of 20 mm w.e. since 1 March of each snow season(f)are shown. The jump in colour scale from blue to red in(d)and(e)marks the score achieved with matrix flow only.
4.2 Example snow season
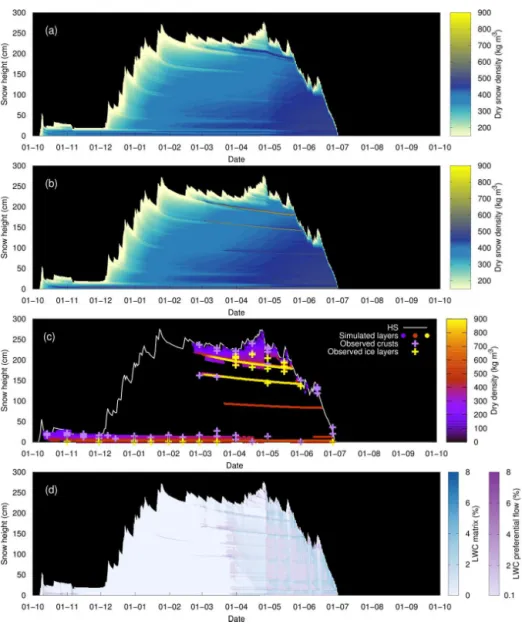
Figure 5 illustrates the difference in simulated snow density between a simulation with only the Richards equation and the Richards equation including preferential flow at high res-olution for snow season 2012. Similar figures for the other simulated snow seasons are shown in the online Supplement. The overall density distribution is similar in both simulations, but only with preferential flow are ice layers formed. The lo-cation is in good agreement with observations of ice layers and crusts observed in the snow profiles in the field. Figure 6 shows detailed simulation output for the period in the begin-ning of March 2012 and the upper part of the snowpack only. The distribution of liquid water is showing that the prefer-ential flow (Fig. 6b) is percolating ahead of the matrix flow (Fig. 6a). This partly is due to the absence of phase changes for water in preferential flow, but also due to the lower area, and thereby lower value forθs, such that hydraulic
conduc-tivity increases faster with increasing LWC. In contrast to matrix flow, preferential flow reaches areas where the snow-pack is still below freezing (Fig. 6c).
Ponding at microstructural interfaces is occurring in both the matrix and the preferential flow domain. In the example, jumps in snow density (Fig. 6d) and grain radius (Fig. 6e) around 165 and 210 cm in the snowpack mark the layers where water accumulates, refreezes and forms ice layers (Fig. 6d, f). Solving the Richards equation twice (for both domains) appears to be able to identify those layers.
Re-freezing locally increases the snow temperature to melting temperature (Fig. 6c). Initially, the model identifies refreeze inside the snow layer and marks the layer as a melt–freeze crust. Once dry snow density exceeds 700 kg m−3, the layer
is marked as an ice layer (Fig. 6f). Note that Fig. 6e shows that most of the snowpack consists of grain sizes for which preferential flow was observed in the experiments by Kat-sushima et al. (2013). The smallest grain size class from those experiments, for which no preferential flow was ob-served, is only found in the new snow layers during snowfall (black coloured areas), after which metamorphism rapidly in-creases grain size to regimes for which preferential flow was observed. This justifies the application of Eq. (1) for the full range of grain size in the model.
Further-Figure 5. Dry snow density without considering preferential flow(a)and with preferential flow using high-resolution simulations(b),
validation with field observations(c)and liquid water content in the matrix and preferential flow domain for the simulation with preferential
flow(d), for snow season 2012. In(c), modelled layers are shown when they are either a melt–freeze crust or have a dry snow density exceeding 500 kg m−3. For visibility, values of LWC in preferential flow below 0.1 % are ignored in(d).
more, we hypothesise that rain droplets probably freeze di-rectly upon contact with the snow surface, creating an ice layer locally at the surface, whereas the SNOWPACK model considers the rainfall as an incoming flux in the top layer. When the available energy for freezing is not sufficient to freeze the full depth of the top layer in the model, an ice layer is not formed. In reality, the surface ice layer is possi-bly even hindering water entry to deeper layers, which may thicken the surface ice layer. This particular ice layer in 2004 has been excluded in further analysis.
4.3 Density profiles
Figure 7 shows the observed snow density distribution in all snow profiles from snow seasons 2000–2015, typically
repre-senting vertical sections of 20–50 cm and sometimes smaller sections. The distribution of snow density for these sections is reproduced well by the simulations, although the spread in simulated snow density is lower than the observed spread. All simulations provide very similar snow density distributions. Ther2value between observed and simulated density in the
measurement sections is highest (r2= 0.74) for the
simula-tions with the Richards equation only, and in Wever et al. (2015) it is shown that the temporal evolution and vertical distribution of snow density is in good agreement with mea-sured snow density. With preferential flow, ther2 value
Figure 6.LWC in matrix domain(a), LWC in preferential flow domain(b), snow temperature(c), snow density(d), grain radius(e)and
grain shape(f), depicting a detail of Fig. 5. Only the upper part of the snowpack is shown for the period 27 February to 15 March. In(c), snow at melting temperature is coloured black to highlight wet parts; in(e), grain radii smaller than 0.16 mm are coloured black, denoting
the smallest grain size class used in Katsushima et al. (2013); and in(f), ice formations are defined as modelled dry snow density exceeding 700 kg m−3.
simulations with the Richards equation only and simulations with preferential flow, respectively. Nevertheless, the simu-lations with preferential flow maintain the overall snowpack density profile generally well and the reduction in r2value
may be attributed to the fact that calibration of snow set-tling functions was not performed by considering the erential flow model. Another reason may be that with pref-erential flow, more water is moved downward and less wa-ter can refreeze in matrix flow in the upper snow layers. It may be argued that an underestimation of snow settling can be compensated for by an overestimation of refreezing wa-ter. In any case, the simulations with preferential flow stand out when looking at the highest snow density simulated in a layer within ±20 cm of an observed ice layer. In this case, much higher snow densities are found in individual layers under consideration of preferential flow.
As the manual snow density measurements in the field represent much larger vertical sections (20–30 cm), these measurements cannot be used to verify the much higher-resolution (1–2 cm or less) simulated densities on that scale. Time series using other measurement techniques, for ex-ample snow micro-penetrometry (Schneebeli and Johnson, 1998) or measuring volume and mass of excavated ice lay-ers (Watts et al., 2016), may assist in a more in-depth model verification in the future.
Figure 8 shows the POD for different dry snow density thresholds that define an ice layer in the simulations. The POD decreases with increasing threshold from 0.44 for 400
and 500 kg m−3to 0.10 for a threshold of 800 kg m−3for the
be-● ● ● ● ● ● ● ● ● ● ● ● ● ● ● ● ● ● ● ● ● ● ● ● ● ● ● ● ● ● ● ● ● ● ● ● ● ● ● ● ● ● ● ● ● ● ● ● ● ● ● ● ● ● ● ● ● ● ● ● ● ● ● ● ● ● ● ● ● ● ● ● ● ● ● ● ● ●
358 348 347 348
456 486 500 Sno w density ( kg m 3) Obs. REQ+PF (norm) REQ (norm) REQ+PF (high) REQ (norm) REQ+PF (high) REQ+PF (norm) 0 200 400 600 800 1000
Maximum simulated snow density within ±20 cm of observed ice layers Overall snow density distribution
-Figure 7.Box and whisker plot showing the distribution of snow
density from observations (obs), simulations with the Richards equation (REQ) and simulations with the dual domain approach to describe preferential flow (REQ+PF). On the left, simulated snow
density represents an aggregated snow density over multiple model layers to match the measured layer thickness. On the right, snow density of an individual model layer is shown. Boxes represent in-terquartile ranges (25th to 75th percentiles), and thick horizontal bars in each box denote the median (50th percentile), the value of which is shown directly below the bar. Whiskers (vertical lines and thin horizontal bars) represent the highest and lowest value within 1.5 times the interquartile range above the upper or below the lower
quartile, respectively. Notches are drawn at ±1.58 times the
in-terquartile range divided by the square root of the number of data points. Outliers are shown as individual dots.
0 0.2 0.4 0.6 0.8 1
400 500 600 700 800 900
Score
Threshold in dry snow density (kg m−3)
High resolution (REQ+PF)
Prob. of detection Prob. of null detection False alarm ratio Prediction bias 0 0.2 0.4 0.6 0.8 1
400 500 600 700 800 900
Score
Threshold in dry snow density (kg m−3)
Normal resolution (REQ+PF)
Prob. of detection Prob. of null detection False alarm ratio Prediction bias 0 0.2 0.4 0.6 0.8 1
400 500 600 700 800 900
Score
Threshold in dry snow density (kg m−3)
Normal resolution (REQ)
Prob. of detection Prediction bias
Figure 8.Contingency statistics as a function of threshold in dry
snow density that defines an ice layer in the simulations, for both normal and high-resolution simulations including preferential flow (REQ + PF) and normal-resolution simulations using the Richards equation only (REQ).
tween water flow and the ice matrix. However, the results also indicate that the model is able to capture a significant proportion of ice layers that formed in natural snowpacks, while maintaining the overall snowpack structure well. In contrast, simulations with the Richards equation only gener-ally do not reproduce any layer with a dry snow density ex-ceeding 600 kg m−3. The prediction bias is correspondingly
below 0.20 even for low thresholds of 400 kg m−3for
0.6 0.65 0.7 0.75 0.8 0.85 0.9 0.95 1
2000 2002 2004 2006 2008 2010 2012 2014 2016
r
2
Melt season
REQ (24 h) Avg: 0.90 REQ+PF (24 h) Avg: 0.90 REQ (1 h) Avg: 0.81 REQ+PF (1h) Avg: 0.81
Figure 9.r2for both hourly and daily snowpack runoff over the period 1 March to 31 May for each snow season.
−30 −20 −10 0 10 20 30
2000 2002 2004 2006 2008 2010 2012 2014 2016
Difference arrival date (days)
Melt season
REQ (first 10 mm) REQ+PF (first 10 mm) REQ (first 20 mm) Avg: 7.7 S.D.: 10.1 REQ+PF (first 20 mm) Avg: −2.9
S.D.: 8.7
Figure 10.Difference (in days) between modelled and measured
first 10 and 20 mm w.e. cumulative seasonal snowpack runoff (neg-ative values denote modelled runoff is earlier than measured runoff).
ing an ice layer. This indicates that the failure of reproducing ice layers in those type of simulations cannot be resolved by choosing low thresholds and that preferential flow seems to be a crucial process to simulate the formation of ice layers.
4.4 Snowpack runoff
In addition to ice layer formation, preferential flow is also assumed to impact snowpack runoff. Interestingly, Fig. 9 shows that, for the melt period, there is no consistent dif-ference between r2 values for daily and hourly snowpack
runoff whether or not preferential flow is considered. On av-erage both simulations have equalr2values of 0.81 and 0.90
Richards equation model to 2.9 days too early in the dual domain approach. Generally, the average time difference be-tween modelled and measured first 10 mm w.e. cumulative snowpack runoff is even more negative than the average time difference for 20 mm w.e. cumulative runoff. This suggests that particularly earliest season snowpack runoff from prefer-ential flow is overestimated in the simulations. The standard deviation of the time difference for 20 mm w.e. is slightly smaller for the preferential flow formulation than for the ma-trix flow only. The fact that the standard deviation is smaller indicates that yearly variability between observed and simu-lated runoff is smaller and that the model is apparently able to better explain yearly variability. In Würzer et al. (2016b) additional analysis of the role of preferential flow in produc-ing snowpack runoff durproduc-ing rain-on-snow events shows that for these events, snowpack runoff is better reproduced using the dual domain approach.
Although considering preferential flow improved the snowpack runoff simulation, year-to-year variability in model performance is still large. The difference between sim-ulations with or without preferential flow are often smaller than the year-to-year variability. For example, in melt season 2001 and 2010,r2values are low in both simulations and the
difference between the simulations is smaller than the differ-ence in r2 values with other years. Explanatory factors for
the year-to-year variability in model performance for repro-ducing snowpack runoff were not found. Snowpack charac-terising statistics, for example the observed number of ice layers or observed number of jumps in grain size and hard-ness, did not correlate significantly with r2 for snowpack
runoff or the arrival date. This is probably due to a combina-tion of errors in meteorological forcing condicombina-tions, observer bias in the biweekly snow profiles and the limited represen-tativeness of the snow lysimeter. Its surface area of 5 m2may
be considered too small to capture a representative area for snowpack runoff, such that randomness in the exact location where preferential flow paths form may influence the mea-surements (Kattelmann, 2000). Separating the individual er-rors appears to be difficult.
5 Discussion
In the implementation of the dual domain approach, we at-tempted to stay close to a physics-based process descrip-tion. Laboratory experiments and multidimensional snow-pack models have provided crucial insights in the preferen-tial flow and water ponding processes. However, the number of quantitative experimental studies is still limited and many aspects may be refined in further studies. The model uses four criteria to specify the dual domain approach: (1) the area involved in preferential flow, (2) a condition to move water from matrix flow to preferential flow, (3) a condition to move water from preferential flow to matrix flow and (4) a con-dition describing the refreezing process of preferential flow.
Two calibrating coefficients, related to criterion (3) and (4), were used to optimise the simulations.
The area involved in preferential flow (condition 1) is currently parametrised with grain size only. Given observa-tions from soil physics (e.g. Glass et al., 1989b), a depen-dence on the water influx rate is to be expected. Currently, laboratory settings, or field experiments with rainfall gen-erators, have generally large water input rates of typically 20 mm h−1 or more (Singh et al., 1997; Katsushima et al.,
2013; Würzer et al., 2016b). It turns out to be difficult to have controlled, constant and spatially well-distributed wa-ter input rates typically observed in nature (rainfall and melt rates of 1–5 mm h−1). The absence of studies at low water input rates makes the general validity of condition 1 we im-plemented uncertain. Furthermore, preferential flow was not observed for the finest grain size in Katsushima et al. (2013), which, as shown by the black coloured areas in Fig. 6e, exists only for short periods of time in new snow. Although regimes with stable flow have been identified for soil (DiCarlo, 2013), using larger snow samples to investigate preferential flow in snow could exclude the possibility that finger width exceeds the snow sample size for the finest grain size class.
We consider condition 2 to be a relatively well-founded approach, as the role of water entry suction in forming preferential flow was clearly identified in laboratory exper-iments (Katsushima et al., 2013) and turned out to be cru-cial in forming preferential flow in multidimensional models in agreement with laboratory experiments (Hirashima et al., 2014). However, also here, the exact parametrisation of water entry suction may be different for lower water influx rates.
Condition 3 may be one of the most uncertain ones. Under-standing the LWC distribution in a preferential flow path can-not be achieved by the Richards equation (DiCarlo, 2013). The other issue is that infiltration in an initially dry porous medium is not accurately described by the Richards equa-tion. We consider the assumption we made here that water will move from preferential flow to matrix flow based on the exceedance of a threshold in saturation one of the least sup-ported by experimental results.
refreez-ing of preferential flow probably slows down the downward propagation of the fingers.
The term preferential flow can be interpreted ambiguously. Two phenomena are known to cause deviations from a matrix infiltration pattern: flow fingering and macropore flow. Here, we consider flow fingering purely as the result of instabili-ties of the wetting front, which can occur in porous media with a uniform pore space distribution. Generally the prereq-uisite for this effect (coarse grains and low infiltration rates) is fulfilled for snow. However, once flow fingering is occur-ring in snow, microstructural changes of the snow grains in preferential flow paths will change the pore space distribu-tion to a bimodal or multimodal one. This has its equiva-lent in soils in, for example, worm holes, root channels and cracks. This effect is not considered in the dual domain ap-proach we propose, although it may have a profound impact on the efficiency of preferential flow paths. Modifications to the parameters of the preferential flow domain can be imag-ined to better represent a multimodal pore space distribution. In contrast, snow microstructure inside and around preferen-tial flow paths may not always consist of an ice matrix where the Richards equation would be a good description of water flow. However, a dual domain approach does not require both domains to be solved with the Richards equation, and another description of water flow in the preferential flow domain may be more appropriate.
Our simulations have a relatively low reproduction success of observed ice layers. The sensitivity study has revealed that one factor is the delicate balance between refreezing and fur-ther percolation. This is expected to be particularly delicate in alpine snowpacks, where the cold content is low and the ice layers are often thin. For cold regions, for example the Greenland Ice Sheet, the abundance of ice layers observed in ice cores may be easier to reproduce in simulations, as microstructural transitions formed by summer melt–freeze crusts below cold new snow from the accumulation period are more easy to capture in simulations. In contrast to alpine snowpacks, where the ground heat flux often maintains melt-ing conditions at the snowpack base, firn temperatures are generally well below freezing and create a large refreezing capacity.
Another factor contributing to the low POD is the small vertical and sometimes small horizontal scale on which ice layer formation happens in alpine snowpacks, which is dif-ficult to capture in simulations. A correct simulation of the snow microstructure is thereby a prerequisite for simulat-ing ice layer formation, although it is difficult to achieve. As an example, buried surface hoar may provide a marked mi-crostructural transition on which liquid water may pond and build ice layers. Whether or not the simulation is able to sim-ulate correctly the burial of surface hoar contributes to the failure or success in reproducing ice layers. Such a failure or success will remain throughout the rest of the snow season.
6 Conclusions
We proposed a dual domain approach for modelling liquid water flow in snow, which separates the pore space in a part that is representing matrix flow and a part that is rep-resenting preferential flow. This dual domain approach for physics-based snowpack models is able to simulate prefer-ential flow paths such that, by using two tuning parameters, a better agreement with the onset of snowpack runoff can be achieved. The difference between the first modelled and measured 20 mm w.e. cumulative snowpack runoff decreased from approximately 8 days too late to 3 days too early. Fur-thermore, preferential flow ponding on microstructural tran-sitions inside the snowpack and subsequent spreading in the matrix flow domain can simulate the otherwise lacking for-mation of dense layers by the model. Around 20 % of ob-served ice layers in the field over 16 snow seasons were cor-rectly simulated by the model in the form of a layer exceed-ing a dry snow density of 700 kg m−3. We showed that a dual
domain approach is able to provide a physics-based descrip-tion of preferential flow and ice layer formadescrip-tion that is cor-responding to findings in laboratory and field experiments. However, the formulation has two parameters that were cal-ibrated for this study. Although we do not resolve individual flow paths, as is done in multidimensional snowpack models, a dual domain approach can quantify the net effect of pref-erential flow on a snowpack in a 1-D snowpack model with much lower computational costs than multidimensional mod-els and only marginally larger computational cost compared to 1-D non-multi-domain models.
7 Data availability
Meteorological driving data for the SNOWPACK model as well as the biweekly snow profiles are accessible via doi:10.16904/1 (WSL Institute for Snow and Avalanche Re-search SLF, 2015) and doi:10.16904/2 (WSL Institute for Snow and Avalanche Research SLF, 2015), respectively. The SNOWPACK model is available under a LGPLv3 license at http://models.slf.ch. The version used in this study corre-sponds to revision 1028 of /branches/pref_flow.
The Supplement related to this article is available online at doi:10.5194/tc-10-2731-2016-supplement.
Acknowledgements. Funding for this research was provided by the
Edited by: P. Marsh
Reviewed by: two anonymous referees
References
Albert, M., Koh, G., and Perron, F.: Radar investiga-tions of melt pathways in a natural snowpack, Hy-drol. Process., 13, 2991–3000, doi:10.1002/(SICI)1099-1085(19991230)13:18<2991::AID-HYP10>3.0.CO;2-5, 1999. Avanzi, F., Hirashima, H., Yamaguchi, S., Katsushima, T., and De
Michele, C.: Observations of capillary barriers and preferen-tial flow in layered snow during cold laboratory experiments, The Cryosphere, 10, 2013–2026, doi:10.5194/tc-10-2013-2016, 2016.
Bartelt, P. and Lehning. M.: A physical SNOWPACK model for the Swiss avalanche warning Part I: Numerical model, Cold Reg. Sci. Technol., 35, 123–145, doi:10.1016/S0165-232X(02)00074-5, 2002.
Brun, E., David, P., Sudul, M., and Brunot, G.: A numerical model to simulate snow-cover stratigraphy for operational avalanche forecasting, J. Glaciol., 38, 13–22, 1992.
Calonne, N., Geindreau, C., Flin, F., Morin, S., Lesaffre, B., Rol-land du Roscoat, S., and Charrier, P.: 3-D image-based numeri-cal computations of snow permeability: links to specific surface area, density, and microstructural anisotropy, The Cryosphere, 6, 939–951, doi:10.5194/tc-6-939-2012, 2012.
Colbeck, S.: Water flow through heterogeneous snow, Cold Reg. Sci. Technol., 1, 37–45, doi:10.1016/0165-232X(79)90017-X, 1979.
Colbeck, S. C.: The layered character of snow covers, Rev. Geo-phys., 29, 81–96, doi:10.1029/90RG02351, 1991.
de la Peña, S., Howat, I. M., Nienow, P. W., van den Broeke, M. R., Mosley-Thompson, E., Price, S. F., Mair, D., Noël, B., and Sole, A. J.: Changes in the firn structure of the western Greenland Ice Sheet caused by recent warming, The Cryosphere, 9, 1203–1211, doi:10.5194/tc-9-1203-2015, 2015.
DiCarlo, D. A.: Stability of gravity-driven multiphase flow in porous media: 40 years of advancements, Water Resour. Res., 49, 4531–4544, doi:10.1002/wrcr.20359, 2013.
Eiriksson, D., Whitson, M., Luce, C. H., Marshall, H. P., Bradford, J., Benner, S. G., Black, T., Hetrick, H., and McNamara, J. P.: An evaluation of the hydrologic relevance of lateral flow in snow at hillslope and catchment scales, Hydrol. Process., 27, 640–654, doi:10.1002/hyp.9666, 2013.
Fierz, C., Armstrong, R., Durand, Y., Etchevers, P., Greene, E., Mc-Clung, D., Nishimura, K., Satyawali, P., and Sokratov, S.: The International Classification for Seasonal Snow on the Ground (ICSSG), Tech. rep., IHP-VII Technical Documents in Hydrol-ogy No. 83, IACS Contribution No. 1, UNESCO-IHP, Paris, 2009.
Glass, R. J., Parlange, J. Y., and Steenhuis, T. S.: Wetting front insta-bility 1. theoretical discussion and dimensional analysis, Water Resour. Res., 25, 1187–1194, doi:10.1029/WR025i006p01187, 1989a.
Glass, R. J., Parlange, J. Y., and Steenhuis, T. S.: Wetting front in-stability 2. experimental determination of relationships between system parameters and two-dimensional unstable flow field
be-havior in initially dry porous media, Water Resour. Res., 25, 1195–1207, doi:10.1029/WR025i006p01195, 1989b.
Hammonds, K., Lieb-Lappen, R., Baker, I., and Wang, X.: In-vestigating the thermophysical properties of the ice-snow in-terface under a controlled temperature gradient: Part I: Experi-ments & Observations, Cold Reg. Sci. Technol., 120, 157–167, doi:10.1016/j.coldregions.2015.09.006, 2015.
Hirashima, H., Yamaguchi, S., and Katsushima, T.: A multi-dimensional water transport model to reproduce preferential flow in the snowpack, Cold Reg. Sci. Technol., 108, 80–90, doi:10.1016/j.coldregions.2014.09.004, 2014.
Humphrey, N. F., Harper, J. T., and Pfeffer, W. T.: Thermal track-ing of meltwater retention in Greenland’s accumulation area, J. Geophys. Res., 117, F01010, doi:10.1029/2011JF002083, 2012. Illangasekare, T. H., Walter Jr., R. J., Meier, M. F., and Pfeffer, W. T.: Modeling of meltwater infiltration in subfreezing snow, Water Resour. Res., 26, 1001–1012, doi:10.1029/WR026i005p01001, 1990.
Katsushima, T., Kumakura, T., and Takeuchi, Y.: A multiple snow layer model including a parameterization of vertical water chan-nel process in snowpack, Cold Reg. Sci. Technol., 59, 143–151, doi:10.1016/j.coldregions.2009.09.002, 2009.
Katsushima, T., Yamaguchi, S., Kumakura, T., and Sato, A.: Experimental analysis of preferential flow in dry snowpack, Cold Reg. Sci. Technol., 85, 206–216, doi:10.1016/j.coldregions.2012.09.012, 2013.
Kattelmann, R.: Macropores in snowpacks of Sierra Nevada, Ann. Glaciol., 6, 272–273, 1985.
Kattelmann, R.: Snowmelt lysimeters in the evaluation of snowmelt models, Ann. Glaciol., 31, 406–410, doi:10.3189/172756400781820048, 2000.
Lehning, M., Bartelt, P., Brown, B., Russi, T., Stöckli, U., and Zim-merli, M.: SNOWPACK calculations for avalanche warning based upon a new network of weather and snow stations, Cold Reg. Sci. Technol., 30, 145–157, doi:10.1016/S0165-232X(99)00022-1, 1999.
Lehning, M., Bartelt, P., Brown, B., Fierz, C., and Satyawali, P.: A physical SNOWPACK model for the Swiss avalanche warning Part II: Snow microstructure, Cold Reg. Sci. Technol., 35, 147– 167, doi:10.1016/S0165-232X(02)00073-3, 2002a.
Lehning, M., Bartelt, P., Brown, B., and Fierz, C.: A physi-cal SNOWPACK model for the Swiss avalanche warning Part III: Meteorological forcing, thin layer formation and evalua-tion, Cold Reg. Sci. Technol., 35, 169–184, doi:10.1016/S0165-232X(02)00072-1, 2002b.
Machguth, H., MacFerrin, M., van As, D., Box, J. E., Charalam-pidis, C., Colgan, W., Fausto, R. S., Meijer, H. A. J., Mosley-Thompson, E., and van de Wal, R. S. W.: Greenland meltwa-ter storage in firn limited by near-surface ice formation, Nature Clim. Change, 6, 390–393, doi:10.1038/nclimate2899, 2016. Marsh, P.: Flow fingers and ice columns in a cold snow cover,
in: Proceedings of the 56th Annual Western Snow Conference, Western Snow Conference, Kalispell, Montana, 105–112, 1988. Marsh, P.: Snowcover formation and melt: recent advances
and future prospects, Hydrol. Process., 13, 2117–2134, doi:10.1002/(SICI)1099-1085(199910)13:14/15<2117::AID-HYP869>3.0.CO;2-9, 1999.
Resour. Res., 20, 1865–1874, doi:10.1029/WR020i012p01865, 1984.
Marsh, P. and Woo, M.-K.: Meltwater movement in natural het-erogeneous snow covers, Water Resour. Res., 21, 1710–1716, doi:10.1029/WR021i011p01710, 1985.
McGurk, B. J. and Marsh, P.: Flow-finger continuity in serial thick-sections in a melting sierran snowpack, in: Biogeochemistry of Seasonally Snow-Covered Catchments, Proceedings of a Boul-der Symposium, July 1995, IAHS publ. no. 228, 1995.
Pfeffer, W. T. and Humphrey, N. F.: Formation of ice layers by in-filtration and refreezing of meltwater, Ann. Glaciol., 26, 83–91, 1998.
Pfeffer, W. T., Meier, M. F., and Illangasekare, T. H.: Retention of Greenland runoff by refreezing: Implications for projected future sea level change, J. Geophys. Res., 96, 22117–22124, doi:10.1029/91JC02502, 1991.
Phillips, M., Haberkorn, A., Draebing, D., Krautblatter, M., Rhyner, H., and Kenner, R.: Seasonally intermittent water flow through deep fractures in an Alpine Rock Ridge: Gemsstock, Cen-tral Swiss Alps, Cold Reg. Sci. Technol., 125, 117–127, doi:10.1016/j.coldregions.2016.02.010, 2016.
Rees, A., Lemmetyinen, J., Derksen, C., Pulliainen, J., and En-glish, M.: Observed and modelled effects of ice lens for-mation on passive microwave brightness temperatures over snow covered tundra, Remote Sens. Environ., 114, 116–126, doi:10.1016/j.rse.2009.08.013, 2010.
Rössler, O., Froidevaux, P., Börst, U., Rickli, R., Martius, O., and Weingartner, R.: Retrospective analysis of a nonforecasted rain-on-snow flood in the Alps – a matter of model limitations or unpredictable nature?, Hydrol. Earth Syst. Sci., 18, 2265–2285, doi:10.5194/hess-18-2265-2014, 2014.
Roy, A., Royer, A., St-Jean-Rondeau, O., Montpetit, B., Picard, G., Mavrovic, A., Marchand, N., and Langlois, A.: Microwave snow emission modeling uncertainties in boreal and subarctic envi-ronments, The Cryosphere, 10, 623–638, doi:10.5194/tc-10-623-2016, 2016.
Schneebeli, M.: Development and stability of preferential flow paths in a layered snowpack, in: Biogeochemistry of Season-ally Snow-Covered Catchments (Proceedings of a Boulder Sym-posium July 1995), edited by: Tonnessen, K., Williams, M., and Tranter, M., 89–95, AHS Publ. no. 228, 1995.
Schneebeli, M. and Johnson, J.: A constant-speed penetrometer for high-resolution snow stratigraphy, Ann. Glaciol., 26, 107–111, 1998.
Singh, P., Spitzbart, G., Hübl, H., and Weinmeister, H.: Hydrolog-ical response of snowpack under rain-on-snow events: a field study, J. Hydrol., 202, 1–20, doi:10.1016/S0022-1694(97)00004-8, 1997.
Surfleet, C. G. and Tullos, D.: Variability in effect of climate change on rain-on-snow peak flow events in a temperate climate, J. Hy-drol., 479, 24–34, doi:10.1016/j.jhydrol.2012.11.021, 2013. Vikhamar-Schuler, D., Hanssen-Bauer, I., Schuler, T., Mathiesen,
S., and Lehning, M.: Use of a multilayer snow model to as-sess grazing conditions for reindeer, Ann. Glaciol., 54, 214–226, doi:10.3189/2013AoG62A306, 2013.
Watts, T., Rutter, N., Toose, P., Derksen, C., Sandells, M., and Woodward, J.: Brief communication: Improved measurement of ice layer density in seasonal snowpacks, The Cryosphere, 10, 2069–2074, doi:10.5194/tc-10-2069-2016, 2016.
Wever, N., Fierz, C., Mitterer, C., Hirashima, H., and Lehning, M.: Solving Richards Equation for snow improves snowpack melt-water runoff estimations in detailed multi-layer snowpack model, The Cryosphere, 8, 257–274, doi:10.5194/tc-8-257-2014, 2014a. Wever, N., Jonas, T., Fierz, C., and Lehning, M.: Model sim-ulations of the modulating effect of the snow cover in a rain-on-snow event, Hydrol. Earth Syst. Sci., 18, 4657–4669, doi:10.5194/hess-18-4657-2014, 2014b.
Wever, N., Schmid, L., Heilig, A., Eisen, O., Fierz, C., and Lehning, M.: Verification of the multi-layer SNOWPACK model with dif-ferent water transport schemes, The Cryosphere, 9, 2271–2293, doi:10.5194/tc-9-2271-2015, 2015b.
Wever, N., Vera Valero, C., and Fierz, C.: Assessing wet snow avalanche activity using detailed physics based snow-pack simulations, Geophys. Res. Lett., 43, 5732–5740, doi:10.1002/2016GL068428, 2016.
Williams, M. W., Rikkers, M., and Pfeffer, W. T.: Ice ccolumn and frozen rills in a warm snowpack, Green Lakes Valley, Colorado, U.S.A., Nord. Hydrol., 31, 169–186, 2000.
Willmott, C. J.: On the validation of models, Phys. Geogr., 2, 184– 194, 1981.
WSL Institute for Snow and Avalanche Research SLF: Manual bi-weekly snow profiles from Weissfluhjoch, Davos, Switzerland, doi:10.16904/2, 2015.
WSL Institute for Snow and Avalanche Research SLF, Meteoro-logical and snowpack measurements from Weissfluhjoch, Davos, Switzerland, 29 September 2015, 1, doi:10.16904/1, dataset, 2015.
Würzer, S., Jonas, T., Wever, N., and Lehning, M.: Influ-ence of initial snowpack properties on runoff formation dur-ing rain-on-snow events, J. Hydrometeor., 17, 1801–1815, doi:10.1175/JHM-D-15-0181.1, 2016a.
Würzer, S., Wever, N., Juras, R., Lehning, M., and Jonas, T.: Model-ing liquid water transport in snow under rain-on-snow conditions – considering preferential flow, Hydrol. Earth Syst. Sci. Discuss., doi:10.5194/hess-2016-351, in review, 2016b.
Yamaguchi, S., Watanabe, K., Katsushima, T., Sato, A., and Ku-makura, T.: Dependence of the water retention curve of snow on snow characteristics, Ann. Glaciol., 53, 6–12, doi:10.3189/2012AoG61A001, 2012.
Ye, H., Yang, D., and Robinson, D.: Winter rain on snow and its as-sociation with air temperature in northern Eurasia, Hydrol. Pro-cess., 22, 2728–2736, doi:10.1002/hyp.7094, 2008.