www.nat-hazards-earth-syst-sci.net/17/61/2017/ doi:10.5194/nhess-17-61-2017
© Author(s) 2017. CC Attribution 3.0 License.
Improvement of RAMS precipitation forecast at the
short-range through lightning data assimilation
Stefano Federico, Marco Petracca, Giulia Panegrossi, and Stefano Dietrich ISAC-CNR, UOS of Rome, via del Fosso del Cavaliere 100, 00133 Rome, Italy Correspondence to:Stefano Federico ([email protected])
Received: 8 September 2016 – Published in Nat. Hazards Earth Syst. Sci. Discuss.: 27 September 2016 Revised: 26 December 2016 – Accepted: 29 December 2016 – Published: 23 January 2017
Abstract. This study shows the application of a total light-ning data assimilation technique to the RAMS (Regional At-mospheric Modeling System) forecast. The method, which can be used at high horizontal resolution, helps to initiate convection whenever flashes are observed by adding water vapour to the model grid column. The water vapour is added as a function of the flash rate, local temperature, and graupel mixing ratio. The methodology is set up to improve the short-term (3 h) precipitation forecast and can be used in real-time forecasting applications. However, results are also presented for the daily precipitation for comparison with other studies. The methodology is applied to 20 cases that occurred in fall 2012, which were characterized by widespread convec-tion and lightning activity. For these cases a detailed dataset of hourly precipitation containing thousands of rain gauges over Italy, which is the target area of this study, is available through the HyMeX (HYdrological cycle in the Mediter-ranean Experiment) initiative. This dataset gives the unique opportunity to verify the precipitation forecast at the short range (3 h) and over a wide area (Italy).
Results for the 27 October case study show how the methodology works and its positive impact on the 3 h pre-cipitation forecast. In particular, the model represents better convection over the sea using the lightning data assimilation and, when convection is advected over the land, the precipita-tion forecast improves over the land. It is also shown that the precise location of convection by lightning data assimilation improves the precipitation forecast at fine scales (meso-β).
The application of the methodology to 20 cases gives a sta-tistically robust evaluation of the impact of the total lightning data assimilation on the model performance. Results show an improvement of all statistical scores, with the exception of the bias. The probability of detection (POD) increases by
3–5 % for the 3 h forecast and by more than 5 % for daily precipitation, depending on the precipitation threshold con-sidered.
Score differences between simulations with or without data assimilation are significant at 95 % level for most scores and thresholds considered, showing the positive and statisti-cally robust impact of the lightning data assimilation on the precipitation forecast.
1 Introduction
The inclusion of the effects of deep convection in the initial conditions of numerical weather prediction (NWP) models is one of the most important applications for reducing the spin-up time and improving initial conditions (Stensrud and Fritsch, 1994; Alexander et al., 1999). In recent years, sev-eral studies have shown the positive impact that lightning as-similation has on the weather forecast and especially on the precipitation forecast (Alexander et al., 1999; Chang et al., 2001; Papadopulos et al., 2005; Mansell et al., 2007; Fierro et al., 2013; Giannaros et al., 2016).
Lightning data are a proxy for identifying the occurrence of deep convection, which relates to convective precipitation (Goodman et al., 1988). In addition to their ability to lo-cate precisely the deep convection and heavy precipitation, lightning data have several advantages: availability in real time with few gaps (reliability), compactness (a low band is required to transfer the data), and long-range detection of storms over the oceans and beyond the radars (Mansell et al., 2007).
NWP. In the first studies (Alexander et al., 1999; Chang et al., 2001), lightning was used in conjunction with rainfall es-timates from microwave data of polar orbiting satellites to derive a relation between the cloud to ground flashes and rainfall. Then the rainfall estimated from lightning was con-verted to latent heat nudging, which was assimilated in NWP (Jones and Macperson, 1997). These experiments showed a positive impact of the lightning data assimilation on the 12– 24 h weather forecast.
Papadopulos et al. (2005) nudged relative humidity pro-files associated with deep convection and the adjustment was proportional to the flash rate observed by the ZEUS net-work (Lagouvardos et al., 2009). A modification of the Kain– Fritsch (Kain and Fritsch, 1993) convective parameterization in COAMPS (Coupled Ocean-Atmosphere Mesoscale Pre-diction System; Hodur, 1997) was introduced by Mansell et al. (2007). They enabled lightning to control the cumulus parameterization scheme activation. Recently, Giannaros et al. (2016) implemented a similar approach in the Weather Research and Forecasting (WRF) model, showing the posi-tive and statistically robust impact of the lightning data as-similation on the 24 h rainfall forecast for eight convective events over Greece. Fierro et al. (2013) and Qie et al. (2014) introduced two lightning data assimilation schemes for the WRF model intervening on the mixing ratios of the hydrom-eteors (water vapour in the case of Fierro et al., 2013, and ice crystals, graupel and snow in Qie et al., 2014). Both stud-ies, which are performed at cloud resolving scales, show that lightning assimilation improves the precipitation forecast.
Most of the studies cited above are based on a case study approach. However, Giannaros et al. (2016) applied the methodology to eight convective cases that occurred in Greece from 2010 to 2013. Considering a larger number of cases allowed them to statistically test the improvement of the precipitation forecast through lightning data assimilation. Moreover, their methodology is designed to be realistic and usable in the operational forecast.
In a recent study, Federico et al. (2014) introduced a scheme to simulate lightning in RAMS (Regional Atmo-spheric Modeling System). Because the lightning distribu-tion is well correlated to areas of deep convecdistribu-tion, they con-cluded that lightning simulation can be a useful tool to eval-uate the reliability of the NWP forecast in real time. In their study, however, lightning observations were used as a diag-nostic tool.
In this paper, a total lightning data assimilation algorithm is used in the RAMS model. The assimilation scheme is sim-ilar to that of Fierro et al. (2013), with few modifications to account for different spatial and temporal resolutions of the two studies and for the different model suites. In addition, the methodology presented in this paper is designed to be used in real-time NWP. This paper considers the short-term forecast (3 h), even though the results for daily precipitation, accumu-lated from the 3 h precipitation forecast, are also shown for completeness and for comparison with other studies.
To evaluate statistically the impact of the lightning data as-similation on the precipitation forecast, we consider 20 con-vective cases that occurred in fall 2012 over Italy, which is the target area of this study. Most of these events oc-curred during the HyMeX SOP1 (HYdrological cycle in the Mediterranean Experiment – first special observing period), which was held from 5 September 2012 to 6 November 2012. HyMeX (Drobinski et al., 2014; Ducroq et al., 2014) is an international experimental program that aims to advance sci-entific knowledge of water cycle variability in the Mediter-ranean basin. This goal is pursued through monitoring, anal-ysis, and modelling of the regional hydrological cycle in a seamless approach. In HyMeX special emphasis is given to the topics of the occurrence of heavy precipitation and floods, and their societal impacts, which were the subjects of the SOP1. One of the products of the HyMeX SOP1 is a database of hourly precipitation available for 2944 raingauges over Italy belonging to the Italian DPC (Department of Civil Pro-tection; Davolio et al., 2015). This database extends behind the period of the HyMeX SOP1 and contains all the events considered in this paper.
The paper is organized as follows: Sect. 2 shows the RAMS configuration, the methodology used to assimilate to-tal lightning data, and the strategy used in the simulations. Section 3 gives the results: first a case study of deep vection occurred over Italy during HyMeX SOP1 is con-sidered to show how the lightning data assimilation works (Sect. 3.1); then the scores for the 20 cases are shown in Sect. 3.2, which also shows the statistical robustness of the difference between the precipitation forecasts of the simula-tions with or without total lightning data assimilation. The discussion and conclusions are given in Sect. 4.
2 Methodology
2.1 The RAMS model configuration
The RAMS model is used in this study. This section is a brief description of the model set-up, while details on the model are given in Cotton et al. (2003).
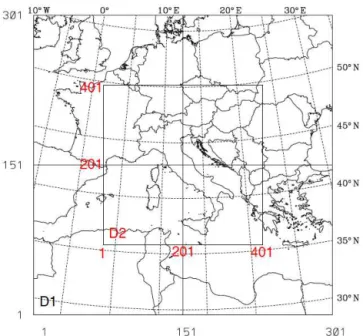
We use two one-way nested domains at 10 km (R10) and 4 km (R4) horizontal resolutions, respectively (Fig. 1). The model is configured with 36 terrain-following vertical lev-els for both domains. The model top is at 22 400 m (about 40 hPa). The distance of the levels is gradually increased from 50 to 1200 m. Below 1000 m the spacing between levels is less than 200 m; above 5000 m the distance between levels is 1200 m.
Figure 1.The two domains (D1, D2). D1 has 301 grid points in both the WE and SN directions; D2 has 401 grid points in both WE and SN directions.
describing their interactions as well as their exchanges with the atmosphere.
Explicitly resolved precipitation is computed by the WRF single-moment six-class microphysics scheme (WSM6; Hong and Lim, 2006). This scheme was recently imple-mented in RAMS (Federico, 2016) and showed the best per-formance among the microphysics schemes available in the model for a forecast period spanning 50 days of the HyMeX SOP1 at 4 km horizontal resolution. The WSM6 scheme ac-counts for the following water variables: vapour, cloud water, cloud ice, rain, snow, and graupel. The best configuration of Federico (2016) is used in this paper and is hereafter referred to as control (CNTRL).
Subgrid-scale effect of clouds is parameterized following Molinari and Corsetti (1985). They proposed a form of the Kuo scheme (Kuo, 1974) accounting for updrafts and down-drafts. The convective scheme is applied to the 10 km grid only.
The unresolved transport is parameterized by the K the-ory following Smagorinsky (1963), which relates the mix-ing coefficients to the fluid strain rate and includes correc-tions for the influence of the Brunt–Vaisala frequency and the Richardson number (Pielke, 2002).
The Chen and Cotton (1983) scheme is used to compute short and long-wave radiation. The scheme accounts for con-densate in the atmosphere but not for the specific hydrome-teor type.
The initial and dynamic boundary conditions (BC) are in-troduced in Sect. 2.3.
Before concluding this section, it is important to note that 4 km horizontal resolution of the finer grid corresponds to the grey area for convection and it is slightly below actual stan-dards (2–3 km). This resolution was motivated by operational purposes: the methodology of this paper is implemented in a real-time weather forecasting system at ISAC-CNR and we study the performance of this specific system. Preliminary results of the impact of the horizontal resolution on the light-ning assimilation are discussed in Sect. 4.
2.2 Lightning data and assimilation procedure
Lightning data used in this paper are those observed by LINET (LIghtning detection NETwork; Betz et al., 2009), which is a European lightning location network for high-precision detection of total lightning, cloud to ground and intra cloud lightning, with utilization of VLF/LF techniques (in range between 1 and 200 KHz).
The network has more than 550 sensors in several coun-tries worldwide, with very good coverage over central Eu-rope and central and western Mediterranean (from 10◦
W to 35◦
E in longitude and from 30 to 65◦
N in latitude). The lightning three-dimensional location is detected using the time of arrival difference triangulation technique (Betz et al., 2009). The lightning strokes are detected with high precision (150 m for an average distance between sensors of 200 km) in both horizontal and vertical directions. The LINET “strokes” are grouped into “flashes” before assimilation in the model. In particular, all events recorded by LINET that occur within 1 s and in an area with a radius of 10 km are binned into a single flash (Federico et al., 2014).
Observed flashes are mapped onto the RAMS grid for as-similation in space and time. In particular, the asas-similation procedure computes the number of flashes occurring in each RAMS grid cell in the past 5 min (X). Then the water vapour mixing ratio is computed as
qv=Aqs+B·qs·tanh(CX)·
1−tanh
DQαg
, (1)
whereA=0.86,B=0.15,C=0.30D=0.25,α=2.2,qsis
the saturation mixing ratio at the model atmospheric temper-ature, andQgis the graupel mixing ratio (g kg−1). The water
vapour mixing ratio derived from Eq. (1) is similar to Fierro et al. (2013). There are two changes: first theCcoefficient is larger in this study (in Fierro et al., 2013,C=0.01), which
Table 1.The 20 case studies.
Month Days
September 2012 12, 13, 14, 24, 26, 30
October 2012 12, 13, 15, 26, 27, 28, 29, 31
November 2012 4, 5, 11, 20, 21, 28
not increase considerably) the false alarms. It is noted that Fierro et al. (2013) found little sensitivity of the results by varyingAby 5 %.
The water vapour derived from Eq. (1) is substituted to the simulated value at a grid point where electric activity is ob-served and relative humidity is below 86 %. By this choice we only add water vapour to the simulated field, leaving it unchanged if the simulated water vapour is larger than that of Eq. (1). Moreover, the water vapour is substituted only in the charging zone (from 0 to−25◦C), which is the mixed-phase
graupel-rich zone associated with electrification and light-ning activity (MacGorman and Rust, 1998). The increase of qv, Eq. (1), is inversely proportional to the simulated grau-pel mixing ratio. WhenQgis 3 g kg−1the second term of the
right-hand side of Eq. (1) is ineffective (see Fig. 7 of Fierro et al., 2013 for the dependency of Eq. 1 on the graupel mixing ratio). For a given value ofQgbetween 0 and 3 g kg−1, the
water vapour of Eq. (1) increases as a function of the gridded flash rateX.
It is noted that we change the water vapour in the charg-ing zone between 0 and −25◦
C, without a relaxing zone. The water vapour, however, is redistributed by the model ad-vection, diffusion, and diabatic processes and is considerably changed outside the charging zone (see the discussion of this paper; Federico et al., 2016).
2.3 Simulation strategy and verification
Twenty case studies that occurred in fall 2012 were selected. The events are reported in Table 1 and were all characterized by widespread convection, lightning activity, and moderate– heavy precipitation over Italy. The events of Table 1 comprise eight of the nine IOP (intense observing period) declared in Italy (see Table 5 of Ferretti et al., 2014, for the complete list of the IOP) during HyMeX SOP1 and few other cases of November 2012.
A 36 h forecast at 10 km horizontal resolution is per-formed for each case (R10). The initial and BC for this run are given by the 12:00 UTC assimilation–forecast cycle of the ECMWF (European Centre for Medium-Range Weather Forecasts). Initial and BC are available at 0.25◦
horizontal resolution. The R10 forecast starts at 12:00 UTC of the day before the day of interest (actual day, Table 1) and the first 12 h, which also account for the spin-up time, are discarded from the evaluation. The R10 forecast is made to give the ini-tial and BC to the 4 km horizontal resolution forecast (R4), avoiding the abrupt change of resolution from the ECMWF
d-1 d
21 00 03 06 09 12 15 00
d+1 18
Assimilation period
18 21
…...
Forecast CNTRL
t (UTC) ASSIM
Figure 2.Synopsis of the simulations F3HA6 (below the timeline). The blue line is the assimilation stage, while the red line is the fore-cast stage;d,d+1, andd−1 are the actual day, the day after, and the day before the actual day, respectively. In the upper part of the figure the CNTRL and ASSIM simulations are shown.
initial conditions and BC (0.25◦
) to the R4 horizontal resolu-tion.
It is noted that the configuration F3HA6 was chosen be-cause it can be applied in the operational context. The sim-ulation R10 takes less than 1 h to complete the 36 h forecast on a 64 core state of the art cluster. Each simulation F3HA6 takes 20–25 min using a 64 cores state of the art cluster, which makes the forecast available for operational purposes. Continuous advancing of computing power will give the pos-sibility to apply the methodology at finer horizontal resolu-tions for extended areas, as that considered in this paper, as well as to reach the kilometric scale for limited areas.
Even though the main focus of this paper is on the short-term (3 h) forecast, the daily precipitation accumulated from the 3 h forecasts is also considered for comparison with other studies available in the literature. For F3HA6 the daily pre-cipitation is given by adding the eight 3 h forecasts available for the actual day (Fig. 2).
One of the products of the HyMeX initiative is a database of hourly precipitation from the network of the DPC of Italy, which consists of 2944 rain gauges all over Italy. The dataset is available at http://mistrals.sedoo.fr/?editDatsId= 1282&datsId=1282&project_name=MISTR&q=DPC and it is used to derive 3 h and daily rainfall, which is then used to verify the model.
For the verification of the quantitative precipitation fore-cast (QPF), the model output at the closest grid point of a rain gauge is considered. When two or more rain gauges fall in the same model grid cell, the average precipitation recorded by these rain gauges is considered.
Statistical verification is performed by 2×2 contingency
tables for different precipitation thresholds. For the 3 h rain-fall comparison the thresholds are 0.2, 1.0, 3.0, 5.0, 7.5, 10.0, 15.0, and 20 mm/3 h. For daily precipitation the thresholds are 1, 5, 10, 20, 40, and 60 mm day−1, with 60 mm day−1 (7.5 mm/3 h) considered as the threshold for severe precipi-tation events in the Mediterranean Basin (Jansa et al., 2014). From the hits (a), false alarms (b), misses (c), and correct no forecasts (d) of the contingency tables, the probability of detection (POD; range [0, 1], where 1 is the perfect score, i.e. when no misses or false alarms occur), the false alarm ra-tio (FAR; range [0, 1], where 0 is the perfect score), the bias (range [0,+∞), where 1 is the perfect score), and the
equi-table threat score (ETS; range [−1/3, 1], where 1 is the per-fect score and 0 is a useless forecast) are computed (Wilks, 2006):
POD= a
a+c, (2)
FAR= b
a+b, (3)
bias=a+b
a+c, (4)
ETS= a
−ar
a+b+c−ar
andar=
(a+b)(a+c)
a+b+c+d , (5) where ar is the probability to have a correct forecast by chance (Wilks, 2006).
The POD gives the fraction of the observed rain events that were correctly forecast. The FAR gives the fraction of rain forecast events that did not occur. The bias tells us the fraction of rain forecast events with respect to the rain ob-served events. The ETS measures the fraction of obob-served and/or forecast rain events that were correctly predicted, adjusted for hits associated with a random forecast, where the forecast occurrence/non-occurrence is independent of observation/non-observation.
In order to have a measure of the difference between the CNTRL and F3HA6 forecast, a hypothesis test to verify that the score difference between the two competing models is significant at a predefined significance level (90 %,α=0.1;
or 95 %,α=0.05) is made. The test was originally proposed
by Hamill (1999), is based on resampling, and is discussed in Appendix A.
3 Results
3.1 The 27 October 2012 case study
The event studied in this section is taken from the HyMeX SOP1 campaign, which was focused on heavy precipitation and its societal impact (Ducroq et al., 2014; Ferretti et al., 2014). Nine of the 20 IOPs considered in SOP1 occurred in Italy.
During SOP1, several upper level troughs extended from the northern and central Europe toward the Mediterranean Basin or entered in the basin as deep trough. Few of them de-veloped a cut-off low at 500 hPa; the interaction between the upper level troughs and the orography of the Alps generated a low pressure pattern at the surface in Northern Italy, and usu-ally the whole system moved along the Italian peninsula. The 27 October 2012 case study, also referred as IOP16a, belongs to this class of events, and it eventually evolved in a cut-off at 500 hPa on 28–29 October (IOP16c). This event, character-ized by widespread convection and intense lightning activity, caused huge precipitation all along the peninsula and also peak values of water level on the Venice Lagoon, where the sea level exceeded twice the warning level of 120 cm (Ca-saioli et al., 2013; Mariani et al., 2015).
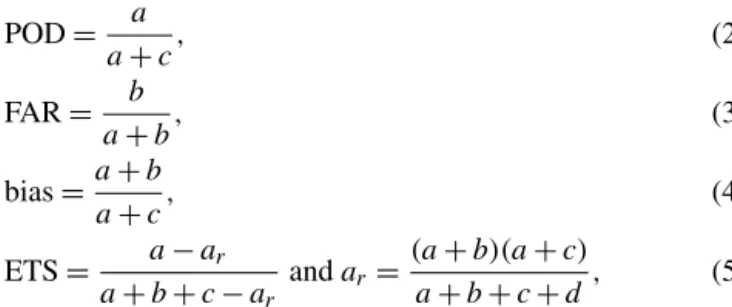
Figure 3 shows the synoptic situation at 12:00 UTC on 27 October 2012. At 500 hPa, Fig. 3a, a trough extends from NE Europe toward the western Mediterranean. The interac-tion between the trough and the Alps generated a mesolow over Northern Italy, as shown by the 990 hPa contour in Fig. 3b, that caused a cyclonic circulation over most of the peninsula.
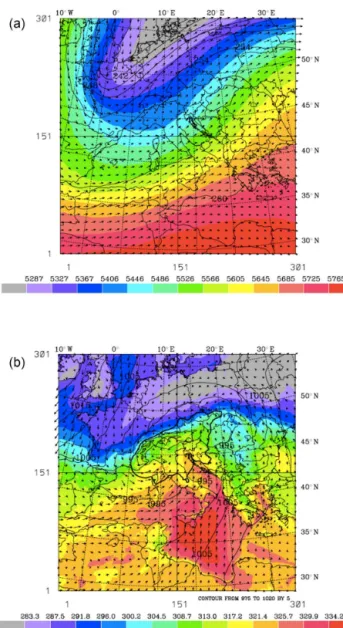
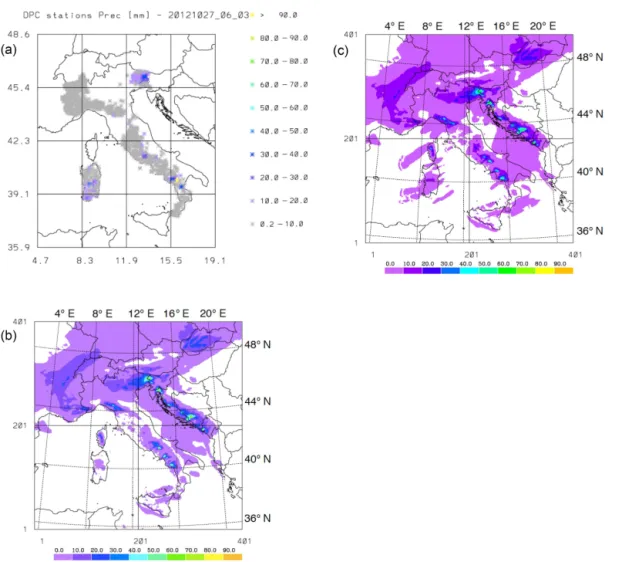
Figure 4a shows the lightning distribution observed by LINET on 27 October 2012. From Fig. 4a, convection is ap-parent over the Tyrrhenian Sea and it is enhanced over land because of the interaction between the humid and unstable air masses from the sea and the orography of Italy.
The daily precipitation (Fig. 4b) shows the widespread convection over the Apennines, with several stations report-ing more than 90 mm day−1. More than 200 mm rain is re-ported in two stations in Southern Italy (15.84◦
E, 40.31◦
N; 207 mm) and (15.98◦
E, 40.16◦
N; 220 mm), while the largest precipitation recorded in NE Italy is 141 mm (13.54◦
E, 45.85◦
N). Note also the abundant precipitation over Sardinia and over the north-east of Italy. It is important to note that the rainfall of Fig. 4b is computed by summing the 1 h pre-cipitation registered by the rain gauges. If one of the 1 h observations is unavailable, the rain gauge does not appear in Fig. 4b. So, when verifying the precipitation for shorter timescales, different rain gauges could appear compared to those of Fig. 4b.
Figure 5a and b show the daily precipitation forecast of the CNTRL run and the daily accumulated precipitation of the F3HA6 run. Figure 5a and b shows a high precipitation amount over the Apennines (>90 mm day−1) all along the peninsula, in agreement with observations. However, the pre-cipitation is overestimated by both CNTRL and F3HA6, es-pecially above 30 mm day−1. This is apparent by comparing the area of the 90 mm day−1threshold in Fig. 5a and b with the comparatively few rain gauges reporting this precipita-tion amount. As it will be shown in the next secprecipita-tion, this is a general behaviour of the RAMS model with the set-up used in this paper. Other features shown by Fig. 5a and b are a very heavy precipitation spell in NE Italy, whose area is overestimated by CNTRL and F3HA6; a high precipitation spell over the Liguria–Tuscany area, which is only partially revealed by observations due to the lack of data; a moderate precipitation over Sardinia, which is underestimated by the CNTRL forecast both for the precipitation area and amount. Even if CNTRL and F3HA6 share several precipitation features in common, there are important differences between Fig. 5a and b. Convection over the sea is underestimated by CNTRL. Even if we cannot prove it by the precipita-tion amount, the intense electrical activity over the central Mediterranean Sea, and especially over the Tyrrhenian Sea, shows that the convective activity over the sea is underesti-mated by CNTRL.
Convection over the sea is simulated by F3HA6 thanks to the lightning data assimilation. When convection is advected over the land it increases the precipitation. This is clearly shown by the precipitation over Sardinia, which increases both in areal coverage and rainfall amount for F3HA6 com-pared to CNTRL.
Other differences between the precipitation field of CN-TRL and F3HA6 can be discussed more easily by the differ-ence of the precipitation fields. Figure 5c shows the precipi-tation difference between CNTRL and F3HA6 in this order,
Figure 3. Synoptic situation at 12:00 UTC on 27 October 2012.
(a)500 hPa: temperature (black contours from 236 to 263 K
ev-ery 3 K), geopotential height (filled contours, values shown by the colour bar at the bottom), and wind vectors (maximum wind value 41 m s−1).(b) Surface: sea level pressure (contour from 975 to 1020 hPa every 5 hPa, the thick line is the 990 hPa contour), equiv-alent potential temperature (filled contours, values shown by the colour bar at the bottom), and winds (maximum wind vector is 17 m s−1) simulated at 25 m above the underlying surface in the terrain-following coordinates of RAMS. This figure is derived from the RAMS run at 10 km horizontal resolution. The bottom and left axes show the grid point number, while the top and right axes show the geographical coordinates.
so that positive values show larger precipitation for CNTRL, while negative values show larger precipitation for F3HA6.
light-Figure 4. (a) Lightning density on 27 October 2012 (number of flashes/16 km2). The lightning number is obtained by remapping the lightning observed by LINET onto the RAMS grid at 4 km hor-izontal resolution. Note that the lightning is cut on all sides (this is especially evident on the eastern bound) because of the data avail-ability. The bottom and left axes show the grid point number, while the top and right axes show the geographical coordinates.(b)Daily precipitation (mm) recorded by available rain gauges on 27 Octo-ber 2012.
ning assimilation on the forecast. However, the largest dif-ferences are found along the Apennines with values up to 80 mm day−1.
In general, the lightning assimilation increases the precipi-tation, but Fig. 5c also shows areas where the precipitation of F3HA6 decreases compared to CNTRL because of the dif-ferent evolution of the storm in the two simulations. This is especially evident over the Adriatic coast of the Balkans where positive–negative patterns alternate every few tens of
kilometres. We will discuss further this point later on in this section.
Up to now, we considered the impact of the lightning as-similation on the daily precipitation, i.e. when the rainfall of the eight F3HA6 forecasts in a day are added, but the main focus of this paper is on the short-term precipitation fore-cast. To consider this point, Fig. 6a shows the observed pre-cipitation accumulated between 06:00 and 09:00 UTC, and the corresponding precipitation for the CNTRL (Fig. 6b) and F3HA6 (Fig. 6c).
Figure 6a shows considerable precipitation spells (about 40 mm/3 h) over NE Italy, in some spots over the Apennines all along Italy, and, somewhat smaller, over Sardinia.
Comparing Fig. 6b with Fig. 6a it is apparent that the CN-TRL forecast is able to catch several features of the precip-itation field, as the local spots of heavy rain over the Apen-nines or the rain spell over NE Italy, the main error being the scarce precipitation simulated over Sardinia. This issue is in part solved by the F3HA6 forecast (Fig. 6c), which shows larger precipitation compared to CNTRL over Sardinia.
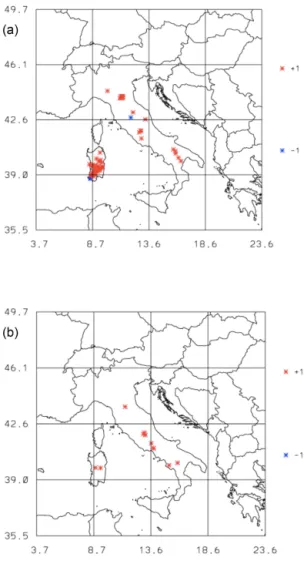
To better focus on the improvement given by the light-ning data assimilation on the short-term QPF, we consider the precipitation hits, i.e. the correct forecasts, of the contin-gency tables. Figure 7a shows the difference between the hits of the F3HA6 and CNTRL (in this order) for the 1 mm/3 h (8 mm day−1) threshold. In Fig. 7a, the +1 (red asterisk)
shows a station where the CNTRL forecast did not predict a precipitation equal or larger than the threshold, while the F3HA6 correctly predicted a rainfall equal or larger than the threshold at the rain gauge. The−1 value (blue aster-isk) shows the opposite behaviour. In Fig. 7a there are 52 new correctly predicted events for F3HA6. They are located in the Apennines and, mostly, over Sardinia, where CNTRL missed the forecast (Fig. 5a and b). There are also two sta-tions where the lightning assimilation worsens the forecast, because of the different evolutions of the storms in CNTRL and F3HA6, but the benefits of the lightning data assimila-tion on the short-term QPF are nevertheless apparent for the 1 mm/3 h threshold.
Figure 7b shows the difference between the hits of F3HA6 and CNTRL for the 10 mm/3 h (80 mm day−1) threshold, which is more interesting when considering moderate–high rainfall amounts. For this threshold, the lightning data as-similation improves the forecast because 12 new events are correctly predicted by F3HA6 along the Apennines and over Sardinia.
Figure 5. (a)Daily precipitation (mm) forecast of CNTRL (maximum value 300 mm in Southern Italy; over NE Italy the maximum value
is 135 mm);(b)daily precipitation (mm) forecast obtained by summing the eight 3 h forecasts of F3HA6 (the maximum value is 320 mm
in Southern Italy; over NE Italy the maximum simulated value is 132 mm);(c)difference of daily precipitation (mm) between CNTRL and F3HA6.
gauges) thresholds, while losing only two stations correctly predicted by CNTRL for the 1 mm/3 h threshold. This shows not only that the precipitation is added where necessary but also that it is subtracted where it did not occur; i.e. only two correct forecasts are lost by the lightning data assim-ilation. For example, between 03:00 and 06:00 UTC there are 110 stations where the precipitation is reduced by more than 1 mm/3 h, 20 stations where it is reduced by more than 5 mm/3 h, and 7 stations for which the precipitation is re-duced by more than 10 mm/3 h.
It is worth noting that the stations correctly forecast by both CNTRL and F3HA6 for a given precipitation threshold do not appear in Fig. 7a and b. This occurs, for example, for the rain gauges in NE Italy.
This section showed how the data assimilation technique of this study works and how it is able to add new correct forecasts (hits) to CNTRL for a case study. In the following section, scores based on contingency tables are presented for a total of 20 case studies in order to quantify, in a statistically robust way, the benefits of the total lightning data assimila-tion on the short-term QPF.
3.2 Statistical scores
Figure 6. (a)Precipitation (mm) recorded by rain gauges between 06:00 and 09:00 UTC;(b)as in(a)for the CNTRL forecast;(c)as in(a)
for the F3HA6 forecast.
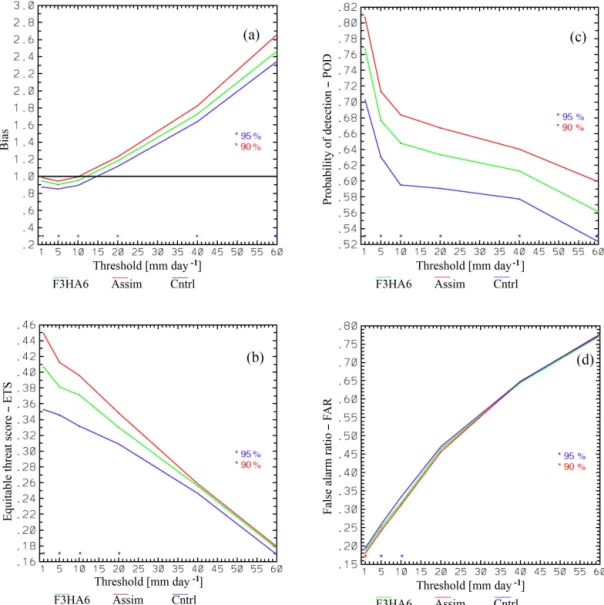
Figure 8a shows that the bias increases with the threshold from 0.8–1.0 (1 mm day−1threshold, depending on the type of simulation) to 2.3–2.6 (60 mm day−1 threshold), show-ing a considerable overestimation of the forecast area for the larger thresholds (>40 mm day−1). The lightning data
assimilation improves the bias up to 10 mm day−1 (both F3HA6 and ASSIM), while performance is worsened by data assimilation for larger thresholds. As expected, the ASSIM shows the largest bias, followed by F3HA6 and CNTRL. This is caused by the addition of water vapour by the data assimilation, which is larger for ASSIM (assimilation per-formed continuously) compared to F3HA6 (assimilation is not performed in the forecast phase). The statistical test to as-sess the bias difference between CNTRL and F3HA6 shows that the two scores are different at 95 % significance level for all thresholds, showing the significant impact of the lightning data assimilation on the precipitation forecast.
The overestimation of the precipitation area for higher thresholds is evident, as discussed in the previous section, in Fig. 5a and b over the Apennines for the 90 mm day−1
threshold (the ASSIM simulation, not shown, does not dif-fer substantially from F3HA6). Comparing the result of the bias with the same result of Federico (2016), where the same configuration of the RAMS model of CNTRL was used, we note a considerable increase of the bias in this work. This dif-ference is caused by the fact that Federico (2016) considered 50 consecutive days of the HyMeX SOP1, i.e. with heavy, moderate, and small precipitation, while this study considers only cases with deep and widespread convection. The RAMS with WSM6 scheme shows the tendency to overestimate the bias for increasing precipitation (Federico, 2016; see also Liu et al., 2011, for a general comparison of the WSM6 micro-physical scheme and other micromicro-physical schemes available in the WRF model), and this tendency is amplified for the heavy precipitation events considered in this work.
Figure 7. (a)Difference between the hits of the contingency tables
of F3HA6 and CNTRL for the 1 mm/3 h (8 mm day−1) forecast;
(b)as in(a)for the 10 mm/3 h (80 mm day−1) threshold.
the ETS for F3HA6 and CNTRL is statistically significant at 95 % level for thresholds up to 20 mm day−1and not signifi-cant for larger precipitation. The ASSIM simulations show a further increase of the ETS compared to F3HA6 because of their ability to better represent convection during the simula-tion through lightning data assimilasimula-tion.
The POD (Fig. 8c) for CNTRL decreases from 0.70 (1 mm day−1) to 0.52 (60 mm day−1); i.e. half of the po-tentially dangerous events are correctly predicted. It is also noted the rather stable value of the POD (0.6) between the 10 and 40 mm day−1thresholds. The POD increases for F3HA6. The lowest increment is attained for 60 mm day−1 (0.04, i.e. 4 % more potentially dangerous events are cor-rectly forecast compared to CNTRL), the largest for the 1 mm day−1(6.5 %). Differences between the POD of CN-TRL and F3HA6 are significant at 95 % level for all thresh-olds showing the robust improvement of the performance for this score using lightning data assimilation. Notably, the
AS-SIM run increases the POD of 8–10 %, depending on the threshold.
The FAR for CNTRL (Fig. 8d) increases from less than 0.2 (1 mm day−1 threshold; i.e. less than 20 % of the forecasts are false alarms) to 0.8 (60 mm day−1 threshold; i.e. 80 % of the forecasts are false alarms). The lightning assimilation improves the performance for the FAR but differences are statistically significant for 1 mm day−1 (90 % level), 5 and 10 mm day−1 (95 % level). The inspection of the contin-gency tables shows that the improvement of the FAR for those thresholds is attained by a larger number of hits but there is also an increase of the false alarms. In general, the lighting assimilation increases the precipitation, which is already overestimated for the larger thresholds by CN-TRL. So, the POD and the hit rate are increased by light-ning data assimilation but also the false alarms, which were already reported in CNTRL, especially for the larger thresh-olds (>30 mm day−1). In any case, we believe that the result is overall helpful for operational purposes.
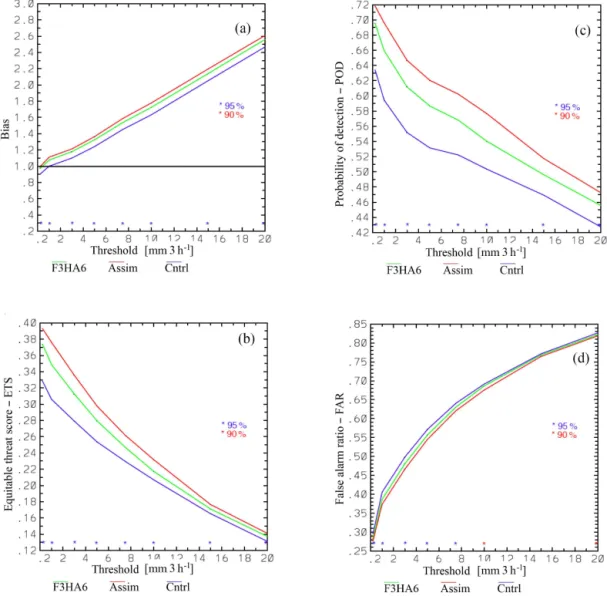
Figure 9a shows the bias for the 3 h precipitation forecast. The bias for CNTRL increases from about 1 (0.2 mm/3 h threshold) to 2.5 (20 mm/3 h threshold). The bias differences between CNTRL and F3HA6 are significant at 95 % level for all thresholds.
The ETS score (Fig. 9b) for CNTRL shows a decrease from 0.33 (0.2 mm/3 h threshold) to 0.13 (20 mm/3 h thresh-old). The ETS is larger for F3HA6 compared to CNTRL and the differences of the scores are significant at 95 % level for all thresholds. It is also noted that, while the ETS is posi-tive for all thresholds, the ETS value is rather low for the 20 mm/3 h threshold, limiting the usefulness of the forecast.
Figure 9c shows the POD for the 3 h forecast. The value for CNTRL decreases from 0.63 (0.2 mm/3 h) to 0.43 (20 mm/3 h). The POD increases for F3HA6, notably for thresholds up to 7.5 mm/3 h (>5 %), while the improvement is smaller (3–4 %) for larger thresholds.
Figure 9d shows the FAR for the 3 h forecast. The FAR increases from 0.3 to 0.83 for the CNTRL forecast. The FAR for F3HA6 decreases (1–3 % depending on the threshold) and the improvement is the result of the increase of the hits but it is also associated with an increase of the false alarms.
4 Discussion and conclusions
Figure 8.Scores for the daily precipitation computed by summing the contingency tables of all 20 case studies:(a)bias (the line of the perfect score 1.0 is shown in black);(b)equitable threat score;(c)probability of detection;(d)false alarm ratio. F3HA6 is in green, ASSIM is in red, and CNTRL in blue. The asterisks above thexaxis show the results of the hypothesis testing (95 % blue, 90 % red) of the difference between F3HA6 and CNTRL scores.
of the assimilation–forecast procedure that can be adopted in operational weather forecast.
The results of this paper show that the methodology is ef-fective at improving the short-term (3 h) precipitation fore-cast. More in detail, the analysis of 27 October shows that the total lightning data assimilation is able to trigger convection over the sea and, when convection is advected over the land, it improves the short-term precipitation forecast. This effect is apparent over Sardinia for the case study. The humid ma-rine air masses interact with the local orography, causing or reinforcing convection. Also, the lightning data assimilation improves the rainfall forecast adding precipitation where it is observed and increasing the hits of the short-term forecast.
The advection of convection from the sea to the land was important in most case studies considered in this paper, and
Figure 9.Scores for the 3 h precipitation computed by summing the 160 contingency tables of the 20 case studies:(a)bias (the line of the perfect score 1.0 is shown in black);(b)equitable threat score;(c)probability of detection;(d)false alarm ratio. F3HA6 is in green, ASSIM is in red, and CNTRL in blue. The asterisks above thexaxis show the results of the hypothesis testing (95 % blue, 90 % red) of the difference between F3HA6 and CNTRL scores.
scores of the competing forecasts is significant at 95 % level for all thresholds. The FAR is also improved and the differ-ence between the scores of F3HA6 and CNTRL is statisti-cally significant for all thresholds with the exception of the 15 mm/3 h. The FAR improvement of F3HA6 is caused by the increase of the hits, but it is also associated with a larger number of false alarms.
The bias is the only score that worsens with lightning data assimilation. The bias of the RAMS model with the WSM6 microphysics scheme is larger than one for most thresholds for the case studies of this paper. Because the lightning data assimilation adds water vapour to the model, the tendency to overestimate the precipitation area, especially for the larger thresholds, is worsened by the lightning data assimilation.
In addition to the 3 h forecast, the scores and precipitation field are analysed for the daily precipitation for completeness
and for comparison with other studies. Recently, Giannaros et al. (2016) presented the WRF-LTNGDA, a lightning data assimilation technique implemented in WRF. They presented the results for eight cases in Greece. Their assimilation strat-egy focuses on the daily rainfall prediction (tomorrow daily precipitation). Their analysis (see their Fig. 3; note also that the maximum precipitation threshold is 20 mm day−1in their study) shows that the POD increases when lightning data as-similation is compared to CNTRL, and the increase of the POD is up to 5 %. Moreover, for some thresholds, the light-ning assimilation lowers the POD because of the different patterns followed by the storms in the simulations with or without lightning data assimilation.
reported in Giannaros et al. (2016) for the lower thresholds (below 10 mm day−1). Even if we cannot give a definitive an-swer to this issue, because of the many important differences between this study and that of Giannaros et al. (2016), the lightning data assimilation technique has a role. In our case, lightning data are assimilated also for the actual day (6 h as-similation before the forecast start time followed by 3 h fore-cast, Fig. 2), while in Giannaros et al. (2016) the assimilation is done only for the day before the actual day (6 h assimila-tion followed by 24 h forecast). So, our technique should im-prove the correct location of convection during the actual day compared to their approach, as shown by the improvement, i.e. the difference between the POD of the simulations with or without lightning data assimilation.
However, other differences play a role: first the two studies refer to different regions and to different events. In our case the extension of the region, the number of the events, and the number of verifying stations are larger. Moreover, two different model suites are used (WRF and RAMS). These differences are clearly seen in the score values. The POD of Giannaros et al. (2016) is larger than that of this study, espe-cially for thresholds lower than 20 mm day−1. Another im-portant difference arises from the different convective nature of the storms considered in the two works. The performance of the precipitation forecast is clearly dependent on the type of event, i.e. widespread or localized convection (Giannaros et al., 2016), and, because the events considered in the two studies are different, the comparison can be only qualitative. Nevertheless, both studies show that the lightning data as-similation improves the precipitation forecast robustly and can be used in the operational context.
While the results of this study are encouraging, there are a number of issues that need further investigation. The wa-ter vapour is added to the grid column where the lightning is observed. However, the lightning is often the result of a pro-cess involving larger scales than the horizontal grid spacing considered in this paper (4 km). A spatial extension of the influence of the lightning perturbation on the water vapour field should be explored. For this approach the applications of the methods involving the model error matrix are fore-seeable and will be investigated in future studies. The prob-lem of the spatial extension of the water vapour perturbation caused by lightning to the model was considered in Fierro et al. (2013) by remapping the flashes onto a coarser horizontal resolution grid (9 km), while no similar approach is done in this study.
A problem arising with the RAMS model using the WSM6 microphysics scheme is the overestimation of the precipita-tion area for large rainfall thresholds. This tendency was al-ready noted in Federico (2016), and it is amplified for the cases of widespread convection considered in this study. The high number of false alarms decreases the ETS score for high precipitation, reducing the applicability of the method for the largest thresholds (>100 mm day−1). The application of dif-ferent microphysical schemes could mitigate this issue.
Finally, horizontal resolutions higher than those of this pa-per are needed to better resolve the orography and its inter-action with air masses. To quantify this point preliminary, we increased the horizontal resolution of the second domain from 4 to 2.5 km for the 15 October and 27 October case studies. Results for the two cases show that the impact of the resolution is notable because the precipitation patterns, espe-cially for larger thresholds (>50 mm day−1), are less spread in the 2.5 km horizontal resolution experiment compared to 4 km forecast (see the discussion of this paper for the daily precipitation maps for the two cases; Federico et al., 2016). This impact could be beneficial for the scores of the F3HA6 forecast because it has the tendency to overestimate the pre-cipitation area at high thresholds, as shown in this paper. However, these results are preliminary, and future studies are needed to quantify the important impact of the horizontal res-olution on the lightning data assimilation forecast.
5 Data availability
Appendix A: The resampling method
We use the resampling method introduced by Hamill (1999) for the comparison of the scores of CNTRL and F3HA6 forecasts (see also Accadia et al., 2003, and Federico et al., 2003).
The null hypothesis is that the difference of the scores of the two competing models, CNTRL and F3HA6, is zero:
H0: S1−S2=0, (A1)
whereSis the generic score (bias, ETS, POD, and FAR), 1 is the CNTRL forecast, and 2 is the F3HA6 forecast. The scores are computed from the sum of the contingency tables of the CNTRL and F3HA6 forecasts to minimize the sensitivity of the test to small changes of the contingency table elements.
In this paper the number of contingency tables available is 8 multiplied the number of days, i.e.n=20×8=160 for the 3 h precipitation forecast, and n=20 for the daily pre-cipitation forecast. Indicating the contingency tables by the vectorx:
xi,j =(a, b, c, d)i,j, (A2)
whereiis the competing model (i=1 for CNTRL,i=2 for
F3HA6) andjis the contingency table (j=1, . . . , 160 for 3 h
forecast andj=1, . . . , 20 for daily precipitation), the scores
are computed from the sum of the contingency tables:
Si =f n X
j=1 xi,j
!
, (A3)
and the test statistic is given by the difference between S1
andS2.
The bootstrap method is applied by resampling the contin-gency tables in a consistent way. For this purpose, a random numberIj is generated, which can assume the values 1 or 2. IfIj is 1 then the contingency table of CNTRL is selected; ifIj is 2 then the F3HA6 table is selected. The process is repeated for each contingency table (j=1, . . . , 160 for 3 h forecast andj=1, . . . , 20 for daily precipitation) and the scoresS∗
1andS ∗
2 are computed:
S1∗=f n X
j=1 xIj,j
! ,
S2∗=f n X
j=1 x3−Ij,j
!
. (A4)
So, the two jth contingency tables are swapped ifIj=2, while the swapping is not performed forIj=1.
This random sampling is performed a large number of times (10 000 in this paper). Each time the scores are com-puted from the sum of the elements of the resampled con-tingency tables, Eq. (A4), to make the null distribution (S∗
1−S ∗
2) of the difference between the scores of the
com-peting forecasts.
Then we compute the tL and tU that represent the α/2 and (1−α)/2 percentile of the null distribution (S∗
1−S ∗ 2).
The null hypothesis that the score difference between the two competing forecasts is zero is rejected at the level 90 % (α=0.1) or 95 % (α=0.05) if
(S1−S2) < tLor (S1−S2) > tU, (A5) whereS1andS2are the generic scores of the actual
Acknowledgement. This work is a contribution to the HyMeX program. The author acknowledges Meteo-France and the HyMeX program for supplying the data, sponsored by Grants
MISTRALS/HyMeX and ANR-11-BS56-0005 IODA-MED
project. The ECMWF and Aeronautica Militare – CNMCA are acknowledged for the access to the MARS database. LINET data were provided by Nowcast GmbH (https://www.nowcast.de/) within a scientific agreement between H.-D. Betz and the Satellite Meteorological Group of CNR-ISAC in Rome. Two anonymous reviewers and the Editor are acknowledged for their constructive and helpful comments.
Edited by: R. Trigo
Reviewed by: two anonymous referees
References
Accadia, C., Mariani, S., Casaioli, M., and Lavagnini, A.: Sensi-tivity of precipitation forecast skill scores to bilinear interpo-lation and a simple nearest-neighbor average method on high-resolution verification grids, Weather Forecast., 18, 918–932, 2003.
Alexander, G. D., Weinman, J. A., Karyampoudi, V. M., Olson, W. S., and Lee, A. C. L.: The effect of assimilating rain rates derived from satellites and lightning on forecasts of the 1993 superstorm, Mon. Weather Rev., 127, 1433–1457, 1999.
Betz, H. D., Schmidt, K., Laroche, P., Blanchet, P., Oettinger, W. P., Defer, E., Dziewit, Z., and Konarski, J.: LINET – An inter-national lightning detection network in Europe, Atmos. Res., 91, 564–573, 2009.
Casaioli, M., Coraci, E., Mariani, S., Ferrario, M. E., Sansone, M., Davolio, S., Cordella, M., Manzato, A., Pucillo, A., and Bajo, M.: The impact of different NWP forecasting systems on ac-qua alta forecasts: two IOP case studies over the NEI target site, 7th HyMeX Workshop, 7–10 October 2013, Cassis, France, 2013.
Chang, D. E., Weinman, J. A., Morales, C. A., and Olson, W. S.: The effect of spaceborn microwave and ground-based continuous lightning measurements on forecasts of the 1998 Groundhog Day storm, Mon. Weather Rev., 129, 1809–1833, 2001.
Chen, C. and Cotton, W. R.: A One-Dimensional Simulation of the Stratocumulus-Capped Mixed Layer, Bound.-Lay. Meteorol., 25, 289–321, 1983.
Cotton, W. R., Pielke Sr., R. A., Walko, R. L., Liston, G. E., Tremback, C. J., Jiang, H., McAnelly, R. L., Harrington, J. Y., Nicholls, M. E., Carrio, C. G., and McFadden, J. P.: RAMS 2001: Current status and future directions, Meteorol. Atmos. Phys., 82, 5–29, 2003.
Davolio, S., Ferretti, R., Baldini, L., Casaioli, M., Cimini, D., Fer-rario, M. E., Gentile, S., Loglisci, N., Maiello, I., Manzato, A., Mariani, S., Marsigli, C., Marzano, F. S., Miglietta, M. M., Mon-tani, A., Panegrossi, G., Pasi, F., Pichelli, E., Pucillo, A., and Zinzi, A.: The role of the Italian scientific community in the first HyMeX SOP: an outstanding multidisciplinary experience, Me-teorol. Z., 24, 261–267, 2015.
Drobinski, P., Ducrocq, V., Alpert, P., Anagnostou, E., Béranger, K., Borga, M., Braud, I., Chanzy, A., Davolio, S., Delrieu, G., Es-tournel, C., Filali Boubrahmi, N., Font, J., Grubisic, V., Gualdi,
S., Homar, V., Ivancan-Picek, B., Kottmeier, C., Kotroni, V., Lagouvardos, K., Lionello, P., Llasat, M. C., Ludwig, W., Lutoff, C., Mariotti, A., Richard, E., Romero, R., Rotunno, R., Roussot, O., Ruin, I., Somot, S., Taupier-Letage, I., Tintore, J., Uijlenhoet, R., and Wernli, H.: HyMeX, a 10-year multidisciplinary program on the Mediterranean water cycle, B. Am. Meteorol. Soc., 95, 1063–1082, doi:10.1175/BAMS-D-12-00242.1, 2014.
Ducrocq, V., Braud, I., Davolio, S., Ferretti, R., Flamant, C., Jansa, A., Kalthoff, N., Richard, E., Taupier-Letage, I., Ayral, P. A., Belamari, S., Berne, A., Borga, M., Boudevillain, B., Bock, O., Boichard, J.-L., Bouin, M.-N., Bousquet, O., Bouvier, C., Chig-giato, J., Cimini, D., Corsmeier, U., Coppola, L., Cocquerez, P., Defer, E., Drobinski, P., Dufournet, Y., Fourrié, N., Gourley, J. J., Labatut, L., Lambert, D., Le Coz, J., Marzano, F. S., Molinié, G., Montani, A., Nord, G., Nuret, M., Ramage, K., Rison, B., Rous-sot, O., Said, F., Schwarzenboeck, A., Testor, P., Van Baelen, J., Vincendon, B., Aran, M., and Tamayo, J.: HyMeX-SOP1, the field campaign dedicated to heavy precipitation and flash flood-ing in the northwestern Mediterranean, B. Am. Meteorol. Soc., 95, 1083–1100, doi:10.1175/BAMS-D-12-00244.1, 2014. Federico, S.: Implementation of the WSM5 and WSM6 single
moment microphysics scheme into the RAMS model: verifi-cation for the HyMeX-SOP1, Adv. Meteorol., 2016, 5094126, doi:10.1155/2016/5094126, 2016.
Federico, S., Avolio, E., Bellecci, C., and Colacino, M.: On the performance of a limited area model for quantitative precipita-tion forecast over Calabria, Il Nuovo Cimento C, 26C, 663–676, 2003.
Federico, S., Avolio, E., Petracca, M., Panegrossi, G., Sanò, P., Casella, D., and Dietrich, S.: Simulating lightning into the RAMS model: implementation and preliminary results, Nat. Hazards Earth Syst. Sci., 14, 2933-2950, doi:10.5194/nhess-14-2933-2014, 2014.
Federico, S., Petracca, M., Panegrossi, G., and Dietrich, S.: Im-provement of RAMS precipitation forecast at the short range through lightning data assimilation, Nat. Hazards Earth Syst. Sci. Discuss., doi:10.5194/nhess-2016-291, in review, 2016. Ferretti, R., Pichelli, E., Gentile, S., Maiello, I., Cimini, D.,
Davo-lio, S., Miglietta, M. M., Panegrossi, G., Baldini, L., Pasi, F., Marzano, F. S., Zinzi, A., Mariani, S., Casaioli, M., Bartolini, G., Loglisci, N., Montani, A., Marsigli, C., Manzato, A., Pucillo, A., Ferrario, M. E., Colaiuda, V., and Rotunno, R.: Overview of the first HyMeX Special Observation Period over Italy: observa-tions and model results, Hydrol. Earth Syst. Sci., 18, 1953–1977, doi:10.5194/hess-18-1953-2014, 2014.
Fierro, A. O., Gao, J., Ziegler, C. L., Mansell, E. R., Macgorman, D. R., and Dembek, S. R.: Evaluation of a cloud scale lightning data assimilation technique and a 3DVAR method for the analysis and short-term forecast of the 29 June 2012 derecho event, Mon. Weather Rev., 142, 183–202, doi:10.1175/MWR-D-13-00142.1, 2013.
Giannaros, T. M., Kotroni, V., and Lagouvardos, K.: WRF-LTNGDA: A lightning data assimilation technique
im-plemented in the WRF model for improving
precip-itation forecasts, Environ. Model. Softw., 76, 54–68,
doi:10.1016/j.envsoft.2015.11.017, 2016.
Hamill, T. M.: Hypothesis tests for evaluating numerical precipita-tion forecasts, Weather Forecast., 14, 155–167, 1999.
Hodur, R. M.: The naval research Laboratory’s coupled
Ocean/Atmosphere mesoscale prediction system (COAMPS), Mon. Weather. Rev., 125, 1414–1430, 1997.
Hong, S. Y. and Lim, J. J. O.: The WRF single-moment 6-class mi-crophysics scheme (WSM6), J. Korean Meteorol. Soc., 42, 129– 151, 2006.
Jansa, A., Alpert, P., Arbogast, P., Buzzi, A., Ivancan-Picek, B., Kotroni, V., Llasat, M. C., Ramis, C., Richard, E., Romero, R., and Speranza, A.: MEDEX: a general overview, Nat. Hazards Earth Syst. Sci., 14, 1965–1984, doi:10.5194/nhess-14-1965-2014, 2014.
Jones, C. D. and Macpherson, B.: A latent heat nudging scheme for the assimilation of precipitation into an operational mesoscale model, Meteorol. Appl., 4, 269–277, 1997.
Kain, J. S. and Fritsch, J. M.: Convective parameterization for mesoscale models: the Kain-Fritsch scheme. The representation of cumulus convection in numerical models, Meteor. Monogr. No. 46, Am. Meteor. Soc., Boston, 165–170, 1993.
Kuo, H. L.: Further Studies of the Parameterization of the Influence of Cumulus Convection on Large-Scale Flow, J. Atmos. Sci., 31, 1232–1240, 1974.
Lagouvardos, K., Kotroni, V., Betz, H.-D., and Schmidt, K.: A com-parison of lightning data provided by ZEUS and LINET net-works over Western Europe, Nat. Hazards Earth Syst. Sci., 9, 1713–1717, doi:10.5194/nhess-9-1713-2009, 2009.
Liu, C., Ikeda, K., Thompson, G., Rasmussen, R., and Dud-hia, J.: High-Resolution Simulations of Wintertime Precip-itation in the Colorado Headwaters Region: Sensitivity to Physics Parameterizations, Mon. Weather Rev., 139, 3533–3553, doi:10.1175/MWR-D-11-00009.1, 2011.
MacGorman, D. R. and Rust, W. D.: The electrical nature of storms, Oxford University Press, USA, 1998.
Mansell, E. R., Ziegler, C. L., and MacGorman, D. R.: A lightning data assimilation technique for mesoscale forecast models, Mon. Weather Rev., 135, 1732–1748, 2007.
Manzato, A., Davolio, S., Miglietta, M. M., Pucillo, A., and Setvák, M.: 12 September 2012: A supercell outbreak in NE Italy?, At-mos. Res., 153, 98–118, 2014.
Mariani, S., Casaioli, M., Coraci, E., and Malguzzi, P.: A new high-resolution BOLAM-MOLOCH suite for the SIMM forecasting system: assessment over two HyMeX intense observation peri-ods, Nat. Hazards Earth Syst. Sci., 15, 1–24, doi:10.5194/nhess-15-1-2015, 2015.
Molinari, J. and Corsetti, T.: Incorporation of cloud-scale and mesoscale down-drafts into a cumulus parametrization: results of one and three-dimensional integration, Mon. Weather Rev., 113, 485–501, 1985.
Papadopoulos, A., Chronis, T. G., and Anagnostou, E. N.: Improv-ing convective precipitation forecastImprov-ing through assimilation of regional lightning measurements in a mesoscale model, Mon. Weather Rev., 133, 1961–1977, 2005.
Pielke, R. A.: Mesoscale Meteorological Modeling, Academic Press, San Diego, 676 pp., 2002.
Qie, X., Zhu, R., Yuan, T., Wu, X., Li, W., and Liu, D.: Application of total-lightning data assimilation in a mesoscale convective sys-tem based on the WRF model, Atmos. Res., 145–146, 255–266, 2014.
Smagorinsky, J.: General circulation experiments with the primitive equations. Part I, The basic experiment, Mon. Weather Rev., 91, 99–164, 1963.
Stensrud, D. J. and Fritsch, J. M.: Mesoscale convective systems in weakly forced large-scale environments. Part II: Generation of a mesoscale initial condition, Mon. Weather Rev., 122, 2068– 2083, 1994.
Walko, R. L., Band, L. E., Baron, J., Kittel, T. G., Lammers, R., Lee, T. J., Ojima, D., Pielke Sr., R. A., Taylor, C., Tague, C., Trem-back, C. J., and Vidale, P. L.: Coupled Atmosphere-Biosphere-Hydrology Models for environmental prediction, J. Appl. Mete-orol., 39, 931–944, 2000.