Simultaneous Determination of Four Anthraquinones in
Polygoni Multiflori Radix with Single Reference Standard
by High Performance Liquid Chromatography
Hua Yang1, Jun-Fang Jia1, Rui Wang, Fang Long, Ping Li*, and Hui-Jun Li*
State Key Laboratory of Natural Medicines, China Pharmaceutical University, No. 24 Tongjia Lane, Nanjing 210009, China 1
These authors contributed equally to this work.
*Correspondence: Ping Li, State Key Laboratory of Natural Medicines, China Pharmaceutical University, No. 24 Tongjia Lane, Nanjing 210009, China, Tel.: +86 25 83271379, fax: +86 25 83271379,E-mail: [email protected];Co-correspondence: Hui-Jun Li,State Key Laboratory of Natural Medicines, China Pharmaceutical University, No. 24 Tongjia Lane, Nanjing 210009, China, E-mail: [email protected].
ABSTRACT
Objective:To establish a rapid, accurate and reliable analytical method for the simultaneous determination of four major anthraquinones in Polygoni Multiflori Radix (PMR) using single reference standard.
Methods:The four components including emodin-8-O-β-D- (EMG), physcion-8-O-β-D-glucoside, emodin and physcion were separated on an ODS C18 column within 13 min and detected at 280 nm. Emodin was selected as the reference standard, and the response factor for each analyte with respect to emodin were calculated. Robustness were also tested including different columns, equipments, temperatures, detection wavelengths, and other chromatographic conditions which might influence stability of response factors.
Results:The method was validated in terms of linearity (r2> 0.9995), LOQs (0.820–3.05 ng/mL), LODs (0.180–0.920 ng/mL), precision, accuracy (95.8–103.6%, RSD < 2.80%) and stability. A total of 40 batches of PMR were analyzed and the results were found to have no statistically significant differences compared with those obtained using the external standard method.
Conclusion:This work provided a single standard to determine multi-components method for quantitation of four anthraquinones in PMR, which could be applied in the quality control of this herbal drug.
Key Words:Polygoni Multiflori Radix, Single standard to determine multi-components method, Anthraquinone, Emodin
INTRODUCTION
Polygoni Multiflori Radix (PMR), with the common name He-Shou-Wu in Chinese, is the dried tuberous root of
Polygonum multiflorum Thunb[1]. It is one of the most popular herbal medicines in oriental countries for centuries due to its beneficial effects, such as tonifying the blood, strengthening the bones, blackening the hair and the treat-ment of hyperlipidemia[2–4]. In clinic, it is generally used as an anti-aging agent in many herbal preparations. Recently, pharmacological effects of PMR have been well investigated. Lin et al. reported that PMR could reduce the contents of very low density lipoprotein and increased the expression of hepatic lipase[5]. Guanet al.demonstrated that the bioactive compounds in PMR would activate tyrosinase and promote melanin biosynthesis[6].
With the growing interests in the use of natural products, quality control for PMR becomes increasingly important. Modern phytochemical investigations revealed that PMR mainly contains stilbene glycosides, anthraquinones, phos-phatides, flavones and tannins[7]. Free anthraquinones and their glycosides were reported as the important active constituents and often used as chemical markers in the quality control of PMR[8–9]. Free anthraquinones were determined by the direct assay in the national pharmaco-poeia, while the content of their glycosides were often
calculated by subtracting the amount of free anthraquinones from total anthraquinones[1]. Therefore, a simple, rapid and direct analysis of anthraquinone glycosides is necessary for both dietary and pharmaceutical purposes.
Single standard to determine multi-components (SSDMC) method has proven to be an economic tool for simultaneous determination of multi-components, which only required the limited number of reference standards with low cost[10–12]. In this work, using emodin as the reference standard, a SSDMC method was established after full validation, four anthraquinones includ-ing two free anthraquinones and their glycosides were simulta-neously determined. The quantification results from 40 bathces of PMR samples determined with SSDMC method and external standard method were comparable, demonstrating its potent application in the quality control of PMR.
MATERIAL AND METHOD
1. Chemical and reagents
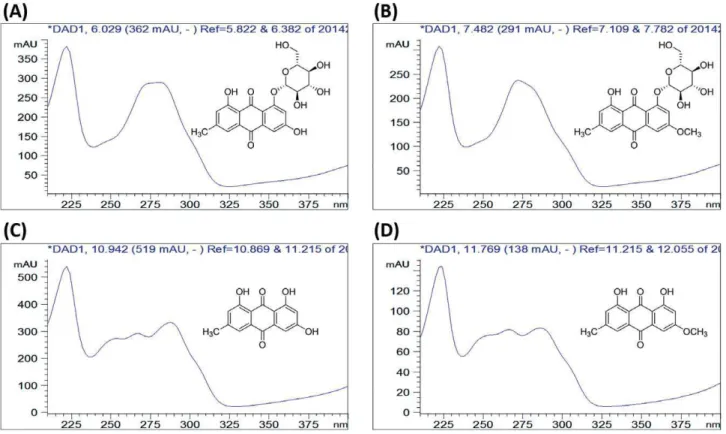
Emodin-8-O-β-D-glucoside (EMG), physcion-8-O -β-D-gluco-side (PHG), emodin (EM), and physcion (PH) were purchased from Must Biological Technology Co. Ltd (Chengdu, China). The purity of each compound was determined to be higher than 98% by HPLC. Their structures were shown in Figure 1. HPLC grade of acetonitrile and formic acid with a purity of 98% were purchased from ROE Scientific Inc (Newark, New Castle, USA). DOI: 10.15806/j.issn.2311-8571.2015.0021 World J Tradit Chin Med 2015; 1(3): 21–26
Fourty batches of PMR samples were collected from different provinces in China, as shown in Table S1. All the samples were authenticated by Professor Huijun Li (China Pharmaceutical University). The voucher specimens were deposited in State Key Laboratory of Natural Medicines, China Pharmaceutical University, Nanjing, China.
2. Apparatus and chromatographic conditions
Chromatographic analysis was performed on Agilent 1290 HPLC System equipped with a quaternary pump, an online degasser, an auto-plate sampler, and a thermostatically controlled column compartment (Agilent Technologies, Santa Clara, CA, USA). Data analysis was performed using Agilent ChemStation (with LC 3D systems, version B 02.01) (Agilent Technologies, Santa Clara, CA, USA). Two other HPLC system were tested including Shimadzu LC-20A (with a quaternary pump and VWD) and Waters HPLC-PDA 2695-298 systems.
Chromatographic seperation was carried out at 30oC on a
Shimadzu ODS C18 column (4.6 mm×150 mm, 5μm). The
mobile phase was a mixture of water containing 0.1% formic acid (A) and acetonitrile (B). The gradient profile was optimized as follows: 0–3 min, 30% B; 3–8 min, 30%–50% B; 8–10 min, 50%–100% B; 10–13 min, 100% B; 13–14 min, 100%–30% B; 14–19 min, 30% B. The flow rate of mobile phase was set at 1.0 mL/min. The sample injection volume was 10μL. The DAD detector was operated at 280 nm.
3. Standard solutions and sample preparation
Accurately weight EM, PH, EMG, PHG in methanol to prepare the stock solution of mixture reference substances,
for the concentration is 0.048 mg/mL, 0.041 mg/mL, 0.079 mg/mL, 0.053 mg/mL respectively and stored at 4 oC until use. A standard working solution of the mixtures was obtained by diluting stock solutions to desired concentrations (dilution factors = 2, 4, 5, 10, 20, 50).
Transfer about 0.2 g of PMR, finely powdered and accurately weighed. Add accurately 15 mL of methanol, and weigh the filled flask with a precision of ±0.1 mg and then extracted by heating reflux for 60 min. Allow cooling, the resultant mixture was made up to the original weight with methanol. The supernatant was filtered through a 0.22 μm syringe filter and the successive filtrate was collected as the sample solution.
4. Calculation of response factors and relative
retention time
The response factor of analyte X (RFx) was obtained at 6 levels of standard solutions under the same detection conditions and calculated by equation as follows:
RFx¼Fx=Fs
In which,FxandFswere calculated by equation as follows:
Fx¼rx=Cx
Fs¼rs=Cs
Thersandrxare the peak areas of the reference standard EM and target compound X obtained by chromatographic analyses, respectively. TheCsand Cxis the concentration of
EM and X, in μg/mL, respectively. Triplicate experiments were performed. The relative retention time of X was calculated as follows:
RRTx¼RTx=RTs
Where RTx is the retention time of X, RTsis the retention time of EM.
5. Validation of the SSDMC method
The SSDMC method used for the quantitation of anthraqui-nones in Polygoni Multiflori Radix was validated for linearity, limit of quantification (LOQ), limit of detection (LOD), precision, accuracy, stability and robustness. Meanwhile, the SSDMC method was also compared with the conventional external standard method.
RESULTS AND DISCUSSION
1. Calculation of response factors and relative
retention time
In this study, EM was selected as reference standard to determine three other analytes. The RFs of EMG, PHG and PH were 0.72, 0.87 and 0.94, respectively (Table S2). The RSD was less than 3%, showing that the RFs were stable at different levels of standard solutions. The RRTs of PHG, EMG, PH were 1.08, 0.55 and 0.68, respectively.
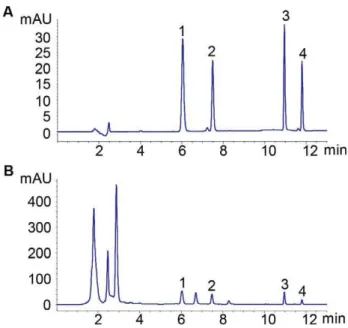
Figure 2.HPLC chromatograms of (A) four mixed reference standards and (B) PMR sample solution. 1-4: EMG, PHG, EM and PH.
Table 1. Ruggedness test of response factor and relative retention time on different columns.
Response factor Relative retention time
EMG PHG PH EMG PHG PH
Column 1 1.15 1.18 1.03 0.55 0.68 1.08
Column 2 1.16 1.17 1.04 0.56 0.67 1.09
Column 3 1.17 1.18 1.04 0.49 0.62 1.08
Column 4 1.15 1.17 1.03 0.61 0.71 1.09
Column 5 1.16 1.19 1.05 0.65 0.74 1.12
Mean 1.16 1.18 1.04 0.57 0.68 1.25
RSD (%) 0.72 0.71 0.81 10.60 6.56 1.38
EMG: emodin-8-O-β-D-glucoside, PHG: physcion-8-O-β-D-glucoside, PH: physcion. Column 1: Shimadzu Inertsil ODS-SP C18 (4.6 × 150 mm, 5μm), Column 2:
Shimadzu Inersustain C18 (4.6 × 150 mm, 5μm), Column 3: Agilent Zorbax Stable
Bond C18 (4.6 × 150 mm, 5μm), Column 4: Agilent Zorbax Stable Bond C18 (4.6
× 250 mm, 5μm); Column 5: Thermo Syncronis C18 (4.6 × 250 mm, 5μm).
Table 2. Ruggedness test of response factor and relative retention time on different equipments.
Response factor Relative retention time
EMG PHG PH EMG PHG PH
Agilent 1.17 1.18 1.05 0.57 0.69 1.09
Shimadzu 1.15 1.17 1.03 0.48 0.69 1.09
Waters 1.15 1.16 1.04 0.55 0.68 1.09
Mean 1.15 1.16 1.04 0.53 0.69 1.09
RSD (%) 0.95 0.71 0.80 8.55 0.26 0.13
EMG: emodin-8-O-β-D-glucoside, PHG: physcion-8-O-β-D-glucoside, PH: physcion.
Table 3. Recovery test of emodin (EM), physcion (PH), emodin-8-O-β -D-glucoside (EMG) and physcion-8-O-β-D-glucoside (PHG).
Analyte Level
Original (mg)
Spiked (mg)
Found (mg)
Recovery (%)
Average (%)
RSD (%)
EMG Low 0.037 0.019 0.056 96.4 98.4 1.82
0.037 0.019 0.056 99.0 0.037 0.019 0.056 99.9
Medium 0.039 0.039 0.077 100.0 100.8 2.22 0.039 0.039 0.077 99.6
0.039 0.039 0.076 95.8
High 0.039 0.058 0.099 101.9 101.9 2.80
0.040 0.058 0.097 98.2 0.039 0.058 0.099 101.9
PHG Low 0.022 0.006 0.016 102.8 102.8 2.08
0.022 0.006 0.016 100.7 0.023 0.006 0.016 104.9
Medium 0.014 0.016 0.030 96.8 95.8 0.99 0.014 0.016 0.030 95.0
0.014 0.016 0.030 95.4
High 0.014 0.033 0.047 100.0 99.6 0.82
0.014 0.033 0.047 100.1 0.014 0.033 0.047 98.7
EM Low 0.071 0.032 0.104 105.0 103.6 2.24
0.071 0.032 0.104 104.8 0.071 0.032 0.103 100.9
Medium 0.075 0.063 0.139 102.1 100.8 1.53 0.075 0.063 0.139 101.0
0.075 0.063 0.138 99.1
High 0.076 0.095 0.175 104.1 102.4 2.08
0.077 0.095 0.171 100.0 0.076 0.095 0.174 103.2
PH Low 0.042 0.021 0.063 100.8 100.6 0.39
0.042 0.021 0.063 100.9 0.042 0.021 0.063 100.2
Medium 0.044 0.043 0.089 105.2 102.6 2.22 0.044 0.043 0.088 101.8
0.044 0.043 0.087 100.8
High 0.045 0.064 0.111 103.7 101.9 2.80
0.045 0.064 0.108 98.6 0.044 0.064 0.111 103.4
2. Method validation
2.1 Specificity
The specificity was tested by comparing the consistency of the retention time between every analytes in PMR sample and the corresponding reference standards. Figure 2 showed that the four peaks in the chromatogram of PMR could all be located by the position of reference standards. Obviously, no apparent peak overlap was observed and a good resolution was achieved.
2.2 Linearity, LOQs, and LODs
Six level of mixed standard solution samples were analysed separately. The calibration curve was constructed by plotting the peak area of each compound against the concentration of each compound. All the four calibration curves showed good
linearity with correlation coefficients (r2) no less than 0.9995, as shown in Table S3. The limits of detections (LODs) and quantifications (LOQs) under the chromatographic condi-tions fall in the range of 0.180–0.920 ng/mL, and 0.820–3.05 ng/mL, respectively.
2.3 Precision
The mixed standard solutions containing three different concentrations (low, medium and high) were analyzed for calculating RSD. To test the precision, the mixed solution was examined in duplicates over three consecutive days. Then the test solutions were prepared independently by 3 operators, in triplicate with the same PMR for the intermediate precision. RSD of all the analytes were within 3.0% which indicated the excellent precision (Table S4 and S5).
Table 4. Quantitative analysis of emodin (EM), physcion (PH), emodin-8-O-β-D-glucoside (EMG), physcion-8-O-β-D-glucoside (PHG) in 40 batches of Polygoni Multiflori Radix (n = 2, %).
No. Origin EM PH EMG PHG
ESM ESM SSDCM ESM SSDCM ESM SSDCM
1 Yunnan 0.029 0.013 0.013 0.052 0.054 0.038 0.036
2 Yunnan 0.071 0.023 0.024 0.125 0.129 0.048 0.048
3 Yunnan ND ND ND ND ND ND ND
4 Hubei 0.056 0.023 0.024 0.202 0.205 0.069 0.068
5 Hubei 0.045 0.023 0.023 0.088 0.090 0.024 0.025
6 Sichuan 0.001 ND ND 0.004 0.001 0.003 0.001
7 Sichuan 0.104 0.034 0.035 0.279 0.287 0.095 0.094
8 Sichuan 0.053 0.017 0.018 0.179 0.181 0.071 0.069
9 Sichuan 0.053 0.017 0.018 0.177 0.179 0.070 0.068
10 Sichuan 0.042 0.014 0.015 0.302 0.301 0.118 0.113
11 Sichuan 0.061 0.015 0.016 0.272 0.275 0.080 0.078
12 Sichuan 0.225 0.066 0.068 0.266 0.277 0.065 0.066
13 Sichuan 0.073 0.022 0.023 0.160 0.165 0.069 0.068
14 Guizhou 0.043 0.016 0.017 0.084 0.086 0.048 0.047
15 Guizhou 0.000 0.001 ND 0.004 ND 0.002 ND
16 Guizhou 0.098 0.039 0.040 0.196 0.203 0.059 0.059
17 Guizhou 0.005 0.004 0.004 0.002 0.004 0.002 0.003
18 Guizhou 0.103 0.049 0.050 0.088 0.093 0.040 0.040
19 Guizhou 0.073 0.039 0.040 0.030 0.034 0.015 0.016
20 Guizhou 0.010 0.010 0.009 0.034 0.031 0.008 0.008
21 Guangxi 0.098 0.038 0.038 0.213 0.219 0.087 0.086
22 Guangxi ND ND ND ND ND ND ND
23 Henan 0.238 0.079 0.080 0.079 0.084 0.012 0.013
24 Henan 0.060 0.033 0.034 0.021 0.024 0.013 0.014
25 Henan 0.036 0.016 0.016 0.060 0.061 0.019 0.019
26 Henan 0.070 0.024 0.024 0.023 0.027 0.009 0.011
27 Zhejiang 0.061 0.028 0.029 0.037 0.041 0.007 0.008
28 Hebei 0.074 0.025 0.026 0.249 0.254 0.099 0.097
29 Guangdong 0.013 0.008 0.008 0.051 0.048 0.028 0.025
30 Guangdong 0.016 0.007 0.007 0.062 0.059 0.031 0.028
31 Guangdong 0.002 0.001 0.001 0.066 0.034 0.035 0.017
32 Guangdong 0.003 0.002 0.002 0.077 0.048 0.041 0.025
33 Guangdong 0.063 0.028 0.029 0.096 0.099 0.053 0.052
34 Guangdong 0.065 0.029 0.030 0.134 0.138 0.069 0.068
35 Guangdong 0.046 0.023 0.023 0.144 0.146 0.073 0.071
36 Hunan 0.005 0.001 0.002 0.058 0.043 0.017 0.013
37 Hunan 0.042 0.014 0.015 0.062 0.065 0.025 0.025
38 Hunan 0.023 0.016 0.016 0.073 0.073 0.029 0.028
39 Shanxi 0.034 0.014 0.014 0.069 0.071 0.050 0.048
40 Shandong 0.149 0.053 0.054 ND ND ND ND
Average 0.059 0.023 0.025 0.111 0.114 0.044 0.043
2.4 Robustness
2.4.1 Equipment and columns Through the standard solu-tions, the ruggedness of RFs and RRTs of EM, PHG, EMG and PH, were compared when using different equipment and columns. As shown in Table 1 and 2, it can be observed that RFs were little influenced by different columns and equip-ment (RSDs were less than 2.0%). Although analytical columns have a considerable effect on the RRT of EMG (RSD=10.60%), the order of peak location of analytes were unchanged.
2.4.2 Other chromatographic conditions The influences of other chromatographic conditions on the RFs and RRTs of EM, PHG, EMG, and PH were also evaluated. The typical factors included column temperature (25 oC, 30oC, 35oC), different detection wavelength (278 nm, 280 nm, 282 nm), pH value of the mobile phase (mobile phase A was set at 0.08%, 0.10%, 0.12% formic acid-water), and flow rate (0.8, 1.0, 1.2 mL/min). The results showed that RFs of EMG, PH were sensitive to the small changes of detection wavelength, however the RSD were still lower than 5%, which warned that the significance of detection wavelength calibration. Meanwhile it showed that RRT was greatly influenced because the chromatographic behaviors of EM, PHG, EMG, PH were different at different flow rate (RSD > 5.0%), and little influenced when the column temperatures (RSD < 3.0%) varied within the defined range.
2.5 Accuracy
Accuracy was calculated as the recovery by the assay of the known added amount of EM, PHG, EMG, PH, in the sample solution. Prepare sample solutions in three different amount levels (low, 50%; medium, 100%; high, 150%) and triplicate experiments at each level. The recovery for each analyte was calculated as follows: recovery (%) = 100 × (amount found−
original amount)/amount spiked. The results showed that the
recoveries were in the range 95%-105% with the RSD within 3.0% (Table 3).
2.6 Repeatability and stability test
Repeatability was assessed using 9 test solutions of the same PMR sample covering three different concentration levels (high, 0.3 g; medium, 0.2 g; low, 0.1 g) and triplicate experiments at each level. Separately inject equal volumes of test solution into the chromatograph, record the chromato-grams, measure the peak areas for EM, PHG, EMG, PH, then calculate the content .
The stability of sample solution was investigated. It was carried out by comparing the peak areas of EM, PHG, EMG, PH, in the chromatograph of the same sample solution, after storing at room temperature for different time (0, 2, 4, 6, 8, 12, 24 hours) and the RSD was lower than 2.0%. The results were summarized in Table S6 indicating the good stability and repeatability of the sample preparation.
3. Application to real samples
Through the above validation, the SSDMC method showed high repeatability, high stability, good sensitivity, as well as good precision. Then the proposed SSDMC method was applied to assay four anthraquinones in 40 batches of PMR. To evaluate the consistence of result obtained by SSDMC method, all the PMR samples were further determined by external standard method. As listed in Table 4, the SSDMC method could achieve accordant results compared with the external standard method for the analysis of the different PMR samples. It was observed that emodin-8-O- β-D-gluco-side was the predominant compound among four analytes, followed by emodin, physcion-8-O-β-D-glucoside and phys-cion. In addition, various PMR samples from different geographical locations significantly differed in the content of four anthraquinones. As shown in Figure 3, it was found that the PMR from Sichuan had a higher content of anthraquinones than other origin places. Meanwhile, natural
Figure 3. The contents of EM, PH, EMG and PHG in 40 batches of PMR samples determined by two approaches. 1-3, Yunnan; 4-5, Hubei; 6-13, Sichuan; 14-20, Guizhou; 21-22, Guangxi; 23-26, Henan; 27, Zhejiang; 28, Hebei; 29-35, Guangdong; 36-38, Hunan; 39, Shanxi; 40, Shandong.
variations in harvest time, climate and growth environment also related directly to content uniformity in herbal medi-cines. The results indicated that the direct analysis of anthraquinones is of importance for quality control of PMR.
CONCLUSIONS
In this work, SSDMC method was used for the quantitation of four anthraquinones in PMR with single standard. The results between SSDMC method and conventional external standard method had no notable differences, which proved that SSDMC method is a reliable and stable technique for quantitation of EM, PH, EMG and PHG. Fourty batches of PMR samples were successfully determined and compared. A higher amount of anthraquinones was found in the samples from Sichuan province, the variability in the individual anthraquinone content in RMR from the different origin places might be ascribed to environmental factors such as climate, soil, or post-harvest processing. Because of the characteristic of convenience, succinctness, and rapidness, the established methodology- SSDMC method was suitable for routine quality assurance and standardization of the compound from the raw material and commercially available pharmaceutical preparations.
ACKNOWLEDGMENTS
This study was supported by the traditional Chinese Medi-cine Industry Special Scientific Research (No. 201307002), the National New Drug Innovation Major Project of China (No. 2012ZX09304005002) and A Project Funded by the Priority Academic Program Development of Jiangsu Higher Education Institutions (PAPD).
REFERENCES
1. China Pharmacopoeia Committee. Pharmacopoeia of the People’s Republic of China (The first division). Beijing:China Chemical Industry Press, 2010,164–165.
2. Chen Q, Zhang SZ, Ying HZ, Dai XY, Li XX, Yu CH, Ye HC. Chemical characterization and immunostimulatory effects of a polysaccharide from Polygoni Multiflori Radix Praeparata in cyclophosphamide-induced anemic mice.Carbohydrate Polymers2012, 88(4): 1476–1482. 3. Um MY, Choi WH, Aan JY, Kim SR, Ha TY. Protective effect of Polygonum
multiflorum Thunb on amyloid beta-peptide 25-35 induced cognitive deficits in mice.Journal of ethnopharmacology2006, 104(1-2): 144–8. 4. Lv L, Gu X, Tang J, Ho C. Antioxidant activity of stilbene glycoside
from Polygonum multiflorum Thunb in vivo.Food Chemistry2007, 104(4): 1678–1681.
5. Lin P, He YR, Lu JM, Li N, Wang WG, Gu W, Yu J, Zhao RH. In vivo lipid regulation mechanism of polygoni multiflori radix in high-fat diet fed rats. Evidence-based complementary and alternative medicine 2014, 2014: 642058.
6. Guan S, Su W, Wang N, Li P, Wang Y. A potent tyrosinase activator from Radix Polygoni multiflori and its melanogenesis stimulatory effect in B16 melanoma cells. Phytotherapy research 2008,22(5): 660–3.
7. Zhu ZW, Li J, Gao XM, Amponsem E, Kang LY, Hu LM, Zhang BL, Chang YX. Simultaneous determination of stilbenes, phenolic acids, flavonoids and anthraquinones in Radix polygoni multiflori by LC-MS/ MS. Journal of pharmaceutical and biomedical analysis2012, 62: 162–6.
8. He D, Chen B, Tian Q, Yao S. Simultaneous determination of five anthraquinones in medicinal plants and pharmaceutical preparations by HPLC with fluorescence detection.Journal of pharmaceutical and biomedical analysis2009,49(4): 1123–7.
9. Zuo Y, Wang C, Lin Y, Guo J, Deng Y. Simultaneous determination of anthraquinones in radix Polygoni multiflori by capillary gas chromato-graphy coupled with flame ionization and mass spectrometric detection.Journal of chromatography A2008, 1200(1): 43–8. 10. Da J, Wu WY, Hou JJ, Long HL, Yao S, Yang Z, Cai LY, Yang M, Jiang
BH, Liu X, Cheng CR, Li YF, Guo DA. Comparison of two officinal Chinese pharmacopoeia species of Ganoderma based on chemical research with multiple technologies and chemometrics analysis. Journal of chromatography A2012,1222: 59–70.
11. Hou JJ, Wu WY, Liang J, Yang Z, Long HL, Cai LY, Fang L, Wang DD, Yao S, Liu X, Jiang BH, Guo DA. A single, multi-faceted, enhanced strategy to quantify the chromatographically diverse constituents in the roots of Euphorbia kansui. Journal of pharmaceutical and biomedical analysis2014, 88: 321–30.