Article
J. Braz. Chem. Soc., Vol. 26, No. 10, 2159-2168, 2015. Printed in Brazil - ©2015 Sociedade Brasileira de Química 0103 - 5053 $6.00+0.00
A
*e-mail: [email protected]
Square-Wave Voltammetric Determination of Paracetamol and Codeine in
Pharmaceutical and Human Body Fluid Samples Using a Cathodically Pretreated
Boron-Doped Diamond Electrode
Anderson M. Santos, Fernando C. Vicentini, Patrícia B. Deroco, Romeu C. Rocha-Filho and Orlando Fatibello-Filho*
Departmento de Química, Universidade Federal de São Carlos, C.P. 676, 13560-970 São Carlos-SP, Brazil
Simple, fast, and inexpensive electroanalytical procedures were developed for the determination of codeine (COD) solely and paracetamol (PCT) and COD simultaneously in pharmaceutical formulations and human body fluids. The methods involve the combination of square-wave voltammetry (SWV) with a cathodically pretreated boron-doped diamond electrode and a 0.2 mol L–1 acetate buffer (pH 4.0) solution as the supporting electrolyte. Significantly low limits
of detection were obtained for COD solely or PCT and COD simultaneously: 1.19 or 18 and 14 nmol L–1, respectively. The proposed SWV method was successfully applied in the simultaneous
determination of PCT and COD in four samples of pharmaceutical tablets, with results similar (at 98% confidence level) to those obtained using a reference high-performance liquid chromatography (HPLC) method. Additionally, adequate results were obtained when concentrations of PCT and COD were determined in human urine or serum samples by addition-recovery. Clearly, the proposed method is an excellent option for the determination of COD solely or PCT and COD simultaneously.
Keywords: acetaminophen, BDD electrode, determination of drugs, electrochemical pretreatment, square-wave voltammetry
Introduction
The determination of drugs in pharmaceuticals and biological fluids is an important area of analytical chemistry that is undergoing rapid development and plays a significant role in quality control, diagnosis in clinical medicine (in cases of suspected drug intoxication), and also studies of physiological function.1,2 Therefore, the development of
simple, rapid, sensitive, and accurate analytical procedures for the identification and quantification of drugs is currently of great interest and significance.
Paracetamol (PCT) (acetaminophen or N-acetyl-p -aminophenol) is a widely used analgesic and antipyretic.3,4
Although this drug is very safe at therapeutic doses, overdoses are known to cause severe liver damage, i.e., PCT overdoses are associated with hepatotoxicity and thus can cause organ failure within hours.5-7 When ingested, PCT is
rapidly absorbed by the gastrointestinal tract, being partially converted to active metabolites in the liver and excreted (4% of it unchanged) primarily via the kidneys.8 PCT is
commonly used for the treatment of mild to moderate pain. For the relief of more intense pains, combination analgesia is often recommended, using analgesics with different modes of action.
Codeine (COD) (3-methylmorphine) is an opioid analgesic and antitussive9 that is metabolized mainly in
the liver and 5-15% of it is excreted unchanged in the urine.10 COD is a controlled drug, available in small
quantities in combination analgesics with PCT or other analgesics. The COD-PCT association combines the analgesic effects of drugs with central action (COD) and predominantly peripheral action (PCT).11 Thus,
PCT and COD are commonly found in combination in pharmaceutical formulations.
attracted great interest because their use can lead to simpler and faster procedures, with high sensitivity and precision, lower operational costs, and the use of low-toxicity reagents.
Boron-doped diamond (BDD), mainly in the form of films deposited on an electrically conducting substrate, is a carbon-based material that has been widely used as electrochemical sensor due to electrochemical properties that are quite distinct from those of other electrodes commonly used for electroanalytical purposes (e.g., glassy carbon, pyrolytic graphite, and platinum electrode), such as low background current in aqueous solutions, extremely wide potential window, low adsorption, and long-term stability of the response.12,13 However, for many analytes,
the properties of BDD electrodes are significantly dependent on their surface termination (oxygen or hydrogen), which can be modified by appropriate electrochemical pretreatments.14,15
The obtainment of BDD films by chemical-vapor deposition (CVD) leads to predominantly hydrogen-terminated surfaces,12 whose stability is highly dependent
on the level of boron doping in the BDD film.13 Nevertheless,
if necessary, the predominance of hydrogen termination on the BDD surface can be restored by adequate cathodic pretreatments.13,15 In fact, in several studies in the literature
involving different analytes, it has been reported that cathodically pretreated BDD electrodes present higher oxidation current peaks and, in many instances, less positive oxidation peak potentials.16-21 On the other hand,
anodic pretreatments of BBD electrodes may lead to predominantly oxygen-terminated surfaces (oxygen groups such as carbonyl, carboxyl, and hydroxyl).13,14 Similarly,
beneficial effects from anodic pretreatments have also been reported for the determination of other analytes.22-24
Thus, in this work we report on the coupling of voltammetric techniques with the distinctive properties of a cathodically pretreated BDD electrode for the development of sensitive electroanalytical procedures for the determination of COD solely or of PCT and COD simultaneously in pharmaceutical formulations and in synthetic human biological fluids (urine and serum).
Experimental
Reagents and solutions
All reagents were of analytical grade (≥ 99% purity). COD was acquired from Fagron; PCT, sulfuric and phosphoric acids, Na2HPO4, and NaH2PO4 were acquired
from Sigma-Aldrich, whereas acetic acid and sodium acetate, used to prepare the supporting electrolyte, were
acquired from Merck. All solutions were prepared using deionized water (resistivity ≥ 18.2 MΩ cm) from a Millipore Milli-Q® system. Stock solutions (10.0 mmol L–1)
of COD and PCT were prepared daily.
Apparatus
All voltammetric measurements (cyclic voltammetry (CV), SWV and DPV) were carried out in a 25.0 mL three-electrode electrochemical cell, using an Autolab PGSTAT-12 (Ecochemie) potentiostat/galvanostat controlled by the GPES 4.9 software. The working electrode was BDD (8000 ppm BDD film deposited on a p-silicon substrate, acquired from NeoCoat), with 0.69 cm2 exposed
area; the BDD film was deposited as described elsewhere.25
The counter electrode was a platinum foil, whereas the reference electrode was Ag/AgCl (3.0 mol L–1 KCl), to
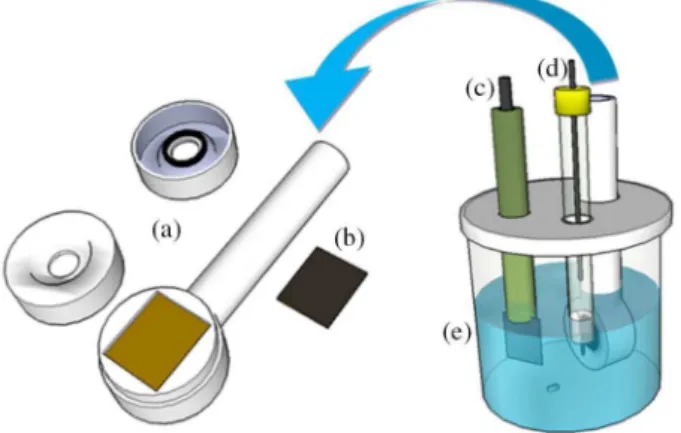
which all potentials hereinafter are referred. Figure 1 depicts a scheme of the device (Teflon pipe) used for holding the BDD electrode and of the electrochemical cell itself.
The BDD electrode was electrochemically pretreated in a 0.5 mol L–1 H
2SO4 solution as follows: anodically, by
applying 40 mA cm−2 for 30 s, or cathodically, by applying
−40 mA cm−2 for 180 s (this cathodic pretreatment was
always preceded by an anodic pretreatment).
The background current was subtracted from all voltammetric curves related to the analytes. All experiments were carried out at room temperature (25 ± 1 °C).
For purposes of comparison, a high-performance liquid chromatography (HPLC) method was also used for the determination of COD and PCT in commercial pharmaceutical formulations; this method is a slightly modified version of the one proposed by
Ramos-Martos et al.26 Thus, an LC-10 AT Shimadzu system
with a UV-Vis detector (SPD-M10-AVP) set at 284 nm and a Shim-pack CLC-ODS (6.0 mm × 150 mm i.d., 5 µm) chromatographic column was used. The mobile phase was an acetonitrile-water mixture (75/25, v/v), used at a flow rate of 1 mL min−1, while the injection volume was 20 µL.
Analytical procedure
CV was used to carry out some preliminary studies. Thus, the electrochemical behaviors of PCT and COD were assessed, as well as the effects of electrochemical pre-treatments of the BDD electrode and of the supporting electrolyte (pH and composition) on these behaviors. Actually, the effect of the supporting electrolyte was evaluated for COD solely, because the content of this analyte is much lower in the pharmaceutical samples.
The determination of COD solely or PCT and COD simultaneously was evaluated using SWV and DPV. The instrumental parameters for SWV (frequency, amplitude, and scan increment) and DPV (scan rate potential, pulse amplitude, and modulation time) were optimized before the respective analytical curves were constructed using successive additions of aliquots of the PCT and COD stock solutions. All measurements were carried out in triplicate (n = 3) for each concentration. The limits of detection were calculated as equal to three times the standard deviation for the blank solution (n = 10) divided by the slope of the analytical curve.27 The precision of the proposed method
was verified from repeatability studies (intra-day, n = 10, and inter-day, n = 5).
Four commercial pharmaceutical samples of PCT and COD combination formulations were purchased in a local drugstore (A and B: 500 mg of PCT and 30 mg of COD per
tablet; C and D: 500 mg of PCT and 7.5 mg of COD per
tablet). The analyses of these pharmaceutical formulations were performed using ten tablets of each sample, which, after being weighed, were reduced to a powder using a mortar and pestle. Afterwards, a suitable amount of each sample was weighed and transferred to a volumetric flask, whose remaining volume was completed with deionized water to obtain the PCT and COD stock solutions for each sample. These solutions were subjected to sonication for 10 min and then the non-dissolved solids were filtered off. Aliquots of each of the stock solutions were directly added to the supporting electrolyte solution in the electrochemical cell and the respective voltammograms were recorded. The quantification of the samples was performed in triplicate by interpolation from the respective analytical curves. The pharmaceutical samples were also analyzed by an HPLC method (the analytical conditions and procedure
are described in the Apparatus section). Additionally, the possible interference of some excipients commonly found in these pharmaceutical samples was evaluated using the SWV technique.
Finally, the effect of biological sample matrices (urine and human serum) on the proposed method was also investigated by addition/recovery experiments. For this, synthetic urine and human serum samples (containing the majority of interferents commonly present in real samples) were prepared.28,29 PCT and COD at two different
concentrations (1.0 µmol L–1 PCT and 0.5 µmol L–1 COD,
or 60.0 µmol L–1 PCT and 6.0 µmol L–1 COD) were then
added to the two biological samples and directly analyzed in triplicate.
Results and Discussion
Determination of the electroactive area of the BDD electrode
After each pretreatment (cathodic or anodic) of the BDD surface, the electroactive area of the working electrode was estimated by CV, using a 1.0 mmol L–1 [Fe(CN)
6]4– solution
in aqueous 0.10 mol L–1 KCl (Figures S1a and S1c in the
Supplementary Information), based on the Randles-Sevcik equation:30
Ip = ±(2.69 × 10⁵) n3/2A D1/2C v1/2 (1)
where Ip is the peak current (A), n the number of electrons
transferred, A the electroactive area (cm2), D the diffusion
coefficient of [Fe(CN)6]4– in the 0.1 mol L–1 KCl solution
(7.6 × 10⁻⁶ cm2 s−1), v the potential scan rate (V s−1), and C
the [Fe(CN)6]4− concentration (mol cm−3).
The obtained slopes of the Ip vs. v1/2 plots for the
[Fe(CN)6]4− oxidation process were 3.00 × 10⁻⁴ A V−1/2 s1/2
for the anodically pretreated BDD electrode (Figure S1b), and 3.65 × 10⁻⁴ A V−1/2 s1/2 for the cathodically pretreated
BDD electrode (Figure S1d). The corresponding estimated electroactive areas were thus 0.41 or 0.50 cm2, for the
anodically or cathodically pretreated BDD electrode, respectively. From these results it is clear that the attained electrochemical response for the [Fe(CN)6]4− probe is
significantly affected by the type of electrochemical pretreatment applied on the BDD electrode surface. Indeed, the cathodic pretreatment of the BDD electrode leads to a greater electroactive area than the anodic pretreatment, which is coherent with the fact that usually the kinetic behavior of the [Fe(CN)6]4−/3– redox couple is more
reversible on cathodically than on anodically pretreated BDD electrodes.13 It should be recalled that the obtained
area of the BDD electrode (0.69 cm2); this may be attributed
to non-uniformity of boron distribution on the electrode surface, which is dependent on the doping level.31
Furthermore, the heterogeneous electron transfer rate constant (k0) was also calculated after each pretreatment
(cathodic or anodic) of the BDD electrode, using Nicholson’s equation:32
ψ = k0 [πDnvF / (RT)]−1/2 (2)
where ψ is a kinetic parameter, π = 3.1415, D is the diffusion coefficient of [Fe(CN)6]4− in the 0.1 mol L−1 KCl
solution (7.6 × 10⁻⁶ cm2 s−1), v the potential scan rate (V s−1),
F the Faraday constant (96485 C mol−1), R the universal gas
constant (8.314 J K−1 mol−1), and T the absolute temperature
(298 K).
The values of ψ were calculated using an equation
proposed by Lavagnini et al.,33 which relates the values of ψ and ∆Ep for each scan rate:
ψ = (−0.6288 + 0.0021 × ∆Ep) / (1 – 0.017 × ∆Ep) (3)
The estimated value of k0 thus obtained is 3.78 × 10⁻³
or 5.42 × 10⁻³ cm s−1 for the anodically or cathodically
pretreated BDD electrode, respectively. An increase of almost 30% in the value of k0 is observed when the BDD
electrode is cathodically pretreated. As seen above, the electrochemical pretreatment of the BDD electrode does affect its electrochemical activity, which is reflected in the values of k0.
Electrochemical behavior of PCT and COD
Cyclic voltammetry was employed to evaluate the electrochemical behavior of PCT and COD on the cathodically pretreated BDD electrode, when cyclic
voltammograms were obtained for 0.10 mmol L–1 PCT
and 0.10 mmol L–1 COD in a 0.2 mol L–1 phosphate
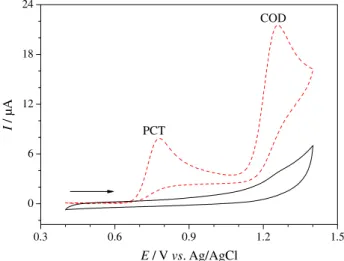
buffer (pH 4.0) solution. As can be seen in Figure 2, both analgesics showed well-defined oxidation peaks, at electrode potentials of ca. 0.75 and 1.25 V for PCT and COD, respectively. Besides, both analytes did not present a reduction peak, which characterizes an irreversible charge-transfer process for these molecules.
As previously highlighted, the electrochemical response of BDD electrodes can be significantly affected by the kind of electrochemical pretreatment used (anodic or cathodic). Predominantly hydrogen-terminated surfaces may be obtained when a BDD electrode undergoes adequate cathodic pretreatments; on the other hand, predominantly oxygen-terminated surfaces may be obtained when adequate anodic
pretreatments are performed.13-15 Consequently, the effect of
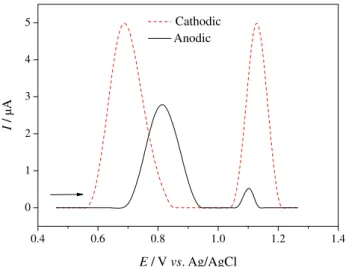
specific electrochemical pretreatments on the simultaneous determination of PCT and COD was investigated using SWV. Figure 3 shows the voltammetric response obtained for the simultaneous determination of 10.0 µmol L–1 PCT
and 4.0 µmol L–1 COD in a 0.2 mol L–1 phosphate buffer
(pH 4.0) solution after the BDD electrode was cathodically or anodically pretreated. As can be inferred from this figure, the cathodic pretreatment of the BDD electrode leads to higher oxidation peak current (Ipox) values for both compounds;
comparatively to the anodic pretreatment, Ipox is increased
by factors of 1.8 and 9.5 for PCT and COD, respectively. Additionally, the separation between the oxidation peak potentials for these analytes increased from 0.29 V, when the anodic pretreatment was used, to 0.44 V, when the cathodic pretreatment was performed, mainly caused by a electrocatalytic effect on the PCT oxidation brought on by the cathodic pretreatment, i.e., brought on by a predominantly hydrogen-terminated BDD surface. Actually, we previously used this electrocatalytic effect to develop a novel and highly selective electrochemical method for the simultaneous determination of PCT and caffeine.34 It should be also noted
that sometimes such electrocatalytic effect is brought on for both analytes, as it was the case when we developed a method for the simultaneous determination of two food antioxidants, butylated hydroxyanisole and butylated hydroxytoluene, using SWV.35 However, not always the increase of I
pox
is accompanied by an electrocatalytic effect - see, for example, the recently reported method for the simultaneous determination of amlodipine and hydrochlorothiazide, two antihypertensive drugs.36 Considering the above, hereinafter
all further assays of PCT and COD are carried out using a cathodically pretreated BDD electrode.
Figure 2. Cyclic voltammograms (v = 50 mV s–1) obtained in the absence (––) or presence (– –) of 0.10 mmol L–1 PCT and 0.10 mmol L–1 COD in a 0.2 mol L–1 phosphate buffer (pH 4.0) solution using a cathodically pretreated BDD electrode.
Subsequently, the effect of the pH of the supporting electrolyte on the COD oxidation peak was investigated, considering that COD is present in pharmaceutical samples at a much lower content level compared to that of PCT. Using a 0.04 mol L–1 Britton-Robinson buffer (pH 2.0 to
8.0) solution, the highest analytical signal was obtained for the pH 4.0 solution. Thus, keeping the pH fixed at 4.0, the effect of the composition of the supporting electrolyte was further investigated employing 0.2 mol L–1 phosphate
or acetate buffer solutions, and 0.2 mol L–1 sodium nitrate
or potassium chloride solutions (the pH of the latter saline solutions was adjusted with HNO3 and HCl solutions,
respectively). The highest magnitude of analytical signal (data not shown) was obtained using the 0.2 mol L–1 acetate
(pH 4.0) buffer solution. Thus, this supporting electrolyte solution was selected for further experiments.
Analytical performance using SWV and DPV
Firstly, SWV and DPV were assessed for the individual determination of COD using a cathodically pretreated BDD electrode, taking into account the attained linear range, sensitivity, and limit of detection. Then, the effect of the experimental parameters that affect the SWV or DPV response was evaluated for a 10.0 µmol L–1 COD
solution in a 0.2 mol L–1 acetate buffer (pH 4.0) solution.
The obtained optimum values for these parameters are presented in Table 1, for both SWV and DPV.
Next, analytical curves were obtained by adding different concentrations of the COD standard solution to the 0.2 mol L–1 acetate buffer (pH 4.0) solution. The obtained SW
and DP voltammograms, as well as their respective analytical
curves, can be seen in Figure S2. The obtained linear range for both techniques was of 8.99 × 10⁻⁸ to 9.81 × 10⁻⁶ mol L–1,
whereas the analytical curve for SWV is described by the equation Ip (µA) = –0.28 + 1.32 CCOD (µmol L–1) (r = 0.999)
and that for DPV by Ip (µA) = –0.08 + 0.78 CCOD (µmol L–1)
(r = 0.999), with limits of detection of 1.19 and 1.40 nmol L–1, respectively. All the analytical parameters
obtained in the individual determination of COD using SWV and DPV can be seen in Table S1. From a comparison of these results, we conclude that SWV yielded better analytical parameters, i.e., lower limit of detection and higher sensitivity. Therefore, this technique was chosen for the development of an electroanalytical procedure for the simultaneous determination of COD and PCT. Here it is worthwhile highlighting that these limit of detection values are excellent when compared with others in the literature. Recently Mashhadizadeh and Rasouli,37 using a carbon paste
electrode modified with TiO2 nanoparticles to determine
COD, reported a value of 18 nmol L–1, which, as compared
by these authors, was then the lowest limit of detection for COD attained by an electrochemical method. Here it should be noted that previously Svorc et al.38 also employed an
unmodified BDD (boron doping of 1000 ppm) electrode to determine COD in pharmaceutical and human urine samples, when a limit of detection of 0.08 µmol L−1 was obtained, a
much higher value than those here reported, partly due to a lower sensitivity. Clearly, a proper pretreatment of the BDD electrode is crucial; those authors cleaned (pretreated) the BDD electrode by CV scanning between –2.0 and 2.0 V for 10 min in 1.0 mol L–1 HNO
3, followed by polishing with
a piece of damp silk cloth until a mirror-like character of surface was obtained.
Simultaneous determination of PCT and COD by SWV
Firstly, the analytical curve for the determination of PCT was constructed by fixing the COD concentration
Figure 3. Square-wave voltammograms obtained for a mixture of 10.0 µmol L–1 PCT and 4.0 µmol L–1 COD solutions in the 0.2 mol L–1 phosphate buffer (pH 4.0) solution using an anodically (––) or a cathodically (– –) pretreated BDD electrode. SWV conditions: a = 50 mV, f = 70 Hz, and ∆Es = 4 mV.
Table 1. Range assessed and optimum values obtained for the experimental parameters of the SWV and DPV techniques used for the determination of 10.0 µmol L–1 COD in a 0.2 mol L–1 acetate buffer (pH 4.0) solution with a cathodically pretreated BDD electrode
Technique Parameter Tested range
Optimum value
SWV
frequency, f / Hz 10-100 60 amplitude, a / mV 10-100 60 potential increment, ∆Es / mV 1-8 4 DPV
scan rate potential, v / (mV s−1) 2.5-25 10 amplitude, a / mV 10-100 90
pulse time, t / ms 2.5-20 10 SWV: square-wave voltammetry; DPV: differential pulse voltammetry.
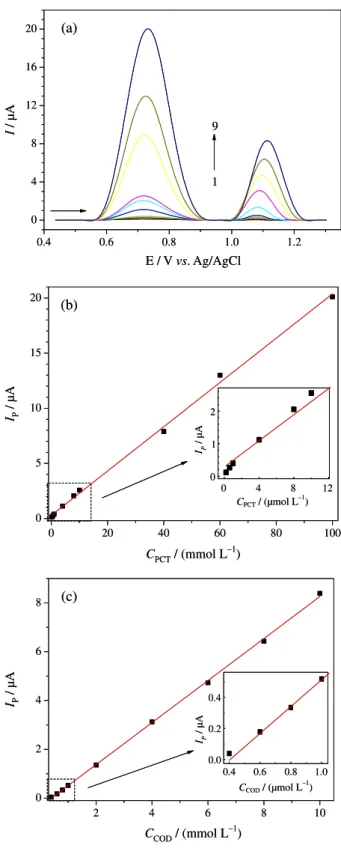
at 6.0 µmol L–1 and varying the PCT concentration in the
range of 0.20 to 97.3 µmol L–1. As can be apprehended
from the thus obtained SW voltammograms, shown in Figure 4a, the value of Ipox for PCT increased regularly with
its concentration, while the value of Ipox for COD remained
constant (relative standard deviation (RSD) = 1.6%). Similarly, in the next step, when the concentration of PCT was kept constant (60.0 µmol L–1) and that of COD was
varied in the range of 0.40 to 9.82 µmol L–1, the value of I pox
for COD increased regularly with its concentration, while the value of Ipox for PCT remained constant (RSD = 1.0%)
- see Figure 4b. From these results, we can conclude that PCT and COD do not interfere in the SWV determination of each one of them in the presence of the other.
Secondly, we investigated the possible simultaneous determination of PCT and COD by SWV (Figure 5). The thus obtained analytical curves (also shown in Figure 5) are
linear for the concentration ranges of 0.20 to 95.8 µmol L–1,
for PCT, and 0.40 to 9.58 µmol L–1, for COD, with limits
Figure 4. Square-wave voltammograms obtained using the cathodically pretreated BDD electrode for various concentrations of: (a) PCT (1-14: 0.20, 0.40, 0.60, 1.00, 2.00, 4.00, 5.90, 7.90, 9.80, 19.6, 39.2, 58.6, 78.0, and 97.3 µmol L–1) at a fixed concentration of COD (6.0 µmol L–1); (b) COD (1-9: 0.40, 0.60, 0.79, 0.99, 1.98, 3.95, 5.91, 7.87, and 9.82 µmol L–1) at a fixed concentration of PCT (60.0 µmol L–1). Supporting electrolyte: 0.2 µmol L–1 acetate buffer (pH 4.0). SWV conditions: a = 60 mV, f = 60 Hz, and ∆Es = 4 mV. Insets: corresponding analytical curves.
of detection of 18 and 14 nmol L–1, respectively. The
equations associated with these analytical curves are:
Ip (µA) = 0.28 + 0.20 CPCT (µmol L–1) (r = 0.999), for PCT,
and Ip (µA) = –0.35 + 0.86 CCOD (µmol L–1) (r = 0.999),
for COD. All the analytical parameters obtained in the simultaneous determination of PCT and COD using SWV can be seen in Table 2.
When these analytical parameters are compared with those previously reported in the literature (see Table 3), it is clearly seen that the use of a cathodically pretreated BDD electrode led to excellent limits of detection for PCT and COD. These limits of detection are significantly lower than those obtained by Pournaghi-Azar and Saadatirad,39
Ensafi et al.,40 and Babaei et al.,41 using other types of
electrodes, while they are similar to those reported by Afkhami et al.;42 however, these authors used a graphene
oxide-CoFe2O4 nanocomposite modified carbon paste
electrode, whereas the here-proposed method does not involve the use of a modified electrode. In fact, the here-presented method is simple and shows excellent analytical performance in the simultaneous determination of PCT and COD. Here it should also be noted that previously Svorc etal.43 used a bare (unmodified) BBD electrode and
SWV to simultaneously determine PCT and penicillin V in urine, when a limit of detection of 0.21 µmol L–1 was
attained for PCT. This value is much higher than those
reported here; as mentioned before, clearly the proper pretreatment of the BDD electrode is crucial to enhance its electrochemical activity (actually, the PCT oxidation peak potential reported here is about 200 mV less positive than that reported by those authors).
Next, the intra-day and inter-day repeatability were assessed for two different sets of concentrations of PCT and COD in a 0.2 mol L–1 acetate buffer (pH 4.0)
solution: 1.0 and 0.8 µmol L–1 or 100 and 10.0 µmol L–1,
respectively. The intra-day repeatability was obtained by successive simultaneous determinations (n = 10) of PCT and COD, resulting in RSD values of 1.21 and 1.83% or 0.90 and 1.27%, respectively. The inter-day repeatability was obtained by simultaneous determinations of PCT and COD on five different days (n = 5) using freshly prepared solutions, resulting in RSD values of 3.89 and 4.93% or 3.19 and 4.17%, respectively. From these repeatability results, we can conclude that the precision of the proposed procedure is excellent.
Finally, the selectivity of the proposed method was evaluated by introducing some possible interferents in the solution containing the two analgesics: magnesium stearate, starch, silicon dioxide, cellulose, dioctyl sodium sulfosuccinate (docusate sodium), sodium bisulfite, benzoic acid, and sodium benzoate (excipients typically found in combined PCT-COD pharmaceutical formulations). For such, a standard solution of 10.0 µmol L–1 PCT and 4.0 µmol L–1
COD in the 0.2 mol L–1 acetate buffer (pH 4.0) solution was
spiked with each interferent at the following concentration ratios: 1:10 (PCT:interferent) and 1:25 (COD:interferent). The respective current signals (n = 3) were compared with those for the standard solution in the absence of any interferent and the percent average deviation was calculated (see Table 4). As can be apprehended from these results, the percentage deviations in the current signals for PCT and COD caused by the presence of any of the evaluated interferents were always smaller than 7%; hence, the selectivity of the proposed method can be considered adequate.
Table 2. Analytical parameters obtained for the simultaneous determination of PCT and COD using the SWV technique coupled with a cathodically pretreated BDD electrode
Analytical parameter SWV
PCT COD
Linear range / (µmol L–1) 0.20-95.8 0.40-9.6
Sensitivity / (A L mol–1) 0.20 0.86
Limit of detection / (nmol L–1) 18 14
SWV: square-wave voltammetry; PCT: paracetamol; COD: codeine.
Table 3. Comparisons of various electroanalytical methods proposed for detection of PCT and COD
Electrodea Method Linear range / (µmol L
–1) Limit of detection / (µmol L–1)
Reference
PCT COD PCT COD
Al/Pd DPV 100-3000 100-3000 5 5 39
Si/Pd DPV 1.0-700 1.0-700 0.4 0.3 40
MWCNT/GCE DPV 5-400 5-240 0.19 0.20 41
CoFe2O4-Grph/CPE SWV 0.03-12 0.03-12 0.025 0.011 42
BDD SWV 0.2-95.8 0.4-9.6 0.018 0.014 this work
Simultaneous deter mination of PCT and COD in pharmaceutical samples
The proposed voltammetric method was applied in the determination of PCT and COD in four commercial pharmaceutical samples (tablets), in which the PCT and COD contents (n = 3) in each sample were obtained by interpolation from the respective analytical curve. For comparison purposes, these contents were also determined by a reference HPLC method (also n = 3). The paired Student t-test (at a confidence level of 98%) was applied to compare the results obtained by the two methods (see
Table 5). Considering that the calculated t values (4.33 for PCT and 1.49 for COD) were smaller than the critical value (4.54, α = 0.02), we can conclude that there is no difference
between the results obtained by the two methods at this confidence level. Hence, the here-proposed voltammetric method is adequate for the simultaneous determination of PCT and COD in combination pharmaceutical formulations.
Simultaneous determination of PCT and COD in human body fluid samples
Finally, the simultaneous determination of PCT and COD in human body fluid samples was carried out using the here-proposed method, when samples of synthetic human urine and serum spiked with two different concentrations of PCT and COD were analyzed (see Table 6). From these results (recoveries ranging from 98 to 106%), we can conclude that there were no significant matrix interferences on the proposed SWV method, which, hence, has great potential to be applied in the simultaneous determination of PCT and COD in real biological samples.
Conclusions
A novel electrochemical method involving the use of SWV combined with a cathodically pretreated BDD electrode is proposed for the simultaneous determination of the analgesics PCT and COD in pharmaceutical and biological fluid samples. An excellent separation of 0.44 V between the oxidation peak potentials for these analytes
Table 4. Effect of possible interferents on the SW voltammetric determination of 10.0 µmol L–1 PCT and 4.0 µmol L–1 COD in the 0.2 mol L–1 acetate buffer (pH 4.0) solution using a cathodically pretreated BDD electrode
Interferent Average deviation a / %
PCT (1:10)b COD (1:25)b
Magnesium stearate 1.6 2.9
Starch –5.5 –1.6
Silicon dioxide –2.0 –1.6
Cellulose –2.2 –1.1
Docusate sodium –1.7 2.1
Sodium bisulfite 2.5 –6.4
Benzoic acid 1.9 3.2
Sodium benzoate 0.0 0.8
an = 3; bconcentration ratio: 1:10 (PCT:interferent) and 1:25 (COD:interferent).
Table 5. Results (mass per tablet) obtained in the simultaneous determination of the PCT and COD content in four commercial pharmaceutical formulations using the proposed method (SWV) and a reference HPLC method
Sample PCT / (mg per tablet) COD / (mg per tablet)
HPLCa SWVa Errorb / % HPLCa SWVa Errorb / %
A 576 ± 12 551 ± 6 –4.3 29.0 ± 0.4 29.4 ± 0.2 1
B 553 ± 8 504 ± 1 –8.9 26.6 ± 0.7 26.1 ± 0.4 –2
C 525 ± 1 509 ± 10 –3.0 6.1 ± 0.1 6.7 ± 0.1 1 × 10
D 541 ± 4 498 ± 9 –7.9 5.7 ± 0.1 6.2 ± 0.0 9
a n = 3; berror (%) = 100 × [(SWV value – HPLC value) / (HPLC value)]. PCT: paracetamol; COD: codeine; HPLC: high-performance liquid chromatography; SWV: square-wave voltammetry.
Table 6. Results obtained using the proposed SWV method in the simultaneous determination of PCT and COD spiked into human urine or serum samples
Sample PCT COD
Added / (µmol L–1) Founda / (µmol L–1) Recovery / % Added / (µmol L–1) Founda / (µmol L–1) Recovery / %
Urine I 1.00 1.03 ± 0.09 103 0.50 0.49 ± 0.08 98
Urine II 60.0 59.1 ± 0.1 98.5 6.00 5.98 ± 0.09 99.7
Serum I 1.00 1.01 ± 0.09 101 0.50 0.49 ± 0.07 98
Serum II 60.0 59.5 ± 0.1 99.2 6.00 6.38 ± 0.05 106
was attained when the BDD electrode was cathodically pretreated. Consequently, highly sensitive determinations of COD solely or PCT and COD simultaneously became possible using a 0.2 mol L–1 acetate buffer (pH 4.0) as
supporting electrolyte solution, with quite low limits of detection: 1.19 or 18 and 14 nmol L–1, respectively; these
values are among the lowest ones attained through an electroanalytical method, as far as we could ascertain. Additionally, the proposed method was successfully applied in the simultaneous determination of PCT and COD in four samples of commercial pharmaceutical formulations (tablets), with results similar (at a confidence level of 98%) to those attained using a reference HPLC method. Furthermore, adequate results were obtained when concentrations of PCT and COD were determined in human urine or serum samples by addition-recovery. Clearly the here-proposed SWV method is an excellent option for the determination of COD solely or PCT and COD simultaneously. This novel method, besides being simple, speedy, and inexpensive, is highly sensitive for the determination of these analgesics.
Supplementary Information
Supplementary data are available free of charge at http://jbcs.sbq.org.br as PDF file.
Acknowledgments
Financial support and/or scholarships from the Brazilian funding agencies CNPq, CAPES, and FAPESP (São Paulo Research Foundation) are gratefully acknowledged. A. M. Santos, F. C. Vicentini, and P. B. Deroco are particularly grateful for the award of scholarships by CNPq (grant No. 160658/2013-6) and FAPESP (grants No. 2013/16770-0 and 2014/07919-2), respectively.
References
1. Abbar, J. C.; Malode, S. J.; Nandibewoor, S. T.; Bioelectrochemistry 2012, 83, 1.
2. Nussbaumer, S.; Bonnabry, P.; Veuthey, J.-L.; Fleury-Souverain, S.; Talanta 2011, 85, 2265.
3. Bosch, M. E.; Sanchez, A. J. R.; Rojas, F. S.; Ojeda, C. B.; J. Pharm. Biomed. Anal. 2006, 42, 291.
4. Jefferies, S.; Saxena, M.; Young, P.; Crit. Care Resusc. 2012, 14, 74.
5. Soliman, M. M.; Nassan, M. A.; Ismail, T. A.; BMC Complementary Altern. Med. 2014, 14, 457.
6. Holubek, W. J.; Kalman, S.; Hoffman, R. S.; Hepatology 2006, 43, 880.
7. Jaeschke, H.; Williams, C. D.; Ramachandran, A.; Bajt, M. L.; Liver Int. 2012, 32, 8.
8. Kulo, A.; Peeters, M. Y.; Allegaert, K.; Smits, A.; De Hoon, J.; Verbesselt, R.; Lewi, L.; Van De Velde, M.; Knibbe, C. A. J.; Br. J. Clin. Pharmacol. 2013, 75, 850.
9. Dahan, A.; Wolk, O.; Zur, M.; Amidon, G. L.; Abrahamsson, B.; Cristofoletti, R.; Groot, D. W.; Kopp, S.; Langguth, P.; Polli, J. E.; Shah, V. P.; Dressman, J. B.; J. Pharm. Sci. 2014, 103, 1592.
10. Williams, D. G.; Hatch, D. J.; Howard, R. F.; Br. J. Anaesth.
2001, 86, 413.
11. Raeder, J. C.; Steine, S.; Vatsgar, T. T.; Anesth. Analg. 2001, 92, 1470.
12. Hupert, M.; Muck, A.; Wang, R.; Stotter, J.; Cvackova, Z.; Haymond, S.; Show, Y.; Swain, G. M.; Diamond Relat. Mater.
2003, 12, 1940.
13. Salazar-Banda, G. R.; Andrade, L. S.; Nascente, P. A. P.; Pizani, P. S.; Rocha-Filho, R. C.; Avaca, L. A.; Electrochim. Acta 2006, 51, 4612.
14. Girard, H.; Simon, N.; Ballutaud, D.; Herlern, M.; Etcheberry, A.; Diamond Relat. Mater. 2007, 16, 316.
15. Suffredini, H. B.; Pedrosa, V. A.; Codognoto, L.; Machado, S. A. S.; Rocha-Filho, R. C.; Avaca, L. A.; Electrochim. Acta
2004, 49, 4021.
16. Andrade, L. S.; Salazar-Banda, G. R.; Rocha-Filho, R. C.; Fatibello-Filho, O. In Synthetic Diamond Films: Preparation, Electrochemistry, Characterization, and Applications; Brillas, E.; Martínez-Huitle, C. A., eds.; John Wiley & Sons: Hoboken, 2011, pp. 181-212.
17. Lourencao, B. C.; Baccarin, M.; Medeiros, R. A.; Rocha-Filho, R. C.; Fatibello-Filho, O.; J. Electroanal. Chem. 2013, 707, 15. 18. Eisele, A. P. P.; Mansano, G. R.; De Oliveira, F. M.; Casarin, J.;
Tarley, C. R. T.; Sartori, E. R.; J. Electroanal. Chem. 2014, 732, 46.
19. Brocenschi, R. F.; Rocha-Filho, R. C.; Biaggio, S. R.; Bocchi, N.; Electroanalysis 2014, 26, 1588.
20. Deroco, P. B.; Vicentini, F. C.; Oliveira, G. G.; Rocha-Filho, R. C.; Fatibello-Filho, O.; J. Electroanal. Chem. 2014, 719, 19.
21. Montes, R. H. O.; Marra, M. C.; Rodrigues, M. M.; Richter, E. M.; Munoz, R. A. A.; Electroanalysis 2014, 26, 432. 22. Medeiros, R. A.; Matos, R.; Benchikh, A.; Saidani, B.;
Debiemme-Chouvy, C.; Deslouis, C.; Rocha-Filho, R. C.; Fatibello-Filho, O.; Anal. Chim. Acta 2013, 797, 30.
23. Garbellini, G. S.; Uliana, C. V.; Yamanaka, H.; J. Braz. Chem. Soc. 2011, 22, 1241.
24. Deroco, P. B.; Medeiros, R. A.; Rocha-Filho, R. C.; Fatibello-Filho, O.; Anal. Methods 2015, 7, 2135.
26. Ramos-Martos, N.; Aguirre-Gomez, F.; Molinz-Diaz, A.; Capitan-Vallvey, L. F.; J. AOAC Int. 2001, 84, 676.
27. Bruns, R. E.; Scarminio, I. S.; Neto, B. B.; Statistical Design - Chemometrics; Pearson: New York, 2006.
28. Laube, N.; Mohr, B.; Hesse, A.; J. Cryst. Growth 2001, 233, 367.
29. Silva, T. A.; Zanin, H.; Vicentini, F. C.; Corat, E. J.; Fatibello-Filho, O.; Analyst 2014, 139, 2832.
30. Bard, A. J.; Faulkner, L. R.; Electrochemical Methods: Fundamentals and Applications; John Wiley & Sons: New York, 2001.
31. Holt, K. B.; Bard, A. J.; Show, Y.; Swain, G. M.; J. Phys. Chem. B 2004, 108, 15117.
32. Nicholson, R. S.; Anal. Chem. 1965, 37, 1351.
33. Lavagnini, I.; Antiochia, R.; Magno, F.; Electroanalysis 2004, 16, 505.
34. Lourencao, B. C.; Medeiros, R. A.; Rocha-Filho, R. C.; Mazo, L. H.; Fatibello-Filho, O.; Talanta 2009, 78, 748.
35. Medeiros, R. A.; Rocha-Filho, R. C.; Fatibello-Filho, O.; Food Chem. 2010, 123, 886.
36. Silva, L. P.; Lourencao, B. C.; Fatibello-Filho, O.; Quim. Nova
2015, 38, 801.
37. Mashhadizadeh, M. H.; Rasouli, F.; Electroanalysis 2014, 26, 2033.
38. Svorc, L.; Sochr, J.; Svitkova, J.; Rievaj, M.; Bustin, D.; Electrochim. Acta 2013, 87, 503.
39. Pournaghi-Azar, M. H.; Saadatirad, A.; Electroanalysis 2010, 22, 1592.
40. Ensafi, A. A.; Ahmadi, N.; Rezaei, B.; Abarghoui, M. M.; Talanta 2015, 134, 745.
41. Babaei, A.; Dehdashti, A.; Afrasiabi, M.; Babazadeh, M.; Farshbaf, M.; Bamdad, F.; Sens. Lett. 2012, 10, 1039. 42. Afkhami, A.; Khoshsafar, H.; Bagheri, H.; Madrakian, T.; Sens.
Actuators, B 2014, 203, 909.
43. Svorc, L.; Sochr, J.; Tomcik, P.; Rievaj, M.; Bustin, D.; Electrochim. Acta 2012, 68, 227.
Submitted: July 17, 2015
Published online: August 14, 2015