www.scielo.br/ eq
Volume 34, número 2, 2009
Flow-batch analyser for preparation of calibration standard mixtures in
simultaneous multicomponent spectrometric analysis
Valeria Visanic, Sara R. R. C. Barrosc, Heronides A. Dantas Filhob, Luciano F. Almeidaa, Ricardo A. C.
Limaa, Wallace D. Fragosoc, Teresa C. B. Saldanhac and Mário C. U. Araújoc*, aUniversidade Federal Rural de Pernambuco – UAST – Serra Talhada – PE (Brasil).
bUniversidade Federal do Pará – Faculdade de Química – Belém – PA (Brasil). cUniversidade Federal da Paraíba - Departamento de Química, Caixa Postal 5093,
58051-970 - João Pessoa - PB (Brasil), Email: [email protected], fax: +55-83 - 3216.7438. *Corresponding author
Abstract:
The application of multivariate calibration techniques to multicomponent
analysis by UV-VIS molecular absorption spectrometry is a powerful tool for
simul-taneous determination of several chemical species. However, when this
methodol-ogy is accomplished manually, it is slow and laborious, consumes high amounts of
reagents and samples, is susceptible to contaminations and presents a high
opera-tional cost. To overcome these drawbacks, a low-batch analyser is proposed in this
work. This analyser was developed for automatic preparation of standard calibration
and test (or validation) mixtures. It was applied to the simultaneous determination
of Cu
2+, Mn
2+and Zn
2+in polyvitaminic and polymineral pharmaceutical
formula-tions, using 4-(2-piridilazo) resorcinol as reagent and a UV-VIS spectrophotometer
with a
photodiode array detector. The results obtained with the proposed system are
in good agreement with those obtained by lame atomic absorption spectrometry,
which was employed as reference method. With the proposed analyser, the
prepara-tion of calibraprepara-tion and test mixtures can be accomplished about four hours, while
the manual procedure requires at least two days. Moreover, it consumes smaller
amounts of reagents and samples than the manual procedure. After the preparation
of calibration and test mixtures, 60 samples h
-1can be carried out with the proposed
low-batch analyser.
Introduction
Nowadays, several techniques for simul-taneous determination of chemical species exist, such as X-Ray Fluorescence Spectrometry (XRFS) [1, 2], Atomic and Molecular Fluorescence Spec-trometry (AFS and MFS) [3, 4], Chromatogra-phy [5], Atomic Emission Spectrometry (AES), among others [6]. These techniques are relatively expensive in acquisition and maintenance, turning them less accessible to the most of the industrial and research laboratories. The UV-VIS Molecu-lar Absorption Spectrometry (UV-VIS-MAS) [7] is an analytical method broadly used, due to its simplicity and fast achievement of experimental results. It is classically accomplished, by using chromogenic reagents.
However, the simultaneous determination using UV-VIS-MAS is frequently hindered be-cause it supplies overlapped spectra with hard interpretation for quantitative determinations. To solve the overlapping problem the analyte of inte-rest can be separated from the matrix or the inter-fering species can be masked by adding suitable
reagents. Alternatively a speciic reagent for each
analyte can be used.
4-(2-piridylazo) resorcinol (PAR) is an important reagent of the nitrocompounds group, widely used as spectrometric reagent [8-10]. The main PAR advantage over other reagents is that their metallic compounds are soluble in water, simplifying the analytical procedure and avoi-ding subsequent stages of extraction with organic solvents. Besides, PAR reacts with several me-tals yielding colored chelates which present high absorption in the ultraviolet-visible region of the spectrum. Their large molar absorptivities allied with their wide bands results in overlapping of the complexes spectra. Usually, this drawback may be overcome by the selection of the wavelength and by suitable choice of the molar ratio PAR to metals.
Though in practice, the separation of
in-terfering species may be dificult and slow. The
chemometric methods have been used to solve problems related to multicomponent analysis. The multivariate calibration methods as Multiple Linear Regression (MLR) Principal Components
Regression (PCR) and Regression for Partial Le-ast Squares (PLS) are frequently used to quantita-tive analysis. The association of the chemometric techniques with methods based on UV-VIS-MAS has been applied successfully in the simultaneous determination of two or more species. However, the manual accomplishment of these techniques requires the preparation of a large number of mix-tures (calibration and tests sets), which implies in higher amounts of reagents and samples and in the decreasing of the analytical frequency. The deve-lopment of automatic systems has proved to be a good alternative way to circumvent these
proble-ms. Versatile and lexible low-batch approaches
(FBA) have been proposed to automate several analytical systems [28-37] and have been named and developed by our research group. As most of
the low analysers, FBA also present signiicant
precision and accuracy, high sample throughput and low contamination, low consumption and ma-nipulation of reagents and samples, low cost per analysis and low waste volumes.
In this work, a FBA system is proposed in which the calibration and the sample solutions can be treated in order to carry out simultaneous and multicomponent analysis (FBA-SMA) by UV-VIS-MAS and PLS. The versatility and lexibility
inherent to FBA provides the possibility to yield the calibration and test mixtures accurately and quickly. Hence, it allows performing multivariate calibration techniques with low consume of rea-gents and samples, high sample throughput, low cost per analysis. The FBA-SMA was applied to analysis of commercial samples of polyvitaminic and polymineral pharmaceutical formulations, available in Brazil.
EXPERIMENTAL
Reagents, Samples and Solutions
PAR solution: a 1.62×10⁻³ mol L-1 PAR
so-lution was prepared in 0.05 mol L-1 NH
3 by
Borate buffer (pH 9.0): a 0.01 mol L-1
borax solution was prepared by dissolving Na2B4O7·10H2O in deionized water.
The 1.000 mg L-1 Cu2+, Mn2+ and Zn2+
sto-ck solutions were prepared from Titrisol (Mersto-ck) ampoules in 0.01% HCl (v/v) for Cu2+ and 0,04%
(v/v) for Mn2+ and Zn2+.
Commercial samples of polyvitaminic and polymineral pharmaceutical formulations were used. Each tablet with approximately 4.700 g con-tains Cu2+, Mn2+ and Zn2+ in concentrations spe-ciied by the manufacturer: 0.4 mg, 0.5 mg and
3.0 mg, respectively. Each effervescent tablet was weighed and dissolved in deionized water. After a suitable time (about 15 minutes), enough to elimi-nate all the CO2 present, the volume was comple-ted up to 250.0 mL.
The reference method used for comparison
purposes was the lame atomic absorption spectro -metry (FAAS). Standard solutions were prepared as described above. In the Zn2+ determination, a
further dilution was required, taking an aliquot of
4.0 mL of the sample and completing the volume up to 50.0 mL.
A 9.78×10⁻⁵ mol L-1 methyl orange
[(CH3)2NC6H4N:N.C6H4SO3Na] (Merck) was used as dye solution in the measurement of volumetric ratios [38] procedure.
A solution containing the buffer and the PAR in the same proportions of the mixtures was used in blank measurements.
All solutions were prepared with chemicals of analytical grade. Freshly distilled and deioni-sed water in a system Milli-Q Plus (MILLIPORE) was used.
The Automatic Analyser
The FBA-SMA system is shown in igure 1.
A Hewllet Packard model HP 8453 UV-VIS spec-trophotometer was employed as detector. The re-ference method was applied using a GBC 908AA
lame atomic absorption spectrometer.
Figure 1. Schematic diagram of FBA-SMA. D: Detector; V1-V7: Solenoid valves; S: Sample; MC:
Mix-ing chamber; MS: Magnetic stirrer; M1-M3: Standard solutions of the analytes; B: Buffer; R: PAR reagent and W: Water.
A Gilson Miniplus 3 peristaltic pump and 1.85 mm i.d. Tygon® pumping tubes were used. The transmission lines were constructed with 0.8 mm i.d. Telon® tubing. A 2.0 mL laboratory-made mixing chamber was constructed in Telon®. A Hellma quartz low cell with 10 mm optic path was used. Seven
to direct buffer, sample and PAR solution respec-tively and seventh valve (V7) was used to select
the stream lowing (water or MC mixture) towards low-cell of the spectrophotometer. Details of MC
can be found elsewhere [28].
A Pentium 233 MHz microcomputer equi-pped with a laboratory-made parallel interface card was used to control the proposed system. The control of the system was performed by a program developed in Labview® 5.1, which also controls
the spectrometer hardware. An electronic actuator (EA) increased the power of the signal sent by the microcomputer in order to control the magnetic stirrer and the valves.
Procedure
The analytical procedure is based on the insertion of time controlled volumes of the stan-dard solutions of the ion metals, buffer, PAR and samples solutions towards MC, following homo-genization and the transport of the resulting mix-ture towards detector. The solenoid valves swi-tching on time intervals previously selected by the analyst are proportional to the volume inser-ted into MC of each solution. Before starting the procedure, the solution in each channel is pumped
and recycled towards its lasks, with all the valves
initially switched off.
The MC cleaning step is always accom-plished before any measurement. It is carried out switching on the valves V4 (buffer pH 9.0) and V6 (PAR reagent) during the same time interval, pro-ducing the blank solution (buffer + PAR reagent). Afterwards, this mixture is homogenized during enough time to accomplish the MC cleaning. The valve V7 is switched on, allowing the MC emp-tying and discarding the cleaning mixture. The blank solution is introduced in the system as des-cribed in the cleaning step. In this case however the spectrum is obtained and registered.
To carry out the step of preparation of the calibration and test mixtures, the standard solu-tions valves (V1, V2 and V3) and buffer valve (V4)
are switched on during predeined time intervals
and the resulting solution is homogenized for a suitable time. So, the PAR valve (V6) is switched
on during a predeined time, yielding the mixture
(buffer + metals + PAR). Afterwards, this mixture is homogenized in order to reach a complete
re-action and afterwards it is pumped towards low
cell of the spectrophotometer, where its spectrum is measured and registered. This procedure is re-peated for all calibration and test mixtures. In the sample measurement step, only the valves V4, V5 and V6 are used and the same procedure used for calibration and test is applied.
Procedure of Measurement of Volumetric
Ratios
The concentrations of the metallic species into MC depend on the switching time of the so-lenoids valves. This time is proportional to the volume inserted into MC and it varies according
to the low-rate used in each channel, thus, these low-rates should be well known in order to obtain concentrations with accuracy. If the low-rates
were maintained constant, the total volume into MC should be also constant; however, it doesn’t happen in practice. It occurs due to the asymmetry existent among the pumping channels, furnishing
little differences in each channel low-rate. As
consequence, variations in the switching times will implicate in variations of the total volume of the mixture into MC, resulting a systematic error in the analysis and consequently inaccuracy in the determinations. To solve this problem, a cor-rection in the switching time of the valves must be performed. This correction is accomplished in agreement with the procedure described below.
Considering two solenoid valves, one is re-garding the channel of a given ion metal M, and other to the sample channel S. If the low-rates and switching times of these valves are the same, then:
S M
V
V
=
(1)where VM and VS is the volume of the me-tal and of the sample, respectively. Since Q = V/t,
(where Q is the low rate), the valve timing, t, de
-ines the volumes, V, inserted into MC, then, the
Eq. (1) can be written as:
S S M M
t
Q
t
where QM, tM, QS and tS are the low-rates
and switching times of the metal and sample chan-nels, respectively. Making the sample valve as re-ference valve, Eq. 2 can be rewrite as:
M S S M
Q
Q
t
t
=
(3)In this way, the switching time of the me-tal valve, tM, will be corrected according to the
ratio of the channels low-rates, always taking as
reference the sample channel. To determinate this ratio, initially, a dye solution is pumped during a given time, t, through the sample channel and the buffer through the metal channel.
Methyl orange was used as dye. After ho-mogenization, the mixture is pumped towards the detector, obtaining the signal A1. Afterwards, the positions of the solutions are inverted and these solutions are pumped during the same interval of time, t, obtaining the signal A2. If a linear rela-tionship between absorbance and concentration of the dye solution is observed, the ratio RV between Qs and Qm may be given by Eq 4:
1 2 M S V
A
A
Q
Q
R
=
=
(4)This equation can be deduced starting from the following considerations:
The low-rates QS and QM are given by:
t
V
Q
SS
=
(5)t
V
Q
M=
M (6)The signals A1 and A2 are deined by:
abs tot M 2
A
V
V
A
=
(7) abs tot S 2A
V
V
A
=
(8)where Vtot is the total volume, the sum of the volumes of dye and buffer solutions. Aabsis the signal obtained for the pure dye solution.
From Eq. (5) and (6), is found that:
M S M S M S
V
V
t
V
t
V
Q
Q
=
=
/
/
(9)Isolating the variables VS and VM in the Eq. (7) and (8) and substituting in Eq. (9), the Eq. (10) is obtained: 1 2 1 2
A
A
Q
Q
A
V
A
A
V
A
Q
Q
M S abs tot abs tot MS
=
⇒
=
(10)
which is similar to Eq. (4).
These measurements should be carried out only sporadically, especially when the pumping tubes are exchange.
Calibration
Calibration Mixtures
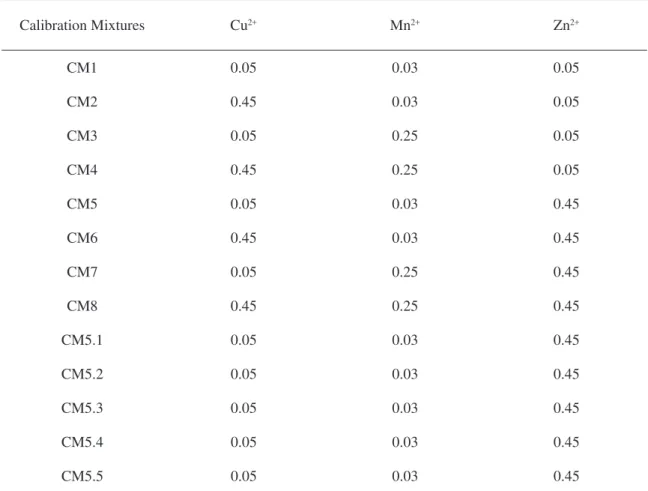
To deine the concentrations of the elements in the calibration mixtures a complete 23 factorial design was used. In the calibration set, ive authentic replicates of a randomly chosen mixture were
included in the original set (Table 1).
Table 1. Mixture calibration set and respective metals concentration (mg L-1)
Calibration Mixtures Cu2+ Mn2+ Zn2+
CM1 0.05 0.03 0.05
CM2 0.45 0.03 0.05
CM3 0.05 0.25 0.05
CM4 0.45 0.25 0.05
CM5 0.05 0.03 0.45
CM6 0.45 0.03 0.45
CM7 0.05 0.25 0.45
CM8 0.45 0.25 0.45
CM5.1 0.05 0.03 0.45
CM5.2 0.05 0.03 0.45
CM5.3 0.05 0.03 0.45
CM5.4 0.05 0.03 0.45
CM5.5 0.05 0.03 0.45
The concentration linear ranges established for these ion metals in the visible region were found previously by Saldanha et al. [40] and were used in this work. The concentrations of each metal are con-verted in switching on time of the valves and their values are corrected in agreement with the respective
channels low-rates. This correction is based on the measure of the volumetric ratios (see Section 2.3.1).
Table 2. Calibration mixtures valve timings (s).
Calibration Mixtures Cu2+ Mn2+ Zn2+
CM1 1.03 1.02 1.10
CM2 9.27 1.02 1.10
CM3 1.03 8.48 1.10
CM4 9.27 8.48 1.10
CM5 1.03 1.02 9.86
CM6 9.27 1.02 9.86
CM7 1.03 8.48 9.86
CM8 9.27 8.48 9.86
CM5.1 1.03 1.02 9.86
CM5.2 1.03 1.02 9.86
CM5.3 1.03 1.02 9.86
CM5.4 1.03 1.02 9.86
CM5.5 1.03 1.02 9.86
Test Mixtures
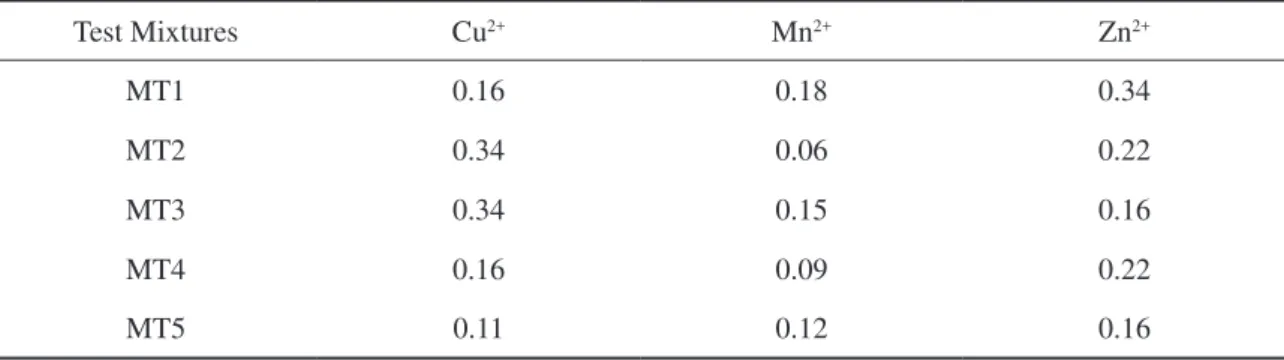
The test mixtures set used for validation of the model were built according to the procedure used
by Saldanha et al. [40] within the concentration range of the calibration set. The ive resulting combina -tions to be used are shown in Table 3.
Table 3. Metal concentrations in the test mixtures set (mg L-1).
Test Mixtures Cu2+ Mn2+ Zn2+
MT1 0.16 0.18 0.34
MT2 0.34 0.06 0.22
MT3 0.34 0.15 0.16
MT4 0.16 0.09 0.22
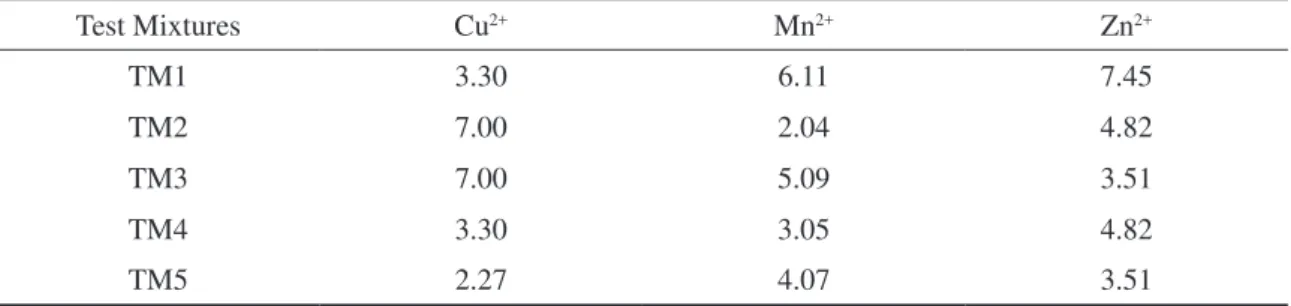
Table 4 presents the corrected valve timings for the mixture test set.
Table 4. Metal valve timings in the test mixtures set (s).
Test Mixtures Cu2+ Mn2+ Zn2+
TM1 3.30 6.11 7.45
TM2 7.00 2.04 4.82
TM3 7.00 5.09 3.51
TM4 3.30 3.05 4.82
TM5 2.27 4.07 3.51
RESULTS AND DISCUSSION
The FBA-SMA was applied to the determination of Cu2+, Mn2+ and Zn2+ in polyminerals and
polivitaminic drugs in a pre-selected spectral range [40], from 470 to 530 nm. To compare the results obtained by FBA-SMA with those obtained by the FAAS method, it was assumed that the determined metals were present in the samples as sulphates (MSO4.nH2O), which is more stable [41] according to the vademecum of the drugs.
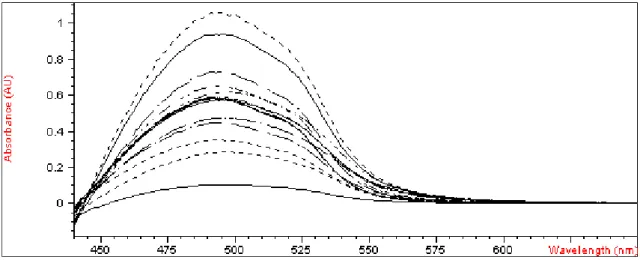
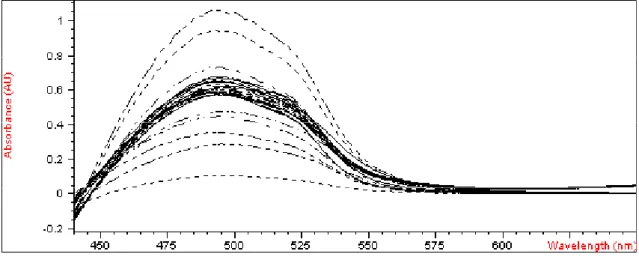
Starting from the spectra data and using the matrix of calibration, a PLS model was built to predict the concentrations of the metals. Figures 2 to 4 show spectra of the calibration mixtures, test mixtures and actual samples.
Figure 3. Absorption Spectra of the actual samples in the spectral band from 440 to 700 nm.
Figure 4. Overlapping of all spectra from 440 to 700 nm band
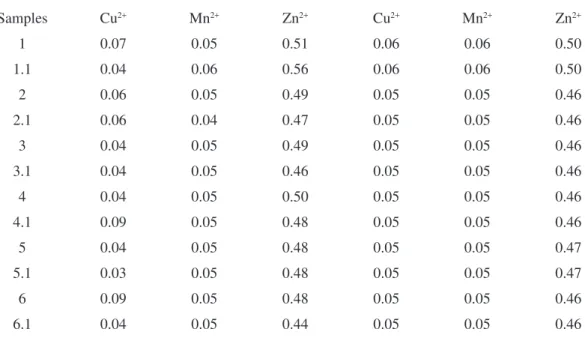
Table 5. Metal concentrations (mg L-1) in the real samples by using the FBA-SMA and reference method.
FBA-SMA (PLS) Reference Method
Samples Cu2+ Mn2+ Zn2+ Cu2+ Mn2+ Zn2+
1 0.07 0.05 0.51 0.06 0.06 0.50
1.1 0.04 0.06 0.56 0.06 0.06 0.50
2 0.06 0.05 0.49 0.05 0.05 0.46
2.1 0.06 0.04 0.47 0.05 0.05 0.46
3 0.04 0.05 0.49 0.05 0.05 0.46
3.1 0.04 0.05 0.46 0.05 0.05 0.46
4 0.04 0.05 0.50 0.05 0.05 0.46
4.1 0.09 0.05 0.48 0.05 0.05 0.46
5 0.04 0.05 0.48 0.05 0.05 0.47
5.1 0.03 0.05 0.48 0.05 0.05 0.47
6 0.09 0.05 0.48 0.05 0.05 0.46
6.1 0.04 0.05 0.44 0.05 0.05 0.46
To accomplish the analyses of the actual samples after the calibration stage, the time
con-igurations for valves switching were: 1.2 s for
sample, 1.0 s for PAR reagent and 37.8 s for buffer solution. The homogenization time of the mixture was always 10.0 s and the time necessary to the mixture reach the detector was 15.0 s. The mea-surements of the analytic signals have requested a time of 5.0 s. The total time required by FBA-SMA to obtain the analytical signals was about 190 s, providing a sample throughput of appro-ximately 19 h-1. The time spent to carry out the
cleaning step (about 120 s) and the multivariate calibration calculations were not considered in this evaluation.
CONCLUSIONS
An automatic system for simultaneous multicomponent analysis by UV-VIS spectropho-tometry was developed. Using FBA-SMA and multivariate calibration analysis was possible determine simultaneously Cu2+, Mn2+ and Zn2+ in
real samples of pharmaceutical formulations was possible.
As well as other low-batch systems, the FBA-SMA presents the advantage of the lexibi -lity in the preparation of the calibration and test mixtures. The time necessary for preparation and measurement of the standard mixtures is about four hours, while the manual preparation consu-mes at least 24 hours. Allied to analytical veloci-ty, other characteristics of the FBA-SMA are also advantageous such as low reagent and sample consumption and good accuracy. Besides, in
com-parison with the reference method, it is veriied
that, applying the FBA-SMA it is possible to carry out a simultaneous multicomponent determination using a single spectrum per sample, while in the reference method, one analyte is determined at once increasing the time and costs for analysis. Still attempting to the analytical costs, the price of the instrument used is very smaller than the equi-pments used in other methodologies that employs
MAS as plasma emission and ray-X luorescence
Acknowledgements
The authors are grateful to the research fellowships granted by the Brazilian agencies CNPq and CAPES.
Received August 18 2008 Accepted October 13 2009
REFERENCES
[1] I. Varga, A. von Bohlen, R. Klockenkämper, G. Záray, Mi-crochemical Journal, 67 (2000) 265.
[2] Z. Hartyáni, E. Dávid, S. Szabó, V. Szilágyi, T. Horváth, Á. Hargitai Tóth, Microchemical Journal, 67 (2000) 195. [3] C. Jiang, F. He, Spectrochim. Acta 59A (2003) 1321. [4] H. Sun, R. Suo, Anal. Chim. Acta, 509 (2004) 71. [5] H.C. Mehra, W. T. Frankenberger, Talanta, 36 (1989)
889.
[6] A. M. Garcia Rodriguez, A. Garcia de Torres, J. M. Cano Pavon, C. Bosch Ojeda, Talanta, 47 (1998) 463.
[7] H. A. Dantas Filho, E. S. O. N. de Sousa, V. Visani, S. R. R. C de Barros, T. C. B. Saldanha, M. C. U. Araújo, R. K. H. Galvão, J. Braz. Chem. Soc. 16 (2005) 58.
[8] Z. Marczenko, Spectrophotometric Determination of Ele-ments, Sussex: Ellis Horwood, 1976. 643p.
[9] R G. Anderson, R. Nickless, Analyst, 92 (1967) 207. [10] R G. Anderson, R. Nickless,Talanta, 14 (1967) 1221. [11] M. A. Sharaf, D.L. Illman, B.R. Kowalski, Chemome-trics, New York, Wiley, p.332, 1986.
[12] H. Martens, T. Naes, “Multivariate Calibration”, Lon-don: Wiley, 1993. 419p.
[13] W.G. Glen, W.J. Dunn III, D. R. Scott, Tetr. Comp. Me-W.G. Glen, W.J. Dunn III, D. R. Scott, Tetr. Comp. Me-Comp. Me-thod., 2 (1989) 349.
[14] S. Wold, C. Albano, W.J. Dunn Iii, K. Esbensen, S. Hell-berg, E. Johansson, M. Sjostrom, “Food Research and Data Analysis”, London: H. Martens and H. Russwurn Jr., 1983. (Applied Science).
[15] R.R. Meglen, J. Chemom., 5 (1991) 163.
[16] P. Geladi, B.R. Kowalski, Anal. Chim. Acta, 185 (1986) 1.
[17] K. B. Beebe, B. R. Kowalski, Anal. Chem., 59 (1987) 1007.
[18] E. V. Thomas, D.M. Haaland, Anal. Chem., 62 (1990) 1091.
[19] T. Khayamian, A.A. Ensafi, B. Hemmateenejad, Talanta, 49 (1999) 587.
[20] B. J. J. Nevado, J. R. Flores, M. J. V. Llerena, N. R. Fari-ñas, Talanta, 48, (1999) 895.
[21] M. L. Luis, J. M. G. Fraga, F. Jiménez, A. I. Jiménez, J. J. Arias, Talanta, 53 (2001) 761.
[22] H. C. Goicoechea, A. C. Olivieri, A. M. Peña, Anal. Chim. Acta,384 (1999) 95.
[23] M. S. Collado, V. E. Mantovani, H. C. Goicoechea, A. C. Olivieri, Talanta, 52 (2000) 909.
[24] M. S. Boeris, J. M. Luco, R. A. Olsina, J. of Pharm. and Biom. Anal., 24 (2000) 259.
[25] R. S. Honorato, M. C. U. Araújo, R. A. C. Lima, E. A. G. Zagatto, R. A. S. Lapa, J. L. F. Costa Lima, Anal. Chim. Acta, 396 (1999) 91.
[26] R. S. Honorato, J. M. T. Carneiro, E. A. G. Zagatto, Anal. Chim. Acta, 441 (2001) 309.
[27] R. S. Honorato, J. M. T. Carneiro, E. A. G. Zagatto, Fre-senius J. Anal. Chem., 368 (2000) 496.
[28] L. F. Almeida, V. L. Martins, E. C. Silva, P. N. T. Morei-ra, M. C. U. Araújo, J. Braz. Chem. Soc. 14 (2003) 249. [29] L. F. Almeida, V. L. Martins, E. C. Silva, P. N. T. Morei-ra, M. C. U. Araújo, Anal. Chim. Acta, 486 (2003) 143. [30] R. A. C. Lima, S. R. B. Santos, R. S. Costa, G. P. S. Marcone, R. S. Honorato, V. B. Nascimento, M. C. U. Araújo, Anal. Chim. Acta, 518 (2004) 25.
[31] J. E. da Silva, F. A. da Silva, M. F. Pimentel, R. S. Ho-norato, V. L. da Silva, B. S. M. Montenegro, A. N. Araújo, Talanta, 70 (2006) 522.
[32] E. P. Medeiros, E. C. L. Nascimento, A. C. D. Medeiros, J. G. V. Neto, E. C. da Silva, M. C. U. Araújo, Anal. Chim. Acta, 511 (2004) 113.
[33] L. F. Almeida, M. G. R. Vale, M. B. Dessuy, M. M. Silva, R. S. Lima, V. B. Santos, P. H. D. Diniz, M. C. U. Araújo, Talanta, 73 (2007) 906.
[34] M. Grünhut, M. E. Centurión, W. D. Fragoso, L. F. Al-meida, M. C. U. Araújo, B. S. F. Band, Talanta, 75 (2008) 950.
[35] C Pasquini, E. V. Aquino, M. V. Rebouças, F. B. Gonza-ga, Anal. Chim. Acta, 600 (2007) 84
[36] A. J. C. Garcia and B. F. Reis, J. Autom. Meth. and Ma-nag. Chem., 1 (2006) 1
[37] E. V. Aquino, J. J. R. Rohwedder, C. Pasquini, Talanta, 71 (2007) 1288
[38] T. Morita, R.M.V. Assumpção, Manual de Soluções, Re-agentes & Solventes, 2ª Edição, São Paulo, Editora Edgard Blucher, p.381, 1972.
[39] Unscrambler User’s Guide, Versão 6.1, CAMO A/S, Trondheim, 1993.
[40] T. C. B. Saldanha, M. C. U. Araújo, B. B. Neto, H. C. Chame, Anal. Letters, 33 (2000) 1187.