An analysis of the floristic composition and
diversity of Amazonian forests including those
of the Guiana Shield
HANS TER STEEGE*†, DANIEL SABATIER‡, HERNAN CASTELLANOS§, TINDE VAN ANDEL*†, JOOST DUIVENVOORDEN#, ALEXANDRE ADALARDO DE OLIVEIRA¶, RENSKE EK*†, RAMESH LILWAH†**, PAUL MAAS* and SCOTT MORI††
*Department of Plant Ecology, Utrecht University, PO Box 80084, 3504 TB Utrecht, The
Netherlands([email protected])
†The Tropenbos Guyana Programme, 12E Garnett Street, Campbellville, Georgetown,
Guyana
‡ORSTOM, Laboratoire Botanique, 163 Rue A. Broussonet, 34000 Montpellier, France
§Universidad Nacional Experimental de Guayana, Calle Chile, Urbaniz Chilemex, Puerto
Ordaz, Edo. Bolı´var, Venezuela
#Hugo de Vries laboratory, University of Amsterdam, Kruislaan 318, 1098 SM
Amster-dam, The Netherlands
¶Universidade Paulista, Lab. Botaˆnica, Av. Paulista 900 1o andar., Sa
˜o Paulo-SP, 01310-100, Brazil
**National Agricultural Research Institute, Mon Repos, ECD, Guyana
††Institute of Systematic Botany, The New York Botanical Garden, Bronx, New York
10458-5126 USA (Accepted 9th April 2000)
ABSTRACT. A large number of newly published and unpublished hectare plots in Amazonia and the Guiana Shield area allow an analysis of family composition and testing of hypotheses concerning alpha-diversity in the south American rain forest. Using data from 94 plots the family-level floristic patterns in wet tropical South America are described. To test diversity patterns, 268 plots are used in this large area. Contrary to a widely held belief, western Amazonian plots are not necessarily the most diverse. Several central Amazonian plots have equal or even higher tree diversity. Annual rainfall is not a good estimator for tree diversity in the Amazonia area and Guiana shield. Plots in the Guiana Shield area (and eastern Amazonia) usually have lower diversity than those in central or western Amazonia. It is argued that this is not because of low rainfall or low nutrient status of the soil but because of the small area of the relatively isolated rain forest area in eastern Amazonia and the Guiana Shield. The low diversity on nutrient-poor white sand soils in the
Amazon basin is not necessarily due to their low nutrient status but is, at least partly, caused by their small extent and fragmented nature.
KEY WORDS: Amazonia, floristic composition, Guiana Shield, rainfall, tree alpha diversity
I N T R O D U C T I O N
Neotropical rain forests have been considered the most species-rich forests that exist worldwide (Gentry 1988a, 1988b; Valencia et al. 1994). Very high alpha-diversities of trees, birds, butterflies, reptiles, amphibians and mammals (Gentry 1988a, and references therein) suggest that in particular western Amazonia has an almost unrivalled species diversity. Forests in the east of Amazonia and especially the Guianas are characterized by lower diversity when compared to western Amazonia, both in plants (ter Steege 1998a) and mam-mals (Kayet al. 1997, Voss & Emmons 1996). In terms of plant families, Bomba-caceae, Meliaceae and Moraceae are richer in species in western Amazonia while Chrysobalanaceae and Lecythidaceae are relatively richer in species in the eastern Amazonia and the Guianas (Gentry 1990, Ek & ter Steege 1998). However, while some general patterns have been described, a comparison of tree species composition and tree diversity between Amazonia and the Guiana Shield has never been attempted. Below we briefly summarize the state of knowledge at present.
Floristic patterns
Diversity patterns
Until now most studies examining the patterns of plant diversity in the neotropics have also relied heavily on plots in western Amazonia (Clinebellet al. 1995, Gentry 1988a,b; Givnish 1999, Phillips et al. 1994). In western Amazonia, species richness is strongly correlated with total annual rainfall (Gentry 1988a,b), which is often considered a proximate estimate of ecosystem productivity (Clinebellet al. 1995, Gentry 1988a, b; Phillipset al. 1994). Rainfall shows a stronger correlation with species richness than do soil fertility and soil toxicity factors (Clinebellet al. 1995). Givnish (1999) argued that by favouring natural enemies of plants (fungi and insects), higher rainfall would promote more density dependent mortality and hence higher diversity. Other studies have confirmed the rainfall–diversity correlation (Hall 1980, 1994; Huston & Swaine 1976). In each of these studies fertility was negatively correlated with rainfall, complicating the search for single causal relationships. But the signals are also confusing. Phillips et al. (1994) did not find a strong link between rainfall and diversity, allegedly, because they did not include the climatic extremes (Clinebellet al. 1995). Because probably 90% of the neotropical rain forests do not occur near ‘climatic extremes’, it appears that the model, as proposed by Clinebellet al. (1995), in which annual rainfall and periodicity are the most important factors, may not be sufficient in predicting species diversity over major areas of Amazonia (as will be further shown below).
Habitat diversity contributes significantly to regional species diversity. Spe-cies may differentiate along topographical differences and soil types (Guianas: e.g. Sabatier et al. 1997, Schulz 1960, ter Steegeet al. 1993, ter Steege 1998a; W. Amazonia: e.g. Duivenvoorden & Lips 1995, 1998; Tuomisto & Ruokolainen 1997, Tuomistoet al. 1995).
Historical events are also considered to have had a large influence on divers-ity. As an example, Pleistocene fluctuations may have led to contracting and expanding rain forests and through isolation of tree populations have contrib-uted to speciation (Prance 1982, for recent reviews see Bush 1994, Haffer 1997). However, such hypotheses are notoriously difficult to test and often lead to circular reasoning (Tuomisto & Ruokolainen 1997) and in fact may have been based on collector artefacts (Nelsonet al. 1990). Other evidence suggests that many of the present-day species may have evolved before the Pleistocene climate changes (see examples in Bush 1994, Kayet al. 1997).
The Guiana Shield
The number of floristic plots in the Guiana Shield area has risen steadily over the years and, combined with the relatively well-known flora, this has led to high quality data (Comiskeyet al. 1994, Ek 1997, Johnston & Gillman 1995, Maas 1971, Sabatier 1990, D. Sabatier & M.F. Pre´vost, unpubl. data, T. van Andel, unpubl. data). The forest is generally species-poor (ter Steege 1998a) over the full rainfall range (2000–5000 mm y−1
species-poor forests, and several new plots from central and eastern Amazonia, occurring under rainfall regimes similar to the older studies in an analysis of species composition and diversity may greatly increase our understanding of causes of diversity in the Amazon.
In the present paper we examine whether the rainfall-diversity hypothesis is capable of explaining woody species diversity in a dataset that includes the forests of the Guiana Shield and eastern Amazonia. We also present an analysis of family-level floristic composition, comparing the Guianan forest block with that of central and western Amazonia. From the large-scale patterns some smaller-scale patterns follow. To carry out these analyses we lent heavily on previously published material but many plots are from previously unpublished data.
M E T H O D S
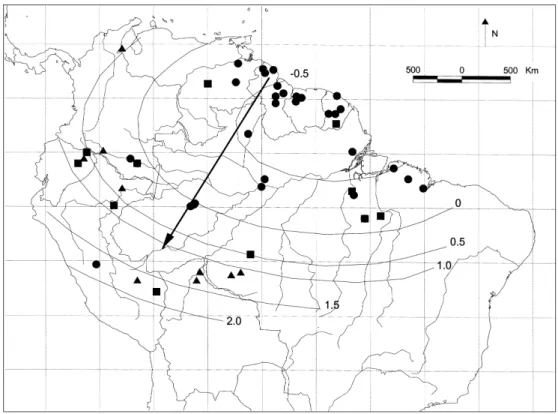
Our analysis focuses on family-level floristic composition and diversity of 268 forest plots that are well distributed over Amazonia and the adjacent Guiana Shield (Figures 1, 3). However, the same information was not available for all
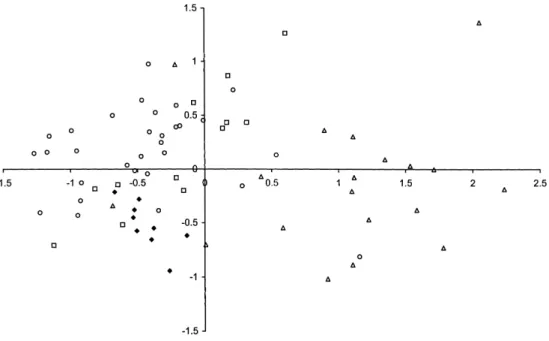
Figure 2. Ordination by multidimensional scaling of 70 Amazonian terra firme (TF) plots on the basis of their similarity in numbers of individuals in 16 major plant families. Similarity was calculated with correla-tion coefficients. Symbols:R, central Amazonia, l, eastern Amazonia; p, Guiana Shield; m, western Amazonia and Rondoˆnia.
plots thus the floristic analyses and diversity analyses were carried out on dif-ferent subsets of the data.
Floristic composition
Less than half of the plots have floristic information in the form of the number of individuals by species or only by family. To avoid over-representation of certain sites, the number of plots per forest type (TF, terra firme; FL, floodplain; PZ, podzol; SW, swamp; DF, dry forest) was reduced to two per site. In this case we selected the site with the lowest diversity (highest dominance) and the highest diversity (lowest dominance). While strictly speaking this may be considered pseudo-replication, plots closer to each will in principle be more similar to each other due to spatial auto-correlation (and they should also be closer on a gradient when ordinated). We tested for spatial auto-correlation with Variowin 2.21 (Pannatier 1996) and with Spatialstats (S-PLUS 2000, Mathsoft Inc.).
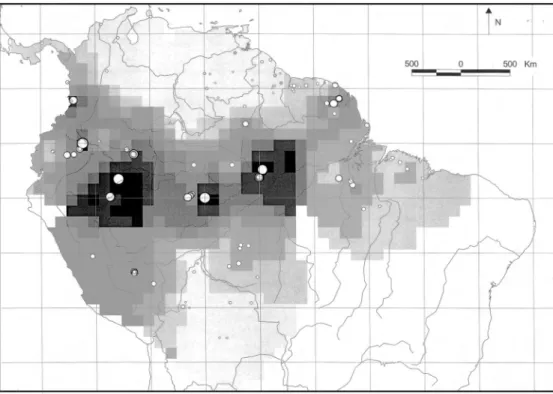
Figure 3. Location of Amazonian terra firme (TF) plots used in the analysis of tree alpha-diversity. Dot size indicates the value of Fisher’s alpha (in case of overlap only the highest may be visible). Grey-scales indicate interpolated values of Fisher’s alpha (with interdistance weighting up to 500 km).
abundantly present families, which amounted to 65–96% of all individuals on the plots (Terborgh & Andresen 1998) dominated the analysis, and, not unim-portantly, neotropical rain forests.
To make the other plots comparable to the first set we used the same criteria as Terborgh & Andresen (1998): a plot size ofO1 ha and only trees with DBH O 10 cm were used. Such plots capture a fair amount of the local diversity (Laurance et al. 1998, but see Condit et al. 1998). The plots were truncated to 450 trees by randomly selecting 450 individuals and assigning these to their respective families (note that only the 16 families mentioned were used for the ordinations below). We made a few exceptions to include plots of areas where no other data were available:
(i) Three plots with fewer individuals: San Pedro, Venezuela, 443 individuals (Finol Urdaneto undated); Haut Camopi, French Guiana, 435 individuals (Sabatier & Prevost 1987); and Jaru, Rondoˆnia, 442 individuals (Absyet al. 1987).
(iii) Two plots were based on plotless tree samples along a line (within one forest type) rather than on a 1-ha plot basis (Mori & Boom 1987, Moriet al. 1989). In this case the first 450 trees sampled were used.
Species and genus information was not used in the analysis. This is an ob-vious drawback as evolution and competition take place at this level rather than at the family level. However, as Terborgh & Andresen (1998) pointed out, the data at species and genus level contains too much noise to produce interpretable results.
We recognized four main ‘forest types’: forests on ultisols and oxisols, so called ‘terra firme’ forest (TF); forests on floodplains (FL); forests on white sand podzols or spodosols (PZ); and swamp forests (SW). Initially, the plots were assigned to eight regions: western Amazonia (WA), Rondoˆnia (RO), cent-ral Amazonia (CA), eastern Amazonia (EA), Guiana Shield (GS), Choco´, Cent-ral America, Atlantic Brazil.
Swamp plots (n =2) were not included in the multivariate floristic analyses (see Terborgh & Andresen 1998). Because the floras from the Choco´ area, Central America and the Atlantic forest are relatively separated geographically from the main large Amazonian forest mass and because we had only a few plots in them, we also omitted the plots from these areas from the final ana-lysis. The Rondoˆnia plots resembled western Amazonian plots most closely, and because of their geographical proximity, were added to WA.
The remaining data (94 plots) were analysed with principal component ana-lysis and detrended correspondence anaana-lysis (MVSP 3.01, Kovach Computing Services) on the basis of the 16 major plant families. We also compared the results of these ordinations with multidimensional scaling (with both a correla-tion matrix and Euclidean distance matrix as input, Statistica 4.5, Statsoft, Inc.) and chose the ordination that best separated the data spatially.
We also analysed the data of the TF plots (n = 70) and FL plots (n = 24) separately.
Diversity patterns
Almost all plots (n = 258) have information on the number of individuals and number of species, which were used for the calculation of alpha-diversity (Appendix 1, Figure 3). Many of these plots were gathered from the literature but again a substantial portion of these plots comes from our own work.
the dry (deciduous) forest plots in Venezuela and Bolivia. Differences between regions and forests were analysed with ANOVA, post-hoc comparisons were carried out with Scheffe´’s tests. We tested for spatial auto-correlation with Variowin 2.21 (Pannatier 1996) and Spatialstats (S-PLUS 2000, Mathsoft Inc.).
Productivity
For just a few sites in the neotropics net primary productivity has been estimated on the basis of field measurements—San Carlos de Rio Negro and Reserva Ducke (Raichet al. 1991). We use one proxy estimate for productivity, rainfall (e.g. Clinebellet al. 1995, Gentry 1988a, b; Phillips et al. 1994), which shows good correlation with modelled net primary productivity (Raich et al. 1991). We analysed the relationship between alpha-diversity and rainfall for the complete data set (including low rainfall plots) and various subsets, based on region, edaphic condition and major soil type with regression analysis.
Maps were created with Arcview 3.1 (ESRI Inc.).
R E S U L T S Floristic patterns
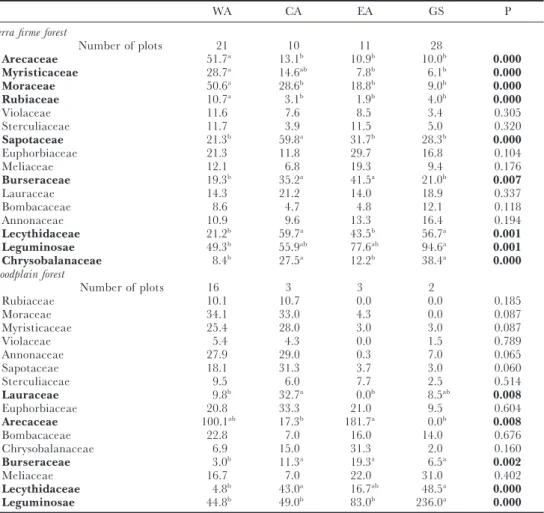
The 16 families considered in the analyses made up 79% of the tree popula-tions in the Amazonia, if we assume the plots to be representative for the area. Leguminosae dominate the neotropical forests. On average 16% of all individuals on the plots were Leguminosae (Table 1).
In half of the forest regions and forest types Leguminosae is the most abund-ant family (Table 1). Leguminosae are especially abundabund-ant in the Guianas in floodplain forests (Table 1) and forests on white sand podzols (an average of 164 ind. in three 450-tree samples), and in fact, in the Guiana Shield in general (Table 1). Over the whole area considered, the abundance of Leguminosae is twice as high as those of the next two most abundant families – Arecaceae and Lecythidaceae, with 9% and 8% respectively. These data also show that just three families amount to nearly one-third of all trees in Amazonia. In forests on white sand podzols in the Guiana Shield (n=3), Leguminosae and Bomba-caceae are very abundant (163–165 and 72–130 individuals in 450-tree samples respectively). Arecaceae and Moraceae are most abundant in the terra firme forest of WA, as are Myristicaceae and Rubiaceae. Sapotaceae are most abund-antly found in CA and Burseraceae in both CA and EA. Lecythidaceae and Chrysobalanaceae are most abundant in CA and GS. Arecaceae dominate the floodplain forests in both WA and EA (Table 1) and also the swamp forests in WA (data not shown) and GS (van Andel, unpubl. data).
Table 1. Average number of individuals of 16 major tree families in random samples of 450 trees on small plots in terra firme plots in four Amazonian regions. Abbreviations: WA, western Amazonia; CA, central Amazonia; EA, eastern Amazonia; GS, Guiana Shield. The families have been ordered according to their abundance from WA to GS. Differences in the superscript following the abundance indicate significant differences between regions. P indicates the level of significance as tested with one way ANOVA. Families that show a significant difference between regions are in bold.
WA CA EA GS P
Terra firme forest
Number of plots 21 10 11 28
Arecaceae 51.7a 13.1b 10.9b 10.0b 0.000
Myristicaceae 28.7a 14.6ab 7.8b 6.1b 0.000
Moraceae 50.6a 28.6b 18.8b 9.0b 0.000
Rubiaceae 10.7a 3.1b 1.9b 4.0b 0.000
Violaceae 11.6 7.6 8.5 3.4 0.305
Sterculiaceae 11.7 3.9 11.5 5.0 0.320
Sapotaceae 21.3b 59.8a 31.7b 28.3b 0.000
Euphorbiaceae 21.3 11.8 29.7 16.8 0.104
Meliaceae 12.1 6.8 19.3 9.4 0.176
Burseraceae 19.3b 35.2a 41.5a 21.0b 0.007
Lauraceae 14.3 21.2 14.0 18.9 0.337
Bombacaceae 8.6 4.7 4.8 12.1 0.118
Annonaceae 10.9 9.6 13.3 16.4 0.194
Lecythidaceae 21.2b 59.7a 43.5b 56.7a 0.001
Leguminosae 49.3b 55.9ab 77.6ab 94.6a 0.001
Chrysobalanaceae 8.4b 27.5a 12.2b 38.4a 0.000 Floodplain forest
Number of plots 16 3 3 2
Rubiaceae 10.1 10.7 0.0 0.0 0.185
Moraceae 34.1 33.0 4.3 0.0 0.087
Myristicaceae 25.4 28.0 3.0 3.0 0.087
Violaceae 5.4 4.3 0.0 1.5 0.789
Annonaceae 27.9 29.0 0.3 7.0 0.065
Sapotaceae 18.1 31.3 3.7 3.0 0.060
Sterculiaceae 9.5 6.0 7.7 2.5 0.514
Lauraceae 9.8b 32.7a 0.0b 8.5ab 0.008
Euphorbiaceae 20.8 33.3 21.0 9.5 0.604
Arecaceae 100.1ab 17.3b 181.7a 0.0b 0.008
Bombacaceae 22.8 7.0 16.0 14.0 0.676
Chrysobalanaceae 6.9 15.0 31.3 2.0 0.160
Burseraceae 3.0b 11.3a 19.3a 6.5a 0.002
Meliaceae 16.7 7.0 22.0 31.0 0.402
Lecythidaceae 4.8b 43.0a 16.7ab 48.5a 0.000
Leguminosae 44.8b 49.0b 83.0b 236.0a 0.000
(Figure 1). The quadratic model shows anisotropy caused by the fact that the plots on the edge of western Amazonia and the Guiana Shield are more similar to the plots in the Guianas than the plots in Peru. Auto-correlation analysis of MDS plot scores results in an exponential variogram (r = 0.81, P < 0.01), suggesting that none of the plots are really spatially independent (no matter the distance) but rather are ordered on a gradient.
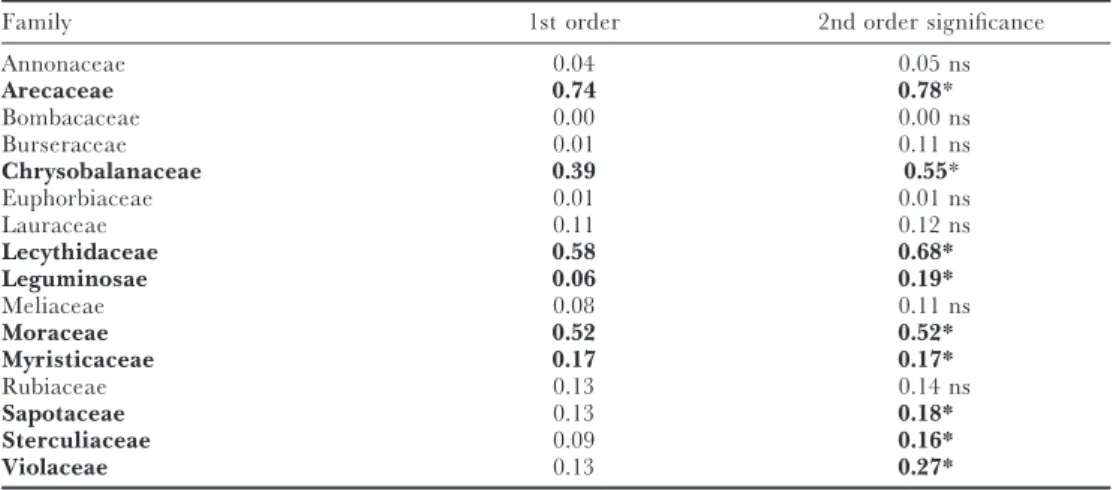
Families that show the strongest correlation with MDS axis 1 are (Table 2): Arecaceae, Myristicaceae and Moraceae, increasing in abundance from the Guianas towards western Amazonia, and Chrysobalanaceae and Lecythidaceae increasing towards the Guianas. Sapotaceae show an optimum in CA indicated by only a significant 2nd order polynomial. Sterculiaceae and Violaceae show highest abundance at the two ends of the gradient but the significance is mainly caused by one point with very high abundance.
The gradient for the 24 FL plots was less ‘method-independent’ (r: DCA– N-MPCA −0.612; DCA–MDS 0.891). However, the explained variance (DCA) was still 41% for the first two axes together. Arecaceae, Lecythidaceae and Leguminosae had strongest correlation with the first axis. Because all FL plots in EA were also strongly dominated by Arecaceae, WA and EA plots were always close together in the bi-plots.
Diversity patterns
The range found in Fisher’s alpha (in the complete data-set) was quite large – from 3.6 (GS: N (no. of individuals) = 395, S (no. of species)= 17) to 221.8 (CA: N = 769, S = 322). Plots with very high alpha-diversity (Fisher’s alpha > 200) are found in a wide area from western to central Amazonia (Figure 3). These plots include the hyper-diverse plots in Peru (Gentry 1988a)
Table 2. Coefficients of determination (r2) of a multiple regression of the scores of plots on the first axis of
the multidimensional scaling and family abundance on these 70 TF plots in Amazonia and the Guiana Shield area. Significant regressions (with Bonferroni correction) are given in bold. With four families the 2nd order polynomial is necessary to describe the relationship between axis and abundance well. Sapotaceae and Leguminosae show an optimum in the centre-axis scores, Sterculiaceae and Violaceae a minimum.
Family 1st order 2nd order significance
Annonaceae 0.04 0.05 ns
Arecaceae 0.74 0.78*
Bombacaceae 0.00 0.00 ns
Burseraceae 0.01 0.11 ns
Chrysobalanaceae 0.39 0.55*
Euphorbiaceae 0.01 0.01 ns
Lauraceae 0.11 0.12 ns
Lecythidaceae 0.58 0.68*
Leguminosae 0.06 0.19*
Meliaceae 0.08 0.11 ns
Moraceae 0.52 0.52*
Myristicaceae 0.17 0.17*
Rubiaceae 0.13 0.14 ns
Sapotaceae 0.13 0.18*
Sterculiaceae 0.09 0.16*
and Ecuador (Valenciaet al. 1994) but also in Brazil (Amaral 1996, Oliviera & Mori 1999). Most plots in eastern Amazonia, the Guianas and other areas have much lower diversity, except for some plots in the Choco´ (Faber-Langendoen & Gentry 1991) and French Guiana (Mori & Boom 1987). The variogram con-structed for alpha-diversity of TF plots suggests autocorrelation up to 300– 500 km but contains a substantial amount of noise at larger distances. For interpolation of TF diversity an interdistance-weighting up to 500 km is used in Figure 3.
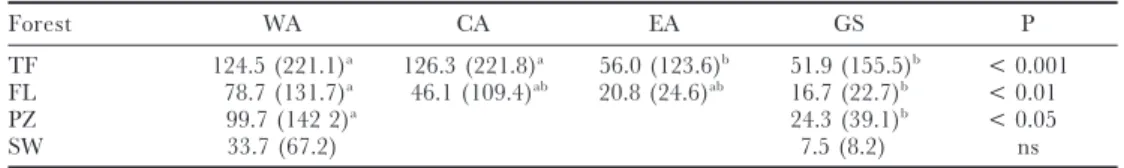
Both region (WA+RO, CA, EA, GS) and forest type (only FL and TF tested) had a significant effect on Fisher’s alpha (Regions: F[3,137] = 12.23, P < 0.001; Forest type: F[1,137] =23.24, P << 0.001; No interaction: F[1,137] =1.45, P=0.23) when tested together for the core Amazonian plots (8°S–8°N, rainfallO2000 mm y−1). Average alpha-diversity is highest in central Amazonia followed closely by western Amazonia (Table 3). The most diverse floodplain forests are found, on average, in western Amazonia. The plots on the Guiana Shield and eastern Amazonia have low diversities for terra firme and floodplain forest, as well as forest on white sand podzols and in swamps (as compared to WA and CA). Post-hoc comparison (Scheffe´’s test) shows that in terms of alpha-diversity there are two regions. CA and WA plots are not significantly different from each other and neither are EA and GS plots. Between the CA–WA on one hand and EA–GS on the other all combinations are significantly different. Thus, EA and GS plots have significantly lower diversity than WA and CA plots.
TF plots have significantly higher diversity than FL plots in all regions. Swamp plots appear to have lowest diversity, while white sand podzols have higher diversity than floodplains. Neither were tested statistically because of their low numbers.
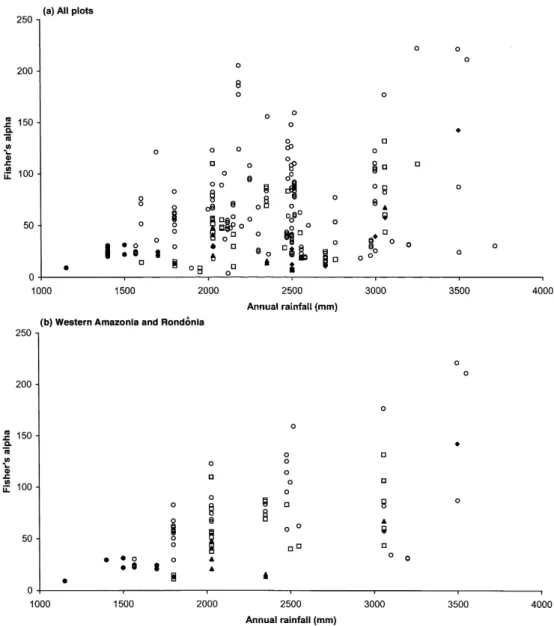
The overall relationship between rainfall (complete range) and diversity (all plots in WA+RO, CA, EA and GS) was very weak (Figure 4a). Rainfall explained c. 8% of the variation in Fisher’s alpha (r = 0.279, df = 241, P < 0.001). Two very rich plots in WA have a large influence on the correlation outcome and show very high Cook’s distances (0.14, 0.15 vs. an average of 0.05) and can be considered as statistical outliers. But even with omission of four plots with Fisher’s alpha > 200, the influence of rainfall is still significant (r=
Table 3. Average alpha-diversity for 1-ha plots in core Amazonian rain forest (8°S–8°N, annual rainfallO 2000 mm). Abbreviations: GS, Guiana Shield; EA, eastern Amazonia; CA, central Amazonia; WA, western Amazonia; TF, terra firme; FL, floodplain forest; PZ, forest on white sand podzols; SW, swamp forest. Max-imum Fisher’s-alpha per forest per region in parentheses. Superscripts indicate differences in average Fisher’s-alpha between the regions as tested with Scheffe´’s post-hoc test (P < 0.05); P indicates significance for single-way ANOVA per forest type.
Forest WA CA EA GS P
TF 124.5 (221.1)a 126.3 (221.8)a 56.0 (123.6)b 51.9 (155.5)b < 0.001
FL 78.7 (131.7)a 46.1 (109.4)ab 20.8 (24.6)ab 16.7 (22.7)b < 0.01
PZ 99.7 (142 2)a 24.3 (39.1)b < 0.05
Figure 4. The relationship between annual rainfall (mm y−1) and Fisher’s alpha for (a) all plots in western,
central, eastern Amazonia and the Guiana Shield, (b) plots in western Amazonia and Rondoˆnia, (c) central Amazonia, (d) eastern Amazonia, (e) Guiana Shield. Symbols:p, terra firme;l, floodplain;R, podzol;M, swamp;P, dry forest.
0.211, df=237, P < 0.01). Both for TF and FL plots rainfall shows a significant correlation with Fisher’s alpha (r = 0.244, df = 172, P < 0.01; r = 0.445, df = 37, P < 0.01). In the case of TF plots the relationship is no longer significant when the plots with annual rainfall < 2000 mm (in the dry regions of Bolivia and Venezuela) are removed (r=0.041, df=138, P > 0.05).
the TF plots (r= 0.568, df=42, P < 0.01) even when the two outlier plots are removed (r=0.391, df=40, P < 0.05). There is no significant correlation when only plots with rainfallO2000 mm are used (r =0.305, df=27, P > 0.05).
In CA (Figure 4c) there is no significant correlation between rain and Fisher’s alpha, when all plots or TF plots are analysed. There is a significant correlation for the FL plots but this is caused by only one datum point and is considered doubtful. There is no significant relationship between rainfall and Fisher’s alpha in EA for all plots, TF plots or FL plots (Figure 4d).
In the GS plots (Figure 4e) there is a small significant correlation (r=0.257, df=98, P < 0.01) between rainfall and Fisher’s alpha, but not if the dry forest plots (rain < 1500 mm) in Venezuela are removed (r = 0.138, df = 85, P > 0.05). The same is true when TF plots are analysed separately. The GS plots contain one clear outlier, Sau¨l, with a Fisher’s alpha of 155.5. Outliers in terms of rainfall are Rio Caura (3715 mm y−1) and San Carlos (3500 mm y−1), both with very low diversity.
The range in diversity (Fisher’s alpha) within one area can be substantial but is remarkably stable in other areas (Appendix 1). A few examples for terra firme plots: Manaus 123.6–205.1 (n=4); Nouragues 70.9–122.0 (n=8); St Elie 58.9–109.8 (n = 16); Manu Pakitza 55.6 – 122.6 (n = 5); Mabura Hill 8.4– 11.6 (n= 3). Central Guyana shows consistently low figures for alpha-diversity (Appendix 1), with species numbers almost always < 100 ha−1
. Similarly low values are found in Venezuelan Guayana lowland forests. Moving eastwards through Suriname to French Guiana diversity in the Guianas increases stead-ily. The sample with highest diversity in the Guianas is found near Sau¨l, French Guiana with a Fisher’s alpha of 155.5 (Appendix 1).
D I S C U S S I O N
in Guyana, they have highest diversities in central Amazonia (Mori et al. in press).
If rainfall is not a good predictor of large-scale patterns in alpha-diversity in Amazonia, what is? We briefly discuss four possible causes, specifically compar-ing the Guiana Shield area with central and western Amazonia.
Primary productivity
Primary productivity is thought to have an important influence on species richness (e.g. Huston 1994, Rosenzweig 1995) and Phillipset al. (1994) found that the most productive sites in western Amazonia did indeed have highest species diversity. A higher turnover, leading to escape from competitive conclu-sion could be the mechanism (Huston 1994, Phillipset al. 1994). Unfortunately, rainfall, seasonality, temperature and soil quality may all independently affect productivity.
Large-scale differences in NPP, between WA, CA and GS appear to be non-existent (see Raichet al. 1991). Most soils in the Amazon basin are poor, rain-fall ranges and temperatures are similar. However, the NPP as calculated by Raichet al. (1991) is based upon the FAO soil map of the world, which greatly underestimates the presence of ultisols in the western Amazon, which are all classified as oxisols (Richter & Babbar 1991). Based on the data we have, we cannot conclude that differences in productivity are the cause of differences in the large-scale diversity patterns over Amazonia.
Rainfall, as a proxy estimate for productivity, has been found to correlate strongly with diversity (Clinebell et al. 1995). We find rainfall to be a poor estimator for tree alpha-diversity, especially when only plots with rainfall O2000 mm are taken into account, which would include most plots with rain forest. There is a difference in tree alpha-diversity between forests with very low rainfall, dry forests, and the forests with higher rainfall, rain forests. How-ever, considering only rain forests, we cannot agree with Clinebellet al. (1995) that ‘Wet forests with an ample year-round moisture harbour the greatest number of woody plant species and should be a focus of conservation efforts’. Forest in central Amazonia with lower annual, more seasonal, precipitation, such as around Manaus can be just as species-rich as the aseasonal very wet forests of western Amazonia, and possibly several areas in between (Figure 3). On the other hand under a similarly large range in rainfall, tree alpha-diversity in the Guianas is consistently lower than that of CA or WA. In addition to that, such a simple model easily leads to overemphasis of just one measure of diversity as a tool for preservation and neglects phytogeographic differences and patterns of endemism (see below).
Ecosystem dynamics
reported from forests with higher diversity (Phillips et al. 1994). But more recently such high diversities have also been reported from forests with very low dynamics (Oliviera 1997, Rankin-de Meronaet al. 1990). Some community characteristics, related to shade tolerance such as an average large seed size (Hammond & Brown 1995) have been put forward as evidence that the Guianas suffer less large-scale disturbances than WA. Also within Guyana a decline in alpha-diversity is correlated with an increase in average community seed size and wood density, and a decrease in pioneers (H. ter Steege & D. S. Hammond, unpubl. data). This gradient in diversity has also been interpreted as a gradient in disturbance, possibly related to prehistoric Amerindian activities (H. ter Steege & D. S. Hammond, unpubl. data). If higher turnover should also lead to shorter generation periods this could also affect diversity at longer (evolutionary) time scales (Rohde 1992). Marzluff & Dial (1991) indeed found that short generation time (and the ability to colonize new resources) was associated with higher diversity.
Area
Area probably holds more influence over the origin and maintenance of diversity at large and small scales than currently appreciated. It may, for example, be largely responsible for the latitudinal gradient (Rosenzweig 1995, Terborgh 1973). Larger areas should have more species for four reasons – two pertaining to speciation rates and two pertaining to extinction rates (Rosenzweig 1995). Speciation rates in larger areas are higher because (a) larger areas are more likely to contain geographical barriers, important for allopatric speciation and (b) species with larger ranges have more genetic vari-ation and seem to evolve faster. Extinction rates in large areas/populvari-ations are lower because (c) larger ranges lead to larger populations that are less likely to go extinct due to random population fluctuations and (d) larger ranges encompass more niche refugia, where populations may reside when large changes (e.g. climatic) occur.
Amazonia and the Guiana Shield on one hand and central and western Amazonia on the other hand.
Area may also help to explain why certain forest types are richer than others. Obvious conclusions sometimes force themselves upon us. We generally believe that floodplains and mangroves are poor places to live with severe physiological constraints imposed by perpetual waterlogging and regular submersion by the seawater, allegedly limiting the pool of species that can grow (e.g. Clinebellet al. 1995). But is this true? Mangroves and floodplains are also fringe habitats, small in area and heavily fragmented. Could this contribute to their low species richness? Thinking long-term and large-scale, most likely it does (Rosenzweig 1995, Terborgh 1973 and see above arguments). We would be surprised that, if mangroves covered an area the size of Amazonia, they would be as poor in species as they are now. In fact, where mangroves are more extensive (the Pacific) they are indeed much richer in species (Tomlinson 1986).
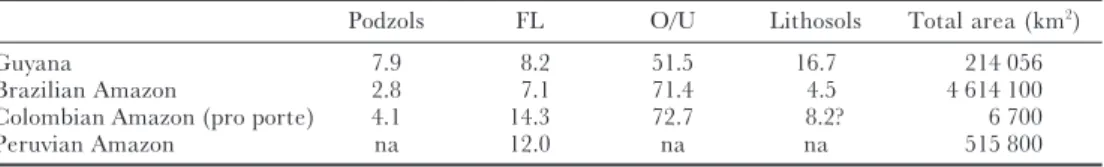
In the light of the above, it should not be surprising that the forest that covers most of the ‘typical soils’ of Amazonia (ultisols and oxisols) is also the richest, not only in CA and WA but also within the Guianan area. Floodplain forests, swamps and forests on white sands are much smaller in extent (Table 4) and more fragmented and for reasons stated above that should explain to some extent their lower species richness. White sand podzols cover only 2.8% of the Amazon basin and 7.9% in Guyana (Table 4). Because of obvious ecological differences, they harbour, despite their low species richness, a flora relatively rich in endemics (Huber 1995, Lleras 1997, ter Steege 1998a, ter Steegeet al. 2000). Had the situation been reversed with most of Amazonia being white sand and just a few areas with ultisols/oxisols, undoubtedly the latter would have been far poorer in species (we probably would have attributed this to the ‘obvious’ aluminium toxicity of such soils). Floodplains are more species-rich where they cover larger areas in WA. Within that area they had even far greater extent in historical times (Rosales-Godoyet al. 1999).
Endemics are most often found in small distinct habitats, often fragmented (‘ecological islands’), such as white sand areas, serpentine rock, cloud forests (Gentry 1992, Huber 1995, Lleras 1997, ter Steege 1998a, ter Steege et al. 2000). With the same reasoning mangrove-, floodplain- and swamp-restricted species could be considered ‘ecological endemics’. Because small habitat areas are likely to have fewer species (see above) we expect the relationship between
Table 4. Percentage of soil types in four neotropical areas largely covered with rain forest. Oxisols and ultisols cover the majority of these areas and are particularly extensive in the Brazilian Amazon. (Data: Guyana, Gross-Braun (1965); Brazil, Richter & Babbar (1991); Colombia, Duivenvoorden & Lips (1998); Peru, Saloet al. (1986).)
Podzols FL O/U Lithosols Total area (km2)
Guyana 7.9 8.2 51.5 16.7 214 056
Brazilian Amazon 2.8 7.1 71.4 4.5 4 614 100
Colombian Amazon (pro porte) 4.1 14.3 72.7 8.2? 6 700
endemism and diversity to be negative within a phytogeographic region. Between regions or continents, i.e. areas with a separate evolutionary history, the relationship is undoubtedly positive: the more species the more endemics. Two factors, area and disturbance regime, may be responsible for a large part of the differences in alpha-diversity found between the Guiana Shield area and eastern Amazonia as compared to central and western Amazonia. Very recently a third potential factor was added to this list: the ‘mid-domain effect’ (Colwell & Lees 2000). This model suggests that even without environmental gradients species richness should peak in the centre of a large biogeographic area and is based on the range-size distribution found in species. The causes for gradient in family composition could be both ecological and historical (Terborgh & Andresen 1998). Arecaceae and Moraceae are very abundant and species-rich in western Amazonia but they are not absent in the eastern areas. In several floodplain sites Arecaceae even dominate the forests in EA and the coastal swamps of the Guianas. Similarly, Chrysobalanaceae and Lecythidaceae are not absent from western Amazonia but less abundant. But why are Mora-ceae more abundant and rich in species in WA and are ChrysobalanaMora-ceae, Lecythidaceae and Leguminosae more abundant in GS? We believe that the disturbance regime may be partly responsible (Hammond & Brown 1995; H. ter Steege & D. S. Hammond, unpubl. data). Higher dynamics may allow mem-bers of families with pioneer-like characteristics such as light wood, small seeds, and short generation times (many Moraceae) to dominate over the slower growing species from the dense wooded and large-seeded families (Chrysobalanaceae, Lecythidaceae). In Guyana we found clear patterns of aver-age community seed size, wood density and diversity (H. ter Steege & D. S. Hammond, unpubl. data). At the larger scale, the seed size spectrum of Gui-anan forest is also strikingly different from that of Western Amazonia (Hammond & Brown 1995). Fast growing species tend to have short generation times, which may promote species richness of such taxa (Marzluff & Dial 1991). This may be an additional cause for the high diversity in western Amazonia.
A C K N O W L E D G E M E N T S
We thank all our colleagues who have published materials that we needed so much to carry out the analyses. We hope that this publication will stimulate others to continue the search for causal effects on diversity and floristic pat-terns. We also thank Mark van Nieuwstadt, Rene´ Verburg for discussions and comment, Roderick Zagt, Marinus Werger, Thijs Pons, John Terborgh, Kalle Ruokolainen, David Newbery and two anonymous reviewers for critical and stimulating comments on the manuscript, and Pitman et al. for their unpub-lished manuscript.
L I T E R A T U R E C I T E D
ALMEIDA, S. S., LISBOA, P. L. B. & SILVA, A. S. 1993. Diversidade florı´stica de uma comunidade arbo´rea na estac¸a˜o cientı´fica ‘Ferreira Pena’, em Caxiuana˜ (Para´). Boletim do Museu Paraense Emı´lio Goeldi. Serie Botaˆnica 9:93–128.
AMARAL, I. L. 1996. Diversidade florı´stica em floresta de terra firme, na regia˜o de Urucu – AM. Dissertac¸a˜o de Mestrado, Instituto Nacional de Pesquisas da Amazoˆnia (INPA) /Fundac¸a˜o Universidade do Amazoˆnas (FUA). Manaus.
AYRES, J. M. 1981. Observac¸o˜es sobre a ecologia e o comportamento doc Cuciu´s (Chiropotes satanes e C. satanus). MSc dissertation, INPA, Manaus.
AYRES, J. M. 1993. As matas da Va´rzea do Mamiraua´. MCT-CNPq/ Sociedade Civil Mamiraua´. Brasilia. BALEE, W. 1986. Ana´lise preliminar de inventa´rio florestal e a etnobotaˆnica Ka’apor (Maranha˜o).
Boletim do Museu Paraense Emı´lio Goeldi. Serie Botaˆnica 2:141–167.
BALEE, W. 1987. A entnobotaˆnica quantitativa dos ı´ndios Tembe´ (Rio Gurupi, Para´).Boletim do Museu Paraense Emı´lio Goeldi. Serie Botaˆnica3:29–50.
BALEE, W. & CAMPBELL, D. G. 1990. Evidence for the successional status of liana forest (Xingu river basin, Amazonian Brazil).Biotropica 22:36–47.
BALSLEV, H., LUTEYN, J., OLLGAARD, B. & HOLM-NIELSEN, L. B. 1987. Composition and structure of adjacent unflooded and floodplain forest in Amazonian Ecuador.Opera Botanica92:37–57. BALSLEV, H., VALENCIA, R., PAZ Y MINO, G., CHRISTENSEN, H. & NIELSEN, I. 1998. Species
count of vascular plants in one hectare of humid lowland forest in Amazonian Ecuador. Pp. 585–594 in Dallmeier, F. & Comiskey, J. A. (eds).Forest biodiversity in North, Central and South America, and the Caribbean. Research and monitoring. MAB Series Vol. 21. UNESCO, Paris.
BERGMANS, F. & VROOMANS, V. 1995. Availability and sustainability of forest resources: a research to the structure and species composition of a north Bolivian Amazon forest and its actual and future resource availability. Thesis, Larenstein Agricultural College, Velp, The Netherlands.
BLACK, G. A., DOBZHANSKY, T. H. & PAVAN, C. 1950. Some attempts to estimate species diversity and population density of trees in Amazonian forests.Botanical Gazette111:413–425.
BONGERS, F., POPMA, J., MEAVE DEL CASTILLO, J. & CARABIAS, J. 1988. Structure and floristic composition of the lowland tropical rain forest of Los Tuxtlas, Mexico.Vegetatio 74:55–80.
BOOM, B. M. 1986. A forest inventory in Amazonian Bolivia.Biotropica 18:287–294.
BUSH, M. B. 1994. Amazonian speciation: a necessarily complex model.Journal of Biogeography 21:5–17. CAIN, S. A., DE OLIVEIRA CASTRO, M., MURC¸ A PIRES, J. & DA SILVA, N. T. 1956. Application of
some phytosociological techniques to Brazilian rain forest.American Journal of Botany43:911–941. CAMPBELL, D. G., DALY, D. C., PRANCE, G. T. & UBIRAJARA, N. M. 1986. Quantitative ecological
inventory of terra firme and varzea tropical forest on the Rio Xingu, Brazilian Amazon. Brittonia
38:369–393.
CAMPBELL, D. G., STONE, J. L. & ROSAS, A. 1992. A comparison of the phytosociology and dynamics of three floodplain (varzea) forests of known ages, Rio Jurua, western Brazilian Amazon.Botanical Journal of the Linnean Society108:213–237.
CASTELLANOS, H. G. 1998. Floristic composition and structure, tree diversity, and the relationship between floristic distribution and soil factors in El Caura Forest Reserve, southern Venezuela. Pp. 507–533 in Dallmeier, F. & Comiskey, J. A. (eds).Forest biodiversity in North, Central and South America, and the Caribbean. Research and monitoring. MAB Series Vol. 21. UNESCO, Paris.
CERO´ N, C. E. & MONTALVO, C. A. 1997. Composicio´n y estructura de una hecta´rea de bosque en la Amazonı´a Ecuatoriana – con informacio´n etnobota´nica de los Huaorani Pp. 153–172 in Valencia, R. & Balslev, H. (eds).Estudios sobre diversidad de plantas. Memorias de II congreso Ecuatoriana de Bota´nica. Pontificia Universidad Cato´lica del Ecuador, Quito.
CLINEBELL, R. R., PHILLIPS, O. L., GENTRY, A. H., STARK, N. & ZUURING, H. 1995. Prediction of neotropical tree and liana species richness from soil and climatic data.Biodiversity and Conservation
4:56–90.
COLWELL, R. K. & LEES, D. C. 2000. The mid-domain effect: geometric constraints on the geography of species richness.Trends in Ecology and Evolution15:70–76.
COMISKEY, J. A., AYMARD, G. & DALLMEIER, F. 1994. Structure and composition of lowland mixed forest in the Kwakwani region of Guyana.Biollonia10:13–28.
CONDIT, R., FOSTER, R. B., HUBBELL, S. P., SUKUMAR, R., LEIGH, E. G., MANOKARAN, N., LOO DE LAO, S., LAFRANKIE, J. V. & ASHTON, P. S. 1998. Assessing forest diversity on small plots: calibration using species-individual curves from 50-hectare plots. Pp. 247–268 in Dallmeier, F. & Comiskey, J. A. (eds).Forest biodiversity research, monitoring and modelling. Conceptual background and Old World case studies. MAB Series Vol. 20. UNESCO, Paris.
DAVIS, T. A. W. & RICHARDS, P. W. 1934. The vegetation of Moraballi creek, British Guiana. An ecological study of a limited area of tropical rain forest. II.Journal of Ecology22:106–155.
DE WALT, S. J., BOURDY, G., CHAVEZ DE MICHEL, L. R. & QUENEVO, C. 1999. Ethnobotany of the Tacana. Quantitative inventories of two permanent plots of northwestern Bolivia.Economic Botany
53:237–260.
DUCKE, A. & BLACK, G. A. 1954. Notas sobre a fitogeografia da Amazoˆnia Brasileira.Boletim Technico IAN (Bele´m)29:1–62.
DUIVENVOORDEN, J. F. & LIPS, J. M. 1995.A land-ecological study of soils, vegetation and plant diversity in Colombian Amazonia. Tropenbos Series 12. Tropenbos Foundation, Wageningen, The Netherlands. DUIVENVOORDEN, J. F. & LIPS, J. M. 1998. Mesoscale patterns of tree species diversity in Colombian
Amazonia. Pp. 535–549 in Dallmeier, F. & Comiskey, J. A. (eds).Forest biodiversity in North, Central and South America, and the Caribbean. Research and monitoring. MAB Series Vol. 21. UNESCO, Paris. EK, R. C. 1997. Botanical diversity in the tropical rain forest of Guyana. Tropenbos-Guyana Programme,
Georgetown, Guyana. Ph.D. thesis, Utrecht University, The Netherlands.
EK, R. C. & TER STEEGE, H. 1998. The flora of the Mabura Hill area, Guyana.Botanischer Jahrbucher fu¨r Systematik120:461–502.
FABER-LANGENDOEN, D. & GENTRY, A. H. 1991. The structure and diversity of rain forests at Bajo Calima, Choco´, western Colombia.Biotropica 23:2–11.
FERREIRA, L. V. 1997. Effects of the duration of flooding on species richness and floristic composition in three hectares in the Jau´ National park in floodplain forest in central Amazonia.Biodiversity and Conservation6:1353–1363.
FERREIRA, L. V. & PRANCE, G. T. 1998a. Structure and species richness of low-diversity floodplain forest on the Rio Tapajo´s, Eastern Amazonia, Brazil.Biodiversity and Conservation7:585–596.
FERREIRA, L. V. & PRANCE, G. T. 1998b. Species richness and floristic composition in four hectares in the Jau´ National Park in upland forests in Central Amazonia. Biodiversity and Conservation7:1349– 1364.
FERREIRA, L. V. & RANKIN-DE MERONA, J. M. 1998. Floristic composition and structure of a one-hectare forest in central Amazonia. Pp. 649–662 in Dallmeier, F. & Comiskey, J. A. (eds).Forest biodiversity in North, Central and South America, and the Caribbean. Research and monitoring. MAB Series Vol. 21. UNESCO, Paris.
FINOL URDANETA, H. UNDATED. Silvicultura de la Mora de Guiana (Mora gonggrijpii). Faculdad de Ciencias Forestales. Instituto de Silvicultura, Me´rida, Venezuela. 73 pp.
FISHER, A. A., CORBET, A. S. & WILLIAMS, C. B. 1943. The relation between the number of species and the number of individuals in a random sample of an animal population.Journal of Animal Ecology
12:42–58.
GALEANO, G., CEDIEL, J. & PARDO, M. 1998. Structure and floristic composition of a one-hectare plot of wet forest at the Pacific coast of Choca, Colombia. Pp. 551–568 in Dallmeier, F. & Comiskey, J. A. (eds).Forest biodiversity in North, Central and South America, and the Caribbean. Research and monitoring. MAB Series Vol. 21. UNESCO, Paris.
GAZEL, M. 1983.Croissance des arbres et productivite´ des peuplement en foreˆt dense e´quatoriale de Guyane. Office National de Foreˆts, Cayenne, France. 129 pp.
GENTRY, A. H. 1988a. Tree species richness of upper Amazonian forests. Proceedings of the National Academy of Sciences, USA85:156–159.
GENTRY, A. H. 1988b. Changes in plant community diversity and floristic composition on environmental and geographical gradients.Annals of the Missouri Botanical Garden 75:1–34.
GENTRY, A. H. 1990. Floristic similarities and differences between southern Central America and upper and central Amazonia. Pp. 141–157 in Gentry, A. H. (ed.).Four neotropical rain forests. Yale University Press, New Haven.
GENTRY, A. H. 1992. Tropical forest biodiversity: distributional patterns and their conservational significance. Oikos63:19–28.
GENTRY, A. H. & TERBORGH, J. 1990. Composition and dynamics of the Cocha Cashu ‘mature’ floodplain forest. Pp. 542–564 in Gentry, A. H. (ed.).Four neotropical rain forests. Yale University Press, New Haven.
GIVNISH, T. J. 1999. On the causes of gradients in tropical tree diversity.Journal of Ecology87:193–210. GROSS-BRAUN, E. H., DERTING, J. & SUGGETT, R. (1965). Report of the soil survey project of British
Guiana VII: A report to accompany a general soil map of British Guiana. FAO, Rome.
HAFFER, J. 1997. Alternative models of vertebrate speciation in Amazonia: an overview.Biodiversity and Conservation6:451–476.
HALL, J. B. & SWAINE, M. D. 1976. Classification and ecology of closed-canopy forest in Ghana.Journal of Ecology64:913–951.
HARTSHORN, G. 1983. Plants – introduction. Pp. 118–157 in Janzen, D. A. (ed.). Costa Rican natural history. University of Chicago Press, Chicago.
HEANY, A. & PROCTOR, J. 1990. Preliminary studies on forest structure and floristics on Volcan Barva, Costa Rica.Journal of Tropical Ecology6:307–320.
HUBER, O. 1995. Vegetation. Pp. 97–160 in Berry, P. E., Holst, B. K. & Yatskievych, K. (eds).Flora of Venezualan Guayana.Volume 1. Introduction. Missouri Botanical Garden, St. Louis.
HUSTON, M. A. 1980. Soil nutrients and tree species richness in Costa Rican forests. Journal of Biogeography7:147–157.
HUSTON, M. A. 1994. Biological diversity. The coexistence of species on changing landscapes. Cambridge University Press, Cambridge, UK. 681 pp.
IGAC, Instituto Geografico Augustin Codazzi 1993. Aspectos ambientales para el ordenamiento territorial del occidente del departamento del Caqueta´. Tropenbos Colombia, Bogota´, Colombia. 1641 pp.
JOHNSTON, M. & GILLMAN, M. 1995. Tree population studies in low-diversity forests, Guyana. I. Floristic composition and stand structure.Biodiversity and Conservation4:339–362.
JONKERS, W. B. J. 1987.Vegetation structure logging damage and silviculture in a tropical rain forest in Suriname. Wageningen Agricultural University, Wageningen, The Netherlands. 172 pp.
KAHN, F. & DE GRANVILLE, J.-J. 1992. Palms in forest ecosystems of Amazonia. Ecological Studies 95. Springer Verlag, Berlin. 226 pp.
KAY, R. F., MADDEN, R. H., VAN SCHAIK, C. & HIGDON, D. 1997. Primate species richness is determined by plant productivity: implications for conservation. Proceedings of the National Academy of Sciences USA. 94:13023–13027.
KORNING, J. & BALSLEV, H. 1994. Growth and mortality of trees in Amazonian tropical rain forest in Ecuador.Journal of Vegetation Science 4:77–86.
LAURANCE, W. F., FERREIRA, L. V., RANKIN-DE MERONA, J. M. & HUTCHINGS, R. W. 1998. Influence of plot shape on estimates of tree diversity and community composition in central Amazonia.
Biotropica30:662–665.
LEIGH, E. G. 1995 Epilogue: Research on Barro Colorado Island 1980–1994. Pp. 496–503 in Leigh E. G., Rand, A. S & Windsor D. M. (eds).The ecology of a tropical rain forest, seasonal rhythms and long term changes. Smithsonian Institution Press, Washington.
LIZARRALDE, M. 1997. Perception, knowledge and use of the rain forest: ethnobotany of the Bari of Venezuela. PhD Thesis, University of California.
LLERAS, E. 1997. Upper Rio Negro region. Brazil, Colombia, Venezuela. Pp. 333–337 in Davis, S. D., Heywood, V. H., Herrera-MacBryde, O., Vila-Lobos, J. & Hamilton, A. C. (eds). Centres of plant diversity. A guide and strategy for their conservation.Volume 3.The Americas. World-Wide Fund for Nature & World Conservation Union, Gland.
LONDON˜ A VEGA, A. C. 1993.Ana´lisis estructural de dos bosques asociados a unidades fisiographicas contrastantes, en la regio´n de Araracuara (Amazonia Colombiana). Universidad de Colombia, Medellı´n, Colombia. MAAS, P. J. M. 1971. Floristic observations on forest types in western Suriname I and II.Proceedings of
the Koninklijke Nederlandse Academie van Wetenschappen Ser. C74:269–302.
MAAS, P. J. M. & WESTRA, L. Y. Th. 1993.Neotropical plant families. Koeltz Scientific Books, Koenigstein, Germany. 290 pp.
MACIEL, U. N. & LISBOA, P. L. B. 1989. Estudo florı´stico de 1 hectarea de mata de terra firme Km 15 da rodovia Presidente Me´dici-Costa Marques (RO-429), Rondoˆnia.Boletim do Museu Paraense Emı´lio Goeldi. Serie Botaˆnica5:25–37.
MARIN, E. & CHAVIEL, A. 1996. La vegetacio´n: bosques de tierra firme. Pp. 60–65 in Rosales, J. & Huber O. (eds). Ecologı´a de la Cuenca del Rı´o Cauca, Venezuela I. Caracterizacio´n general.Scientia Guaianae 6.
MARZLUFF, J. M. & DIAL K. P. 1991. Life history correlates of taxonomic diversity.Ecology 72:428– 439.
MILLIKEN, W. 1998. Structure and composition of one hectare of central Amazonian terra firme forest.
Biotropica30:530–537.
MILLIKEN, W. & RATTER, J. A. 1998. The vegetation of the Ilha de Maraca. Pp. 71–112 in Milliken W. & Ratter J. A. (eds).Maraca: the biodiversity and environment of an Amazonian rain forest. John Wiley & Sons, New York.
MORI, S. A. & BOOM, B. M. 1987. The forest.Memoirs of the New York Botanical Garden 44:9–29. MORI, S. A., BOOM, B. M., CARVALHO, A. M. & DOS SANTOS, T. S. 1983. Southern Bahian moist
forests.Botanical Review149:155–232.
MORI, S. A., BECKER, P. & KINCAID, D. In press. Lecythidaceae of a central Amazonian lowland forest: implications for conservation. In Bierregaard R. (ed.). Lessons from Amazonia. Yale University Press, New Haven, USA.
NELSON, B. W., FERREIRA, C. A. C., DA SILVA, M. F. & KAWASAKI, M. L. 1990. Endemism centres, refugia and botanical collection density in Brazilian Amazonia.Nature 345:714–716.
OLIVEIRA, A. A. de 1997. Diversidade, estrutura e dinaˆmica do componente arbo´reo de uma floresta de terra firme de Manaus, Amazonas. Ph. D. dissertation, Instituto de Biocieˆncias da Universidade de Sa˜o Paulo.
OLIVEIRA, A. A. DE & MORI, S. A. 1999. A central Amazonian terra firme forest I. High tree species richness on poor soils. Biodiversity and Conservation8:1219–1244.
PANNATIER, Y. 1996. VARIOWIN: software for spatial data analysis in 2D. Springer-Verlag, New York, USA. 91 pp.
PERES, C. A. 1994. Primate response to phenological changes in an Amazonian terra firme forest.
Biotropica26:98–112.
PHILLIPS, O. L., HALL, P., GENTRY, A. H., SAWYER, A. S. & VASQUEZ, R. 1994. Dynamics and species richness of tropical rain forests. Proceedings of the National Academy of Sciences, USA 91:2805– 2809.
PIRES, J. M. 1997. Transverse dry belt of Brazil. Pp. 319–324 in Davis, S. D., Heywood, V. H., Herrera-MacBryde, O., Vila-Lobos, J. & Hamilton, A. C. (eds). Centres of plant diversity. A guide and strategy for their conservation.Volume 3.The Americas. World-Wide Fund for Nature & World Conservation Union, Gland.
PIRES, J. M., DOBZHANSKY, T. H. & BLACK, G. A. 1953. An estimate of the number of species of trees in an Amazonian forest community. Botanical Gazette114:467–477.
PIRES, J. M. & KOURY, H. M. 1958. Estudo de um trecho de mata va´rzea pro´ximo Bele´m. Boletim Te´chnico I. A. N. 36:3–44.
PIRES, J. M. & PRANCE, G. T. 1984. The vegetation types of the Brazilian Amazon. Pp. 109–145 in Prance, G. T. & Lovejoy, T. E. (eds).Amazonia. Pergamon Press, Oxford.
PITMAN, N. C. A., TERBORGH, J., SILMAN, M. R. & NUNEZ-V, P. 1999. Tree species distributions in an upper Amazonian forest.Ecology80:2651–2661.
PRANCE, G. T. 1982. Forest refuges: evidence from woody angiosperms. Pp. 137–138 in Prance, G. T. (ed.).Biological diversification in the tropics. Columbia University Press, New York.
PRANCE, G. T. 1986.Chrysobalanaceae. Flora of the Guianas, Series A, fascicle 2. Koeltz Scientific Books, Koenigstein, Germany. 148 pp.
PRANCE, G. T. 1987. Vegetation. Pp. 28–45 in Whitmore T. C. & Prance, G. T. (eds).Biogeography and quaternary history in tropical America. Clarendon Press, Oxford.
PRANCE, G. T. 1990. Floristic composition of the forests of central Amazonian Brazil. Pp. 112–140 in Gentry, A. H. (ed.).Four neotropical rain forests. Yale University Press, New Haven.
RAICH, J. W., RASTETTER, E. B., MELILLO, J. M., KICKLIGHTER, D. W., STEUDLER, P. A., PETERSON, B. J., GRACE, A. L., MOORE III, B. & VO¨ RO¨ SMARTY, C. J. 1991. Potential net primary productivity in South America: application of a global model. Ecological Applications 1:399– 429.
RAMDASS, I., SINGH, J., TAMESSAR, M. & GOPAUL, D. 1997.National activity on the use of biodiversity, Guyana. UNDP/Office of the President/University of Guyana, Georgetown, Guyana.
RADAMBRASIL. 1968–1978.Levantamento de Recursos Naturais. Vols 1–18. Ministe´rio de Minas e Energia. Departamento Nacional de Produc¸a˜o Mineral, Rio de Janeiro.
RANKIN-DE MERONA, J. M., HUTCHINGS, R. W. & LOVEJOY, T. E. 1990. Tree mortality and recruitment over a five-year period in undisturbed upland rain forest of the central Amazon. Pp. 573–584 in Gentry, A. H. (ed.).Four neotropical rain forests. Yale University Press, New Haven. RANKIN-DE MERONA, J. M., PRANCE, G. T., HUTCHINGS, R. W., DA SILVA, M. F., RODRIGUES,
W. A. & UEHLING, M. E. 1992. Preliminary results of a large-scale tree inventory of upland rain forest in the Central AmazonActa Amazoˆnica 22:493–534.
RICHTER, D. D. & BABBAR, L. I. 1991. Soil diversity in the tropics. Advances in Ecological Research
21:315–389.
RODRIGUES, W. A. 1963. Estudo de 2,6 hectareas de mata terra firme da Serra do Navio, Territo´rio do Amapa´.Boletim do Museu Paraense Emı´lio Goeldi Nova Se´rie 19.
ROHDE, K. 1992. Latitudinal gradients in species diversity: the search for the primary cause. Oikos
65:514–527.
ROLLET, B. 1993. Tree populations in natural rain forests. A case study: Brazilian Amazonia. Bois et Foreˆts des Tropiques236:43–55.
ROSALES-GODOY, J., PETTS, G. & SALO, J. 1999. Riparian flooded forests of the Orinoco and Amazon basins: a comparative review.Biodiversity and Conservation8:551–586.
ROSENZWEIG, M. L. 1995. Species diversity in space and time. Cambridge University Press, Cambridge, UK. 436.
SABATIER, D. & PREVOST, M. F. 1987. Une foreˆt a Cacaoyers sauvages sure le Haut-Camopi, en Guyane Franc¸aise. ORSTOM, Cayenne, France. 29 pp.
SABATIER, D., GRIMALDI, M., PREVOST, M.-F., GUILLAUME, J., GODRON, M., DOSSO, M. & CURMI, P. 1997. The influence of soil cover organization on the floristic and structural heterogeneity of a Guianan rain forest.Plant Ecology131:81–108.
SALO, J., KALLIOLA, R., HA¨KKINEN, I., MA¨KINEN, Y., NIEMELA¨, P., PUHAKKA, M. & COLEY, P. D. 1986. River dynamics and the diversity of Amazon lowland rain forest.Nature 322:254–258. SALOMA˜O, R. P. 1991. Uso de parceles permanentes para estudos da vegetac¸a˜o da floresta tropical
u
´mida. I. Municı´pio de Maraba´, Para´. Boletim do Museu Paraense Emı´lio Goeldi. Serie Botaˆnica 7:543– 604.
SALOMA˜O, R. P. & LISBOA, P. L. 1988. Ana´lise ecolo´gica da vegetac¸a˜o de uma floresta pluvial tropical de terra firme, Rondoˆnia.Boletim do Museu Paraense Emı´lio Goeldi. Serie Botaˆnica4:195–233.
SALOMA˜O, R. P., SILVA, M. F. F. & LISBOA, P. L. 1988. Inventario ecolo´gico em floresta pluvial tropical de terra firme, Serra Norte, Caraja´s, Para´. Boletim do Museu Paraense Emı´lio Goeldi Serie Botaˆnica4:1–46.
SCHULZ, J. P. 1960.Ecological studies on rain forest in northern Surinam. Van Eedenfonds, Amsterdam, The Netherlands.
SILVA, A. S. L., LISBOA, P. L. B. & MACIEL, U. N. 1992. Diversidade florı´stica e estrutura em floresta densa da bacia do Rio Jurua´-Am.Boletim do Museu Paraense Emı´lio Goeldi Serie Botaˆnica8:203–253. SILVA, M. F. F. & ROSA, N. A. 1989. Ana´lise do estrato arbo´reo da vegetac¸a˜o sobre jazidas de cobre
na Serra do Caraja´s–PA.Boletim do Museu Paraense Emı´lio Goeldi. Serie Botaˆnica5:175–206.
SILVA, M. F. F., ROSA, N. A. & OLIVEIRA, J. 1987. Estudos botaˆnicos na a´rea do projecto Ferro Caraja´s. 5. Aspectos florı´sticos da mata do Rio Gelado, Para´.Boletim do Museu Paraense Emı´lio Goeldi. Serie Botaˆnica3:1–20.
SILVA, M. F. F., ROSA, N. A. & SALOMA˜O, R. P. 1986. Estudos botaˆnicos na a´rea do projecto Ferro Caraja´s. 3. Aspectos florı´sticos da mata do aeroporto de Serra Norte – PA. Boletim do Museu Paraense Emı´lio Goeldi. Serie Botaˆnica2:169–187.
SMITH, D. N. & KILLEEN, T. J. 1998. A comparison of the structure and composition of montane and lowland tropical forest in the Serrania Pilo´n, Beni, Bolivia. Pp. 681–700 in Dallmeier, F. & Comiskey, J. A. (eds).Forest biodiversity in North, Central and South America, and the Caribbean. Research and monitoring. MAB Series Vol. 21. UNESCO, Paris.
SPICHIGER, R., LOIZEAU, P.-A., LATOUR, C. & BARRIERA, G. 1996. Tree species richness of a South-Western Amazonian forest (Jenaro Herrera, Peru, 73°40’W/ 4°54’S). Candollea51:559–577. STERGIOS, B., COMISKEY, J. A., DALLMEIER, F. & LICATA A NINO, M. 1998. Species diversity,
spatial distribution and structural aspects of semi-deciduous lowland gallery forests in the western Llanos of Venezuela. Pp. 449–479 in Dallmeier, F. & Comiskey, J. A. (eds).Forest biodiversity in North, Central and South America, and the Caribbean. Research and monitoring. MAB Series Vol. 21. UNESCO, Paris.
STERN, M. J. 1998. Field comparisons of two rapid vegetation assessment techniques with permanent plot inventory data in Amazonian Peru. Pp. 269–283 in Dallmeier, F. & Comiskey, J. A. (eds).Forest biodiversity research, monitoring and modelling. Conceptual background and Old World case studies. MAB Series Vol. 20. UNESCO, Paris.
SUDAM. 1974.Levantamentos florestais realizados pela missa˜o FAO na Amazoˆnia. Bele´m, Vol 2.
TAYLOR, L. R., KEMPTON, R. A. & WOIWOD, I. P. 1976. Diversity statistics and the log-series model.
Journal of Animal Ecology45:255–272.
TER STEEGE, H. 1998a. The use of forest inventory data for a National Protected Area Strategy in Guyana.Biodiversity and Conservation7:1457–1483.
TER STEEGE, H. 1998b. Biomass estimates for forest in Guyana and their use in carbon offsets. Iwokrama International Centre for Rain Forest Conservation and Development/UNDP, Georgetown, Guyana. 50 pp.
TER STEEGE, H., JANSEN-JACOBS M. J. & DATADIN, V. (2000). Can botanical collections assist in a National Protected Area Strategy in Guyana?Biodiversity and Conservation9:215–240.
TER STEEGE, H., JETTEN, V. G., POLAK, M. & WERGER, M. J. A. 1993. The tropical rain forest types and soils of a watershed in Guyana, South America.Journal of Vegetation Science 4:705–716. TERBORGH, J. 1973. On the notion of favorableness in plant ecology.American Naturalist107:481–501. TERBORGH, J. & ANDRESEN, E. 1998. The composition of Amazonian forests: patterns at local and
regional scale.Journal of Tropical Ecology 14:645–664.
TOMLINSON, P. B. 1986.The botany of mangroves. Cambridge University Press, Cambridge, UK. 413 pp. TUOMISTO, H. & RUOKOLAINEN, K. 1997. The role of ecological knowledge in explaining
biogeography and biodiversity in Amazonia.Biodiversity and Conservation6:347–357.
UHL, C. & MURPHY, P. G. 1981. Composition, structure, and regeneration of terra firme forest in the Amazon basin of Venezuela.Tropical Biology22:219–237.
URREGO GIRRALDO, L. E. 1997. Los bosques inundables del Medio Caqueta. Caracterizacio´n y sucesio´n Estudios en la Amazonia Colombiana XIV. Tropenbos Colombia, Bogota.
VALENCIA, R., BALSEV, H., PALACIOS, W., NEILL, D., JOSSE, C., TIRADO, M. & SKOV, F. 1998. Diversity and family composition of trees in different regions of Ecuador: a sample of 18 one-hectare plots. Pp. 569–584 in Dallmeier, F. & Comiskey, J. A. (eds). Forest biodiversity in North, Central and South America, and the Caribbean. Research and monitoring. MAB Series Vol. 21. UNESCO, Paris, France. VALENCIA, R., BALSLEV, H. & PAZ Y MINO, G. 1994. High tree alpha-diversity in Amazonian
Ecuador.Biodiversity and Conservation3:21–28.
VEGA, L. C. 1968. La estructura y composicio´n de los bosques hu´medos tropicales del Carare, Colombia.
Turrialba18:416–436.
VOSS, R. S. & EMMONS, L. H. 1996. Mammalian diversity in neotropical lowland rain forests: a preliminary assessment.Bulletin of the American Museum of Natural History230:1–115.
WORBES, M., KLINGE, H., REVILLA, J. D. & MARTIUS, C. 1992. On the dynamics, floristic subdivision and geographical distribution of va´rzea forests in Central Amazonia.Journal of Vegetation Science3:553– 564.
Tree
diversity
in
Amazonia
and
the
Guiana
Shield
825
more forest types can be present at one site and sometimes plots are given general coordinates but are not close, more that one per site is possible).
Country/Site/Coordinates Np alpha alpha max Nf References
Bolivia
Alto Ivo´n, 11°45′S, 66°02′W 1 30.2 30.2 1 Boom (1986)
Amboro´, 17°45′S, 63°44′W 1 20.7 20.7 Vargas (1995) in Smith & Killeen (1998)
Rio Beni, 14°38′S, 66°18′W 2 12.9 14.8 2 Dallmeieret al. (1996) and in Terborgh & Andresen (1998) Chimanes, 15°00′S, 66°30′W 1 24.2 24.2 De Aquila (1996) in Smith & Killeen (1998)
El Tigre, 10°59′S, 65°43′W 4 23.5 24.5 1 Bergmans & Vroomans (1995)
Noel Kempff, 14°35′S, 60°50′W 2 26.5 31.1 Saldiaset al. (1994) in Smith & Killeen (1998) Perseverencia, 14°33′S, 62°45′W 1 29.4 29.4 Vargaset al.(1994) in Smith & Killeen (1998) Rio Beni, 14°22′S, 67°33′W 2 45.2 47.7 De Waltet al. (1999)
Rio Maniqui, 14°30′S, 66°50′W 1 13.0 13.0 Palacioset al. (1991) in Cero´n & Montalvo (1997) Serrania Pilo´n, 14°55′S, 67°05′W 1 62.2 62.2 Smith & Killeen (1998)
St. Cruz de la Sierra, 17°47′S, 63°04′W 1 9.1 9.1 Paz (1991) in Silvaet al. (1992) Brazil
Altamira, 3°12′S, 52°45′W 2 78.2 121.0 Dantas & Muller (1979) in Campbellet al. (1986), Dantaset al. (1989) in Fer-reira & Rankin-de Merona (1998)
Aripuana, 10°10′S, 59°27′W 1 0.0 0.0 1 Ayres (1981) in Terborgh & Andresen (1998)
BDFFP, 3°08′S, 60°02′W 2 176.9 176.9 2 Ferreira & Rankin-de Merona (1998), Rankin-de Merona et al. (1990), Rankin-de Meronaet al. (1992)
Bele´m, 1°30′S, 47°59′W 2 25.1 33.2 1 Blacket al. (1950)
Breves, 1°40′N, 50°09′W 1 76.8 76.8 Pires (1966) in Campbellet al.(1986) Camaipa, 0°10′N, 51°37′W 1 68.4 68.4 1 Moriet al. (1989)
Capita˜o Poc¸o, 1°44′S, 47°09′W 1 49.8 49.8 Dantaset al. (1980) in Campbellet al. (1986)
Caraja´s, 6°00′S, 50°30′W 5 51.0 54.6 3 Saloma˜oet al. (1988), Silva & Rosa (1989), Silvaet al.in Silva & Rosa (1989), Silvaet al. (1986)
Castanhal, 1°20′S, 47°50′W 1 53.3 53.3 1 Pireset al. (1953) Caxiuan˜a, 3°50′S, 51°30′W 4 88.2 107.7 1 Almeidaet al. (1993) Costa do Marrec¸a˜o, 3°25′S, 60°46′W 1 28.3 28.3 Worbeset al.(1992) Guama, 1°20′S, 48°30′W 1 24.6 24.6 1 Pires & Koury (1958)
Ilha de Maraca, 3°20′N, 61°20′W 3 30.6 41.4 Milliken & Ratter (1998), Thompsonet al. (1992) Japura, 2°00′S, 66°00′W 4 59.8 88.8 1 Ayres (1991), Ayres (1993)
Jaru´, 9°19′S, 61°45′W 2 61.6 62.2 Absyet al. (1987) Jaru´, 9°23′S, 61°03′W 2 56.0 56.7 1 Absyet al. (1987) Jaru´, 9°37′S, 61°50′W 2 62.4 67.1 Absyet al. (1987)
HANS
TER
STEEGE
E
T
AL.
Country/Site/Coordinates Np alpha alpha max Nf References Manaus-Itacoatiara, 3°08′S, 60°00′W 1 123.6 123.6 Prance (1990) Maraba´, 5°45′S, 49°02′W 6 40.1 43.3 1 Saloma˜o (1991) Maranha˜o, 3°10′S, 45°06′W 1 47.0 47.0 1 Balee (1986) Mare´, 1°45′N, 61°15′W 1 100.2 100.2 1 Milliken (1998) Mucambo, 1°27′S, 48°27′W 1 53.0 53.0 Cainet al. (1956) Municipio Una´, 15°00′S, 41°00′W 1 85.5 85.5 1 Moriet al. (1983)) Rio Gelado, 6°00′S, 50°30′W 1 45.8 45.8 1 Silvaet al.(1987) Rio Gurupi, 2°20′S, 46°30′W 1 67.3 67.3 1 Balee (1987) Rio Jurua´, 4°40′S, 66°10′W 1 108.0 108.0 1 Silvaet al. (1992) Rio Jurua´, 4°47′S, 66°15′W 1 99.2 99.2 1 Silvaet al. (1992) Rio Jurua´, 4°50′S, 66°22′W 1 126.4 126.4 1 Silvaet al. (1992) Rio Jurua´, 4°57′S, 66°35′W 1 147.5 147.5 1 Silvaet al. (1992) Rio Jurua´, 7°38′S, 72°40′W 1 40.1 40.1 1 Campbellet al. (1992) Rio Tapajo´s, 2°31′S, 54°58′W 3 6.4 8.6 1 Ferreira & Prance (1998a)
Rio Urucu´, 5°00′S, 65°00′W 2 165.6 221.8 1 Amaral (1996), Peres (1994); Peres (1991) in Terborgh & Andresen (1998) Rio Xingu´, 3°29′S, 51°40′W 4 53.0 75.8 1 Campbellet al. (1986)
Rio Xingu´, 4°45′S, 52°36′W 1 65.6 65.6 Balee & Campbell (1990) Rio Xingu´, 4°49′S, 52°31′W 1 72.6 72.6 Balee & Campbell (1990) Rondoˆnia, 11°00′S, 61°57′W 1 82.5 82.5 1 Saloma˜o & Lisboa (1988)
Rondoˆnia, 11°15′S, 62°50′W 2 39.8 50.2 1 Lisboa & Lisboa (1984) in Maciel & Lisboa (1989), Maciel & Lisboa (1989) Serra do Navio, 0°55′N, 52°01′W 2 36.1 36.9 Rodrigues (1963)
Ubatuba, 23°27′S, 45°04′W 1 0.0 0.0 1 Silva & Filho (1982) in Terborgh & Andresen (1998) Vilhen˜a, 12°15′S, 60°15′W 1 44.0 44.0 Santos in Saloma˜oet al. (1988)
Colombia
Araracuara, 0°34′S, 72°08′W 5 76.9 131.7 5 London˜a Vega (1993), Urrego (1997) Araracuara, 1°00′S, 71°30′W 5 106.6 176.6 4 Duivenvoorden & Lips (1995) Bajo Calima, 3°55′N, 77°00′W 1 152.6 152.6 Faber-Langendoen & Gentry (1991) Carare, 6°35′N, 73°56′W 4 21.8 29.1 Vega (1968)
El Amargal, 5°34′N, 77°31′W 1 62.1 62.1 Galeanoet al. (1998) La Tagua, Solano, 0°12′N, 74°39′W 1 34.3 34.3 1 IGAC (1993) Costa Rica
La Selva, 10°26′N, 84°00′W 3 39.8 44.5 1 Hartshorn (1983), Heany & Proctor (1990), Phillipset al. (1994)
Ecuador 0.0 0.0
An˜angu, 0°32′S, 76°26′W 3 85.2 114.0 1 Balslevet al. (1987), (1998); Korning & Balslev (1994) Charco Vicente, 0°43′S, 78°53′W 1 48.5 48.5 Palacioset al. (1991) in Cero´n & Montalvo (1997) Cuyabeno Reserve, 0°00′N, 76°10′W 1 211.0 211.0 1 Valenciaet al.1994), (1998)
Tree
diversity
in
Amazonia
and
the
Guiana
Shield
827
Country/Site/Coordinates Np alpha alpha max Nf References
Rio Shiripuno, 1°01′S, 76°58′W 1 104.6 104.6 1 Cero´n & Montalvo (1997)
San Miguel Cayapa´s, 0°45′S, 78°56′W 1 39.2 39.2 Palacioset al. (1991) in Cero´n & Montalvo (1997) French Guiana
Haut Camopi, 2°43′N, 53°08′W 1 65.3 65.3 1 D. Sabatier & M.F. Pre´vost (unpubl. data) Inini, 3°39′N, 53°49′W 2 85.0 86.2 1 D. Sabatier & M.F. Pre´vost (unpubl. data) Nouragues, 4°05′N, 52°42′W 8 97.0 122.0 2 D. Sabatier & M.F. Pre´vost (unpubl. data) Sau¨l, 3°38′N, 53°12′W 1 155.5 155.5 1 Mori & Boom (1987)
St Laurent, 5°30′N, 54°00′W 2 19.1 19.6 Gazel (1983)
St. E´lie, 5°18′N, 53°03′W 16 84.7 109.8 2 D. Sabatier & M.F. Pre´vost (unpubl. data) Guyana
Asakata, 7°45′N, 59°05′W 1 6.7 6.7 T. van Andel (unpubl. data) Barama, 7°44′N, 59°52′W 2 0.0 0.0 2 ECTF (unpubl. data) Iwokrama, 4°35′N, 58°43′W 4 19.9 23.5 3 Johnston & Gillman (1995) Kako, 5°44′N, 60°37′W 1 3.6 3.6 Ramdasset al.(1997) Kariako, 7°23′N, 59°43′W 1 7.1 7.1 T. van Andel (unpubl. data) Kariako, 7°25′N, 59°44′W 1 33.8 33.8 1 T. van Andel (unpubl. data) Kwakwani, 5°30′N, 58°00′W 2 23.4 29.3 1 Comiskeyet al. (1994) Mabura Hill, 5°02′N, 58°48′W 1 18.7 18.7 R. Thomas (unpubl. data)
Mabura Hill, 5°13′N, 58°35′W 11 16.5 23.0 4 R.C. Ek & R.J. Zagt (unpubl. data), R.C. Ek (unpubl. data), R. Lilwah & H. ter Steege (unpubl. data), R. Thomas (unpubl. data), J. van Essen (unpubl. data).
Mabura Hill, 5°13′N, 58°43′W 1 11.9 11.9 1 R.C. Ek, (unpubl. data)
Moraballi, 6°11′N, 58°33′W 6 22.4 28.9 5 Davis & Richards (1934), Ramdasset al. (1997) Moruca, 7°36′N, 58°57′W 1 33.1 33.1 1 T. van Andel, (unpubl. data)
Moruca, 7°41′N, 58°55′W 1 8.2 8.2 T. van Andel, (unpubl. data) St. Cuthberts, 6°22′N, 58°05′W 1 22.0 22.0 Ramdassetal. (1997) Mexico
Los Tuxtlas, 18°35′N, 95°07′W 1 35.1 35.1 Bongerset al. (1988) Panama
Barro Colorado Island, 9°09′N, 79°51′W 2 36.0 36.0 1 Conditet al. (1998) Peru
Aguajal, 11°52′S, 71°21′W 1 47.9 47.9 Pitmanet al. (1999) Barranco, 11°48′S, 71°28′W 1 109.7 109.7 Pitmanet al. (1999) Barranco, 11°53′S, 71°23′W 1 74.2 74.2 Pitmanet al. (1999)