Oceanic controls on the primary production of the northwest
European continental shelf: model experiments under recent past
conditions and a potential future scenario
J. Holt1, M. Butensch¨on2, S. L. Wakelin1, Y. Artioli2, and J. I. Allen2
1National Oceanography Centre, 6 Brownlow Street, Liverpool, L3 5DA, UK 2Plymouth Marine Laboratory, Prospect Place, The Hoe, Plymouth, PL1 3DH, UK
Correspondence to:J. Holt ([email protected])
Received: 22 July 2011 – Published in Biogeosciences Discuss.: 19 August 2011 Revised: 6 December 2011 – Accepted: 19 December 2011 – Published: 6 January 2012
Abstract.In this paper we clearly demonstrate that changes in oceanic nutrients are a first order factor in determining changes in the primary production of the northwest Euro-pean continental shelf on time scales of 5–10 yr. We present a series of coupled hydrodynamic ecosystem modelling sim-ulations, using the POLCOMS-ERSEM system. These are forced by both reanalysis data and a single example of a coupled ocean-atmosphere general circulation model (OA-GCM) representative of possible conditions in 2080–2100 under an SRES A1B emissions scenario, along with the cor-responding present day control. The OA-GCM forced sim-ulations show a substantial reduction in surface nutrients in the open-ocean regions of the model domain, comparing fu-ture and present day time-slices. This arises from a large increase in oceanic stratification. Tracer transport experi-ments identify a substantial fraction of on-shelf water origi-nates from the open-ocean region to the south of the domain, where this increase is largest, and indeed the on-shelf nutri-ent and primary production are reduced as this water is trans-ported on-shelf. This relationship is confirmed quantitatively by comparing changes in winter nitrate with total annual ni-trate uptake. The reduction in primary production by the re-duced nutrient transport is mitigated by on-shelf processes relating to temperature, stratification (length of growing sea-son) and recycling. Regions less exposed to ocean-shelf ex-change in this model (Celtic Sea, Irish Sea, English Channel, and Southern North Sea) show a modest increase in primary production (of 5–10 %) compared with a decrease of 0–20 %
in the outer shelf, Central and Northern North Sea. These findings are backed up by a boundary condition perturbation experiment and a simple mixing model.
1 Introduction
Coastal and shelf seas and their ecosystems form a vital part of the environment. They support substantial economic ac-tivity, e.g. a large fraction of global fisheries occur in these seas (Watson and Pauly, 2001), and important biogeochem-ical cycles, e.g. many coastal and shelf seas are observed to be a net sink of atmospheric CO2(e.g. Thomas et al., 2004).
However, this still remains a significant source of uncertainty in the global carbon budget (Borges, 2005). Fixation of car-bon by photosynthesis (primary production) is one of the most fundamental processes underlying both these aspects. Hence our ability to understand and ultimately predict this process, its variability and change is crucial to many aspects of environmental policy, for example the European Commis-sion’s Marine Strategy Framework Directive and the indica-tors of Good Environmental Status therein1.
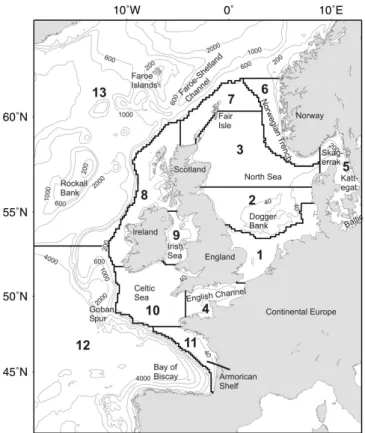
In this paper we explore the controls on the primary pro-duction of the northwest European Continental shelf (NWS; Fig. 1) on decadal time scales, through coupled hydrody-namic ecosystem modelling using the POLCOMS-ERSEM system (Allen et al., 2001; Holt and James, 2001). We
consider both present day/recent past conditions and an ex-ample of a possible future climate scenario. The latter is used to illustrate this region’s susceptibility to change under sub-stantially altered global conditions. Our focus here is on the interaction of these seas with the open-ocean, and the con-sequences of variability and change. We present an initial comparison between the changes in the oceanic effects and changes in the internal cycling in the model, but a detailed analysis of the latter is left to future work.
We now briefly review some features of this region im-portant to this study. The NWS is a broad temperate shelf forming the eastern margin of the Northern North Atlantic. It includes several shelf sea regions that are identified in Fig. 1. The dynamics of the region are controlled by the seasonal heating cycle, atmospheric fluxes, tides, river inputs and ex-changes with the open-ocean. Much of the open-shelf is sea-sonally stratified, with tidal mixing fronts separating these regions from well mixed/sporadically stratified shallower re-gions either nearer the coast or on banks and shoals. River discharge plays an important role in near coastal regions, leading to regions of freshwater influence; although com-pared with other shelf sea regions globally, river flows are low. The large scale ocean-shelf exchange is controlled by seasonal upwelling in the south of the region (see Gomez-Gesteira et al., 2011 and references therein), and the pole-ward slope current and Ekman transport in the North (Holt et al., 2009; Huthnance et al., 2009). This exchange is sup-plemented by sub-mesoscale processes (e.g. filaments and internal tides; Huthnance, 1995), which are not considered further here. This physical background controls, to a large extent, the spatial/temporal patterns of primary production in this region; accepting that this assertion may reflect our lim-ited understanding of “top-down” control in this context.
Much of these seas are inorganic nutrient limited and hence the supply and recycling of these nutrients generally controls the primary production. In coastal regions the com-bined inputs of significant riverine nutrient loads and op-tically active constituents (suspended particulate material, SPM, and coloured dissolved organic matter, CDOM) can lead to light limited regimes that can also exhibit excep-tionally high levels of production (e.g. Cadee and Hegeman, 2002). In winter months phytoplankton growth is inhibited by high levels of mixing (Huisman et al., 1999) and short day length. During spring, increasing solar irradiance and reduced mixing and consequent stratification can trigger in-tense phytoplankton blooms. These deplete surface nutri-ent supplies, but intermittnutri-ent cross-thermocline mixing (e.g. from spring neap tidal variability; Sharples, 2008) can main-tain mid-water production in stratified regions throughout the summer months, as long as the thermocline is within the eu-photic zone. In well-mixed and near-coastal regions the pro-duction is more erratic, being controlled by a complex inter-play of optical, mixing and river plume conditions. During autumn, storms and surface cooling (convection) mix the sea-sonally stratified water. This can trigger an autumn bloom.
Fig. 1.Model domain, sections for flux calculations and regions for areal integrals.
However, the de-stratification generally proceeds from south to north (Holt and Proctor, 2008), with the northern regions remaining stratified until December. Hence, light levels can limit the intensity of the autumn bloom. Bacterial and zoo-plankton consumption of phytozoo-plankton and detrital material in both pelagic and benthic systems recycles the nutrients and can also fuel further production.
The distribution and fluxes of inorganic nutrients are there-fore critical to understanding primary production. The NWS receives nutrients from:
1. oceanic inflow, which is in turn supplied by deep win-ter mixing and coastal upwelling (predominantly in the south of the region);
2. river inputs resulting from human, agricultural and in-dustrial sources (e.g. Artioli et al., 2008);
3. atmospheric inputs.
long compared with the seasonal cycle. For example, Hy-des et al. (2004) identifies the transit time for Atlantic water crossing the Celtic Sea into the Irish Sea to be 6 yr, while the transports estimates used by Huthnance (1997) imply a North Sea flushing time of∼1 yr.
There are several observational and empirical approaches to investigating primary production, for example through ship based measurements using incubations and chlorophyll based relations (e.g. Cadee and Hegeman, 2002; Joint and Pomeroy, 1993) and through satellite Ocean Colour based models (Carr et al., 2006). Here we explore the dynam-ical modelling approach, using a coupled hydrodynamic-ecosystem model of the NWS. We use the Proudman Oceanographic Laboratory Coastal Ocean Modelling System (POLCOMS; Holt and James, 2001) coupled to the Euro-pean Regional Seas Ecosystem Model (ERSEM; Blackford et al., 2004). While the uncertainties associated with such models are well documented (see Stow et al., 2009 and ref-erences therein), they provide a complete budget for the bio-geochemical and physical fluxes that is not available from other approaches. Hence they provide an invaluable tool for systems understanding and exploring hypotheses. Moreover, they can operate under “what if ?” scenarios representing particular environmental and/or anthropogenic change.
Potential impacts of climate change on the physical oceanography of these shelf seas are reviewed by Holt et al. (2010). Here we can identify three specific mechanisms (drivers) whereby large scale change might impact primary production in the NWS: through changes to the nutrient sup-ply (and its spatial/temporal distribution), through changes to the temperature, and consequent changes in chemical and physiological rates, and through changes to on-shelf strati-fication. Increases in stratification act both to reduce ver-tical nutrient fluxes during the summer and to increase the length of the growing season. For example in a HadRM3 forced simulation, Holt et al. (2010) find the stratified period in the North Sea increases by∼10 % towards the end of the 21st century (under an SRES A1B scenario) compared with present day conditions. In a region where in-season nutrient recycling and cross-thermocline transport play an important role, changes to the length of the growing season might be expected to have a significant effect on the total annual pri-mary production. While the experiments considered below also show an increase in stratification, forcing from other climate models might instead show a decrease in seasonal stratification. This can occur if winter temperatures warm faster than summer or if there is an increase in evaporation compared with precipitation. However, the non-linear equa-tion of state favours an increase in density stratificaequa-tion under
cerned with inter-annual scales and these drivers might be expected to act both through climate variability and climate change.
Our focus here is on the first of these drivers: changes to the nutrient supply, and the temperature and stratification effects are considered only briefly to put these changes in context. Climatic influence on nutrient supply has received substantial attention in the global ocean context through the reduction in winter mixing and expansion of the oligotrophic gyres seen by several coupled Ocean Atmosphere General Circulation Models (OA-GCMs). For example, the four models considered by Steinacher et al. (2010) all agree on a reduction in primary production in the North East Atlantic by the end of the 21st century in an SRES A2 scenario, ow-ing to increased stratification and reduced nutrient supply. In global scale models reduced nutrient supply due to stratifica-tion can be out-weighed by the temperature response and the increased growing season in mid- to high-latitudes, to give an overall increase in primary production (Sarmiento et al., 2004). The importance of the temperature response has also been highlighted by Taucher and Oschlies (2011). Other po-tential drivers, such as changes to optical properties, have as yet received scant attention.
investigate changes in atmospheric and riverine forcing (e.g. Schrum et al., 2003; Skogen et al., 2011), but miss a poten-tially important vector of change, namely that arising from changes in oceanic conditions. Addressing this shortcoming, and exploring its implications, is one of the specific objec-tives of this work. An additional advantage of the regional scale domain we are considering here, is to include several shelf sea regions and allow a consistent comparison between them, particularly some areas (such as the Celtic Sea), which have seen little modelling attention in this context.
In the next section we briefly describe the POLCOMS-ERSEM model and the specific experiments considered here. Section 3 describes the controls on the present day and po-tential future primary production, and the ocean-shelf cou-pling is further explored in Sect. 4. Conclusions are drawn in Sect. 5.
2 Model description, validation and experiments
POLCOMS is a three-dimensional hydrodynamic model us-ing a quasi finite-volume approach discretised on a B-grid in spherical-polar-terrain following coordinates. The At-lantic Margin Model (AMM; Fig. 1) configuration consid-ered here has a resolution of 1/9◦
latitude by 1/6◦
longitude grid (∼12 km) with 42 s-coordinate levels (Song and Haid-vogel, 1994) in the vertical. This configuration is further de-scribed by Wakelin et al. (2009).
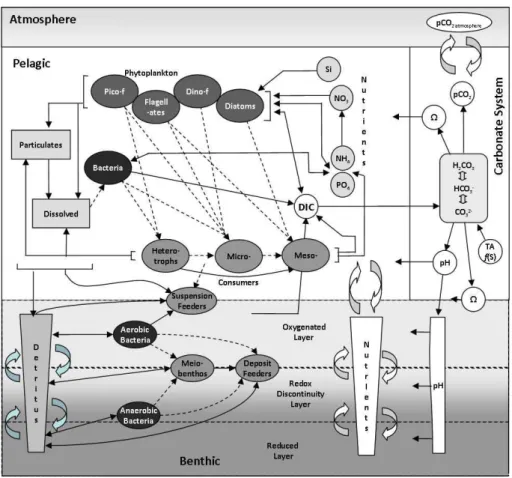
ERSEM (Fig. 2) is a well established, generic lower-trophic level/biogeochemical cycling model. Eight plank-ton functional types are represented, including phyto-, zoo-plankton and bacteria, along with the cycling of C, N, P, Si through pelagic (Blackford et al., 2004) and benthic (Black-ford, 1997) ecosystems; latter being critical for nutrient cy-cling in shelf seas. The model equations can be found in these two papers. The implementation of ERSEM consid-ered here essentially matches that described in Blackford et al. (2004) with the treatment of abiotic (SPM, CDOM) ab-sorption described by Wakelin et al. (2011). The parameter set matches that used by Blackford (2004), except here we limit the carbon to chlorophyll ratio to better match observa-tions (Geider et al., 1997; Artioli et al., 2011). In the current model we also included a resuspension flux of particulate or-ganic material driven by tidal and residual bottom currents, following Wakelin et al. (2011); surface wave effects are not considered.
The POLCOMS-ERSEM system has been used exten-sively in several NWS model domains in the context of un-derstanding model uncertainty (Holt et al., 2005; Lewis et al., 2006; Allen et al., 2007a), understanding regional processes (Proctor et al., 2003; Blackford et al., 2008; Holt et al., 2004) and for operational oceanography (Siddorn et al., 2007).
2.1 Model experiments
Here we consider four model experiments: a reanalysis forced simulation (ERA40) and three OA-GCM forced simu-lations (CNTRL, A1B and A1Bb). We use ERA40 to explore present day variability, the difference between CNTRL and ERA40 to explore the consequences of forcing this regional model with a coarser resolution OA-GCM and the difference between A1B and CNTRL to explore the behaviour of the system under a single example of possible future conditions. Experiments ERA40 and CNTRL are compared with obser-vations and other models in Sect. 2.2. Experiment A1Bb is used to further explore the importance of oceanic nutri-ent change for the on-shelf production. For this work we adopt a time-slice approach commonly used in climate im-pact studies, whereby mean conditions in a future period are compared with mean conditions in a present day reference period to give a measure of the climate change signal, on the assumption that conditions in both time-slices are approxi-mately stationary. This signal can then be compared with natural variability, model (structural and parameter) uncer-tainty and emissions unceruncer-tainty to assess the significance of this signal (Hawkins and Sutton, 2009). Because we only consider the first of these here and make no assessment of the likelihood of the future conditions (both in terms of the emis-sions scenario or the forcing OA-GCM) these simulations should be considered as a “sensitivity” experiment, rather than as a projection, illustrating the system’s response and the relative importance of different vectors of change. An alternative approach is to sequentially perturb different as-pects of the forcing to identify different response processes (Skogen et al., 2011). While this is insightful, the decadal simulations needed to investigate ocean-shelf coupling pro-hibit a full range of perturbation experiments, so we instead opt for a single self consistent set of forcing. The model ex-periments are now described in some detail.
2.1.1 ERA40
This is a 45 yr (1960–2004) simulation with surface forcing from the ERA-40 reanalysis (until September 2001) and sub-sequently ECMWF operational analysis, using 6-hourly at-mospheric air temperature, winds, pressure and relative hu-midity, and daily precipitation and short-wave radiation (the latter is modulated by the diurnal cycle). Surface fluxes are calculated by COARE v3 bulk formulae (Fairall et al., 2003) in all the experiments considered here. Lateral boundary con-ditions are taken from a 1◦
Fig. 2.Pelagic and benthic components of the ERSEM Model.
Ocean Atlas (WOA; Garcia et al., 2006) for nitrate, silicate and phosphate, imposed with an up-wind advection ary condition. Other variables use a “zero-gradient” bound-ary condition; this is equivalent to a one-dimensional (ver-tical) model at the boundary grid cell. An exception is the detrital organic material fluxes, which are set to zero inflow concentration to avoid numerical instability. For freshwater fluxes, daily discharge data for 250 rivers are used from the Global River Discharge Data Base (V¨or¨osmarty et al., 2000) and from data prepared by the Centre for Ecology and Hy-drology as used by Young and Holt (2007). River nutrient loading matches that used by Lenhart et al. (2010), with raw data for the UK, Northern Ireland, Ireland, France, Norway, Denmark and the Baltic processed by van Leeuwen (CEFAS, UK) and raw data for Germany and the Netherlands was pro-cessed by P¨atsch and Lenhart (2004). The Baltic exchange at the Belts is treated crudely as an inflow source using a mean annual cycle of depth averaged transport, salinity and nutri-ents. A constant spatial field of atmospheric nitrogen deposi-tion (oxidized and reduced) is provided by EMEP (Cooper-ative Programme for Monitoring and Evolution of the Long-range transmission of Air Pollutants in Europe; as is also used in some models considered by Lenhart, 2010). Aspects of this simulation have previously been reported by Holt et
al. (2009) and a subset of data from this simulation is freely available2.
2.1.2 CNTRL
This is a 23 yr present day simulation forced by the IPSL-CM4 OA-GCM (Marti et al., 2006) as run for the ENSEM-BLES project3, for the nominal present day period 1980– 1999 (1980 is repeated three times before this period is sim-ulated). The OA-GCM provides the same frequency atmo-spheric forcing fields as ERA40, and monthly ocean currents, sea level, temperature and salinity. Tides, rivers, abiotic ab-sorption, and nutrient boundary conditions match those in ERA40. We note this OA-GCM has a significant negative temperature bias in NWS (∼−2◦C), which may unduly in-fluence changes in those processes non-linearly dependent on the temperature e.g. growth rates and stratification. Hence we correct this bias (equally in CNTRL, A1B and A1Bb) using a time constant 3-D correction field (for temperature and salin-ity, derived from WOA data) applied to the initial and bound-ary conditions, and a 2-D correction to the air temperature
derived from ERA40. This is partially successful in remov-ing this bias (see Sect. 2.2).
2.1.3 A1B and A1Bb
A1B is a future climate scenario representative of possible conditions in 2080–2100 under a business as usual emissions scenario: SRES A1B (Nakicenovic and Swart, 2000). The first year is repeated two times before running this period. Forcing matches CNTRL using the same OA-GCM simula-tion run forward to this period. This OA-GCM simulasimula-tion includes the PISCES ecosystem model (Aumont et al., 2003) and we perturb the open-boundary nutrient values (nitrate, silicate and phosphate) by the fractional change between this time-slice and CNTRL; the bias between the PISCES nutri-ent values and WOA data prohibits the use of an absolute change. River flows are perturbed by changes in regional rainfall from the OA-GCM, whereas riverine nutrient loads and atmospheric inputs are unchanged.
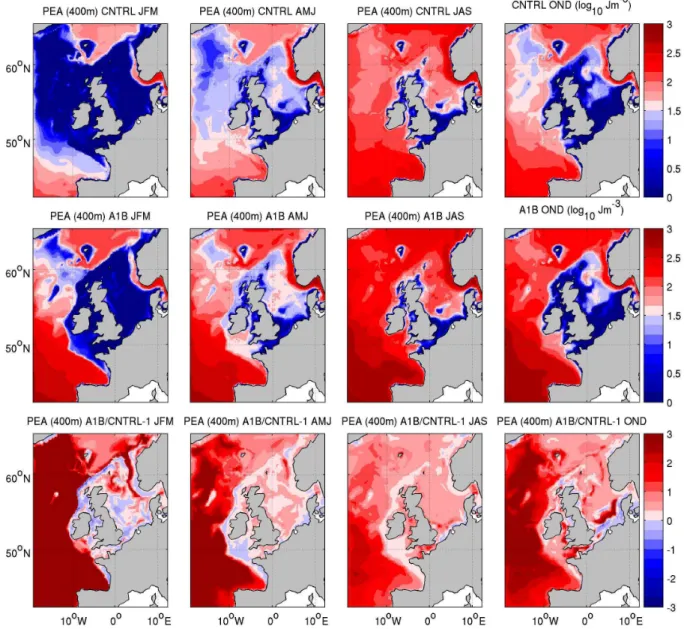
For the purpose of this work, the climate change signal be-tween A1B and CNTRL is well characterised by the change in temperature (not shown) and potential energy anomaly (Fig. 3). The potential energy anomaly gives a measure of stratification appropriate for both shelf seas and open-ocean, and is defined as the energy required to mix the top 400 m of the water column (see Holt et al. (2010) for further details). The sea surface temperature (SST) change (comparing CN-TRL and A1B) shows a strong seasonal signal being larger in the summer and autumn than winter and spring. Spatially the changes are largest in the North Sea (∼4◦C in the Central North Sea in summer) and smallest west of Biscay (∼0.5◦C in winter). This is accompanied by an increase in both sea-sonal and permanent stratification (Fig. 3). There is a sub-stantial increase in stratification in open-ocean regions of the model throughout the year. During the summer the greatest increase in oceanic stratification is towards the south of the domain. The shelf remains generally well mixed during win-ter, but there is a significant increase in stratification during the summer particularly in the Irish Sea, North Sea and En-glish Channel. While there is a significant fractional change in the “well-mixed” regions, values here remain low.
Experiment A1Bb matches A1B, except in this case the nutrient boundary conditions are not changed compared with CNTRL (i.e. just WOA nutrients are used). This partially constrains the open-ocean portion of the model to present day nutrient values.
In all experiments we treat the first 5 yr (justified in Sect. 4) as “spin-up” to allow the model to adjust to its lateral bound-ary and surface forcing conditions, so the results presented here are means for 40 yr for ERA40 and 18 yr for CNTRL, A1B and A1Bb.
2.2 Validation
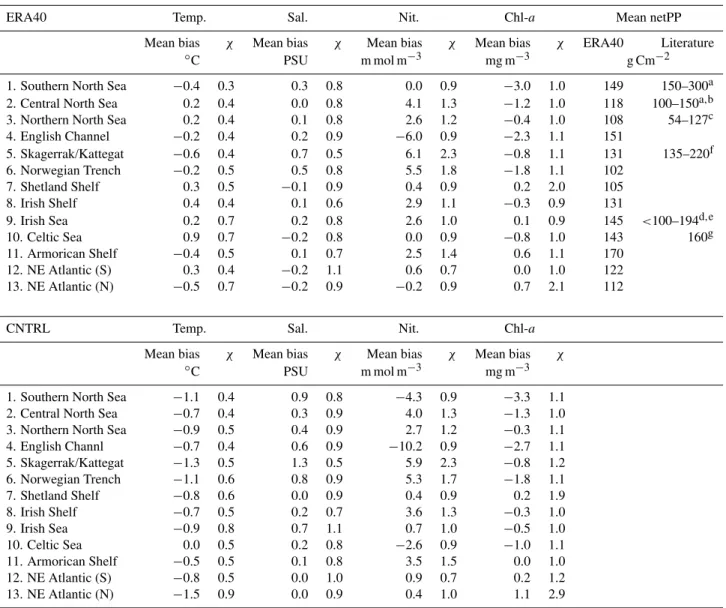
As with any model simulation, these results need to be considered in the context of observed properties to inform the reliability of the conclusions. The uncertainties in the POLCOMS-ERSEM system have been extensively investi-gated in comparison with contemporary observations for sea-sonal scale simulations (Allen et al., 2007a, b; Holt et al., 2005; Lewis et al., 2006) and detailed analysis of the repre-sentation of inter-annual variability in this simulation is un-derway (e.g. Holt et al., 2011). Hence, these are not con-sidered here. Instead we follow the approach of Holt et al. (2010) and focus on an assessment of the mean state for temperature, salinity, nitrate and chlorophyll, drawing on the substantial volume of in-situ data for this region held at the Wold Ocean Data Base4. We concentrate on values in the 13 regions shown in Fig. 1. All the data available in the pe-riod 1981–2004 for each month are averaged onto the model grid to give 12, 3-D monthly climatological mean fields for each variable and corresponding fields are calculated from the model results. For each month the surface fields are dif-ferenced (model minus observations) and these values used to calculate the statistics shown in Table 1, over each of the 13 regions. The bias is the average deviation across the re-gion and for all months. The cost function, χ, is defined as the root mean squared (RMS) deviation divided by the standard deviation of the monthly mean observed fields in each region. Surface values are defined as the top 8 model s-levels; this ranges from 2 m in 10 m water depth to 37 m in 4000 m water depth. Hence, the mean bias indicates the over-all sign and magnitude of the discrepancy between model observation andχ assesses the model’s ability to reproduce the mean annual cycle and the spatial variations. Cost func-tion values are typically∼1 across the regions and variables, except for temperature, which has values between 0.4 and 0.7. Hence salinity, nitrate and chlorophyll have RMS er-rors close to the spatial and temporal variability. The regions of the highest error for nitrate and chlorophyll are Skager-rak/Kattegat, Norwegian Trench (reflecting the poor repsentation of Baltic exchange), and Armorican shelf; these re-gions are not considered in detail in this investigation. The NE Atlantic and Shetland shelf also show high errors for chlorophyll, but there are limit number of data in these re-gions. There is no systematic increase in errors when com-paring CNTRL with ERA40, indicating that forcing with this coarser resolution OA-GCM does not substantially degrade the simulation. However, there is a consistent negative tem-perature bias in the CNTRL experiment, indicating that a more sophisticated bias correction approach may be needed. Validation of the net primary production (netPP) is more problematic. This is defined here as the total carbon uptake by phytoplankton minus the phytoplankton respiration, an-nually and depth integrated, but limited to the upper 200 m.
Fig. 3.Seasonal mean potential energy anomaly with integration limited to 400 m (Holt et al., 2010) for CNTRL and A1B (note log10 scale), and the fractional difference between them. For clarity this is limited to changes of a factor of 3, maximum change in oceanic regions is a factor of 5.7.
Direct measurements are rare and themselves subject to sub-stantial uncertainties. Satellite derived estimates are based on empirical modelling assumptions, are subject to contamina-tion with other optical properties and also have a treatment of respiration inconsistent with the model values. For example, the satellite derived estimates, being calibrated against in-situ primary production from bottle incubation experiments tend not to have negative values in the winter. However, they do provide our best spatially resolved estimate and so this is the subject of ongoing work. Comparisons with other model studies (e.g. Skogen and Moll, 2000) can provide a guide to areas to investigate further, but can equally re-affirm er-roneous model results. Hence, for our purposes observed
Table 1. Model validation for ERA40 and CNTRL using all WOD data in the domain for the period 1981–2004. Mean Bias and cost function,χare shown for the regions in Fig. 1. This is based on∼168 000 temperature and salinity observations, 62 000 nitrate observations and 49 000 chl-aobservations.
ERA40 Temp. Sal. Nit. Chl-a Mean netPP
Mean bias χ Mean bias χ Mean bias χ Mean bias χ ERA40 Literature
◦C PSU m mol m−3 mg m−3 g Cm−2
1. Southern North Sea −0.4 0.3 0.3 0.8 0.0 0.9 −3.0 1.0 149 150–300a
2. Central North Sea 0.2 0.4 0.0 0.8 4.1 1.3 −1.2 1.0 118 100–150a,b
3. Northern North Sea 0.2 0.4 0.1 0.8 2.6 1.2 −0.4 1.0 108 54–127c
4. English Channel −0.2 0.4 0.2 0.9 −6.0 0.9 −2.3 1.1 151
5. Skagerrak/Kattegat −0.6 0.4 0.7 0.5 6.1 2.3 −0.8 1.1 131 135–220f
6. Norwegian Trench −0.2 0.5 0.5 0.8 5.5 1.8 −1.8 1.1 102
7. Shetland Shelf 0.3 0.5 −0.1 0.9 0.4 0.9 0.2 2.0 105
8. Irish Shelf 0.4 0.4 0.1 0.6 2.9 1.1 −0.3 0.9 131
9. Irish Sea 0.2 0.7 0.2 0.8 2.6 1.0 0.1 0.9 145 <100–194d,e
10. Celtic Sea 0.9 0.7 −0.2 0.8 0.0 0.9 −0.8 1.0 143 160g
11. Armorican Shelf −0.4 0.5 0.1 0.7 2.5 1.4 0.6 1.1 170
12. NE Atlantic (S) 0.3 0.4 −0.2 1.1 0.6 0.7 0.0 1.0 122
13. NE Atlantic (N) −0.5 0.7 −0.2 0.9 −0.2 0.9 0.7 2.1 112
CNTRL Temp. Sal. Nit. Chl-a
Mean bias χ Mean bias χ Mean bias χ Mean bias χ
◦C PSU m mol m−3 mg m−3
1. Southern North Sea −1.1 0.4 0.9 0.8 −4.3 0.9 −3.3 1.1
2. Central North Sea −0.7 0.4 0.3 0.9 4.0 1.3 −1.3 1.0
3. Northern North Sea −0.9 0.5 0.4 0.9 2.7 1.2 −0.3 1.1
4. English Channl −0.7 0.4 0.6 0.9 −10.2 0.9 −2.7 1.1
5. Skagerrak/Kattegat −1.3 0.5 1.3 0.5 5.9 2.3 −0.8 1.2
6. Norwegian Trench −1.1 0.6 0.8 0.9 5.3 1.7 −1.8 1.1
7. Shetland Shelf −0.8 0.6 0.0 0.9 0.4 0.9 0.2 1.9
8. Irish Shelf −0.7 0.5 0.2 0.7 3.6 1.3 −0.3 1.0
9. Irish Sea −0.9 0.8 0.7 1.1 0.7 1.0 −0.5 1.0
10. Celtic Sea 0.0 0.5 0.2 0.8 −2.6 0.9 −1.0 1.1
11. Armorican Shelf −0.5 0.5 0.1 0.8 3.5 1.5 0.0 1.0
12. NE Atlantic (S) −0.8 0.5 0.0 1.0 0.9 0.7 0.2 1.2
13. NE Atlantic (N) −1.5 0.9 0.0 0.9 0.4 1.0 1.1 2.9
Literature values of netPP are from:aJoint and Pomeroy (1993);bNorth Sea Quality Status Report (1993);cSteel (1956);dGowen and Bloomfield (1996);eGowen et al. (2000);
fJoint et al. (2001);gRydberg et al. (2006).
underestimate the annual netPP (in both ERA40 and CN-TRL), for the reasons noted above. Compared with the NOR-WECOM and ECOHAM1 models in the North Sea (Sko-gen and Moll, 2000), POLCOMS-ERSEM, produces similar netPP values in the Southern, Central and Northern North Sea, but does not show the large values (∼200 g Cm2yr−1) seen in outer shelf regions of NORWECOM. POLCOMS-ERSEM shows coastal values that are closer to the (higher) values in NORWECOM than ECOHAM1, but has a less marked netPP minimum in the Central North Sea than NOR-WECOM (being closer to ECOHAM1 here).
Since ocean-shelf exchange is central to this work, some quantification of the uncertainty in this is important. The
salinity observations provide a useful guide to the general uncertainty by considering the fluxes into and out of a well mixed sea region using the LOICZ budgeting methodology (Gordon Jr., et al., 1996). While the validity of the assump-tion of a well mixed sea is open to some quesassump-tion, it is ad-equate for an approximate bias estimation. Using this ap-proach, the mean on-shelf salinity,S, is given by:
S=QSo+Fs Q+Qr
, (1)
where Q, Qr are the oceanic and riverine inflow volume
δQ Q ≈
δS So−S
− δSo So−S
S So
, (3)
for the caseQ≫QrandSoQ≫Fs, as is appropriate here.
This analysis is applicable on a time scale over which the shelf can be considered well mixed, i.e. decades (see Sect. 4). Hence, it is appropriate to estimate a mean bias rather than provide information on errors in variability. We use bias estimation described above for the whole shelf and region 12 (southern section of NE Atlantic) to obtain mean errors (model minus observation) for ERA40 of δS=0.063 and δSo= −0.19, and observed valuesS=34.32 andSo=35.56.
This gives a mean bias of 21.7 % for the ocean-shelf ex-change (model transport too large). It is interesting to note that this bias in transport compensates a negative bias in ocean salinity to give on-shelf salinity with a lower bias than either. Repeating with CNTRL givesδS=0.37 and δSo=0.02, and a mean bias in the transport of 30.0 %. The
consistency between the biases in these two experiments (in sign and general magnitude), despite differing regional salin-ity errors, lends credence to this approach. The ocean-shelf shelf exchange considered here (of 2.6Sv, adding inflow and outflow separately; see Table 3 and Huthnance et al, 2009) corresponds to∼1.3 m2s−1 of exchange per length of the
slope (∼2000 km). This falls within the range estimated for slope currents (Ekman drain) of 0.5–2 m2s−1by Huthnance
et al. (2009), but is a significant underestimate (by a factor of 2) when other processes that are more variable, (e.g. internal tides) are added together. The salinity estimate of bias sug-gests these processes are not simply additive, as is also noted by Huthnance et al. (2009).
3 Present day and potential future primary production
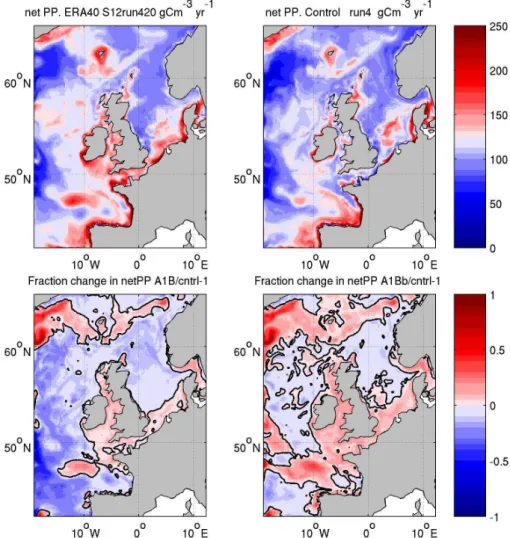
The mean annual net primary production for ERA40 and CN-TRL is shown in Fig. 4 along with the fractional difference between A1B and CNTRL, and between A1Bb and CNTRL. The ERA40 and IPSL-CM4 forced simulations show very similar spatial patterns of netPP (r2=0.95). They differ in magnitude, particularly around the coast of Ireland, in the Celtic and Irish Seas, the English Channel and South-ern North Sea. As noted above, the CNTRL simulation underestimates the primary production in all these areas com-pared with ERA40.
The A1B simulation shows a reduction in netPP in most of the open-ocean regions, the shelf edge, Northern and Cen-tral North Sea. This decrease ranges from∼20 % in Biscay to<5 % in Central North Sea. The primary production in-creases in Celtic Sea, Irish Sea, Southern North Sea and west
The experiment without using PISCES boundary nutrient data (A1Bb) shows a very different picture: an increase in netPP across much of the domain of typically 0–20 %, except in the Central and Northern North Sea, the southwest corner and the central open-ocean region, where there is a decrease of typically 0–20 %. We should keep in mind that this is a rather artificial experiment, since the boundary conditions are constrained towards present day values and so are constantly out of balance with the response of the open-ocean regions to local forcing.
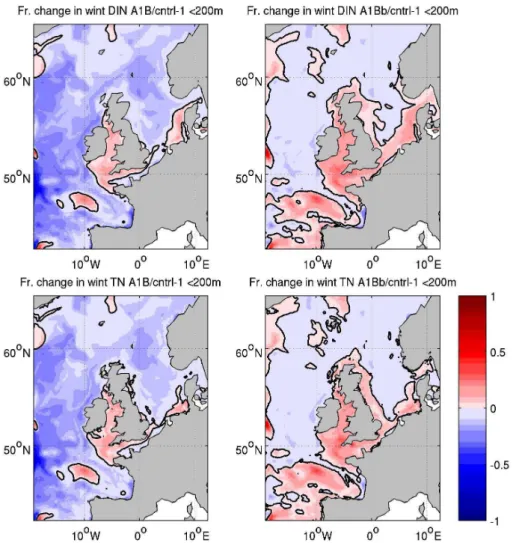
To explain these changes in netPP we turn to the nitrogen dynamics in the model. Figure 5 shows the fractional change in winter dissolved inorganic nitrogen (DIN; in ERSEM this is just nitrate and ammonia, other species of inorganic nitro-gen are not considered) and winter mean total N (TN; pelagic DIN, dissolved and particulate organic nitrogen, DON and PON, and benthic N in water less than 200 m deep) between CNTRL and both A1B and A1Bb. Again integrations are limited to 200 m depth. Between A1B and CNTRL, the DIN concentration across the whole northeast Atlantic (as included in this domain) is decreased by 5–50 %. The ex-ceptions are some localised patches that show a 0–10 % in-crease and the Norwegian Sea, which shows a 0–5 % de-crease. These changes are reflected across much of the con-tinental shelf. However, the Irish, Celtic, Northern English Channel and Southern North Sea all show an increase in DIN of between 0 and 15 %. What is interesting to note is that this increase is also apparent in the total nitrogen inventory. It is not simply a redistribution of N, as might be expected by simply increasing recycling rates. The pattern of winter DIN change generally matches the netPP change; this is quanti-fied below. The regions of positive netPP change are gener-ally more extensive than the regions of positive DIN change and the band of increased netPP across the northern part of the domain is accompanied by a general reduction in winter DIN. When the change between CNTRL and A1Bb is con-sidered the reduction in winter DIN largely disappears and is replaced by a modest increase to the south of the domain and across much of the shelf. Again this change is reflected in the total N inventory. The pattern of DIN change matches the change in netPP on shelf, but is less clear in the open-ocean.
Fig. 4. Depth integrated annual mean net primary production (top): ERA40 (left); CNTRL (right); fractional change (bottom) between CNTRL and A1B (left); between CNTRL and A1Bb (right).
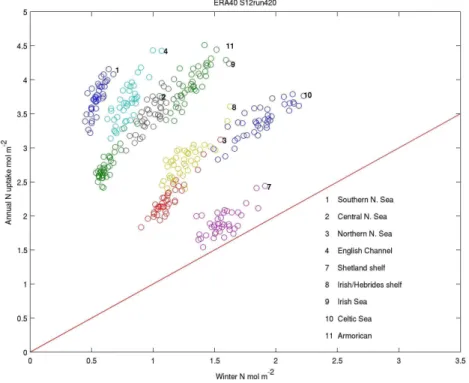
aid the interpretation and because it removes the small scale variability, which may be less reliably modelled than the larger scale properties. For example, Shutler et al. (2011) use wavelet analysis to show model skill increases consid-erably (compared with satellite estimates of chlorophyll) as scale increases beyond the grid resolution. Some care is needed however, as aggregation does obscure some impor-tant biogeographic features such as fronts and coastal cur-rents. Hence we now consider results integrated over the 13 regions shown in Fig. 1. Turning first to ERA40, Fig. 6 com-pares the total DIN uptake in nine of these with the available winter DIN. It clearly shows that the winter DIN provides a lower bound on the total uptake. There is excess production beyond this initial supply ranging from∼20 % on the Shet-land Shelf to∼4 times in the Southern North Sea. At this degree of aggregation all regions are nutrient limited and the properties of any coastal light limited regions are hidden in this averaging. This excess production reflects the various re-supply mechanisms active over the seasonal cycle including
cross-pycnocline mixing, pelagic and benthic recycling, and riverine and atmospheric nutrient inputs. Annual values for all 40 yr of simulation are shown in this figure. These show a positive correlation between the variability in winter nutri-ents and annual DIN uptake, although the variability in the uptake tends to be larger.
netPP Winter DIN Frac. P. Recyc. Frac. B. Recyc. Frac. Diff. Season
(g C m−2) (mol N m−2) (yr−1) (yr−1) (yr−1) (days)
CNTL FC % CNTL FC % CNTL FC % CNTL FC % CNTL FC % CNTL FC %
1. S. North Sea 129 3.9 0.4 0.2 5.5 1.7 1.2 34.5 2.0 1.2 253 2.4
2. Central North Sea 121 −3.2 0.6 −7.4 3.6 5.3 1.1 6.8 1.5 -7.4 236 2.5
3. N. North Sea 112 -9.6 1.1 -13.8 1.7 6.6 0.8 3.3 0.5 -10.8 209 1.7
4. English Channel 113 2.1 0.5 2.5 4.5 0.4 0.6 12.7 1.8 −10.1 255 4.1
5. Skag./Katt. 138 3.4 1.0 −3.2 2.3 2.9 1.3 5.4 0.7 −6.6 195 3.2
6. Norwegian Trench 96 −3.9 2.4 −9.8 0.9 8.0 0.2 14.1 0.1 −32.3 208 3.4
7. Shetland Shelf 105 −10.5 1.5 −15.6 1.0 6.3 0.6 4.7 0.3 −12.8 183 2.8
8. Irish Shelf 118 −1.6 1.2 −15.1 1.8 11.4 1.0 5.6 0.5 −5.1 217 3.6
9. Irish Sea 120 11.3 0.7 12.2 3.3 1.2 0.9 17.0 1.3 −18.1 233 4.6
10. Celtic Sea 121 1.7 1.4 −2.3 1.7 7.0 0.5 10.0 0.3 −7.3 243 4.3
11. Armorican Shelf 151 −2.1 1.0 −10.6 2.4 7.9 1.4 −0.3 0.3 -9.4 303 5.5
12. NE Atlantic (S) 120 −15.1 1.9 −16.2 1.0 –2.7 – – 0.1 −40.7 261 11.8
13. NE Atlantic (N) 103 −5.4 2.6 −12.4 0.6 5.6 – – 0.2 −25.2 168 4.2
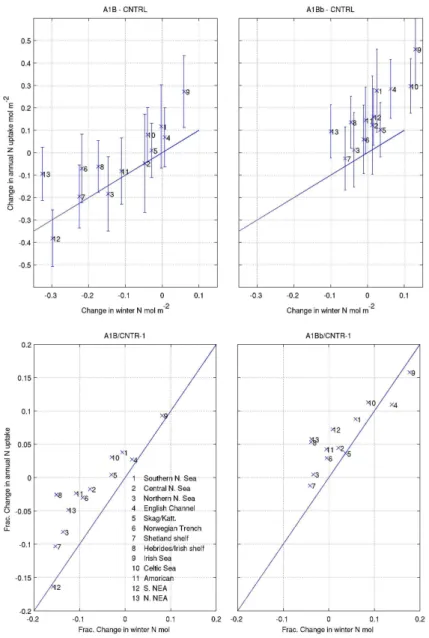
regions show a change in DIN uptake that is more posi-tive than the change in winter DIN would suggest. When the oceanic nutrients are constrained to present day values through only using WOA data (and not the OA-GCM model data) at the boundaries (A1Bb; Fig. 7), there is a marked change. In all the regions the decreases in winter DIN are re-duced and correspondingly the change in DIN uptake is more positive. Some regions still show a weak reduction in DIN because the constraint to present day values is not absolute; oceanic nutrient concentrations still adjust to local meteoro-logical forcing. However, all regions now show an increase in DIN uptake between CNTRL and A1B, except the Shet-land shelf (which shows a∼1.5 % decrease).
There are various other drivers that act alongside the ef-fects of reduced winter nutrient concentrations. To put these changes in context we now considered some of these other effects in summary. Table 2 shows a range of metrics (see caption for definitions) comparing the CNTRL value and the fraction change between A1B and CNTRL for the 13 regions shown in Fig. 1. The fraction of the total pelagic and ben-thic nitrogen recycled each year is seen to increase between these two experiments, except in Southern NE Atlantic, by up to 11.4 % on the Irish Shelf in the pelagic, and 34.5 % in the Southern North Sea in the benthic; this is the bacterial response to rising temperatures. Alongside this, the grow-ing season is also seen to increase by typically 4 %, mainly due to an earlier spring bloom (by∼7 days), rather than a later end to the growing season (∼2 days). These positive effects are off-set by an increase in seasonal stratification,
quantified by the fraction of the total pelagic nitrogen (TPN) diffused across a layer defined by the 10 % light level, dur-ing summer. This is seen to decrease in all regions (except the Southern North Sea, which is strongly mixed), and is particularly strong in the deep water regions (between 25– 40 % in the NE Atlantic and Norwegian Trench). While these metrics show the expected response, quantitatively re-lating them with each other and to the overall change in netPP is not so straightforward because of non-linear interactions, other drivers and the importance of detailed temporal (e.g. seasonal) and spatial (e.g. above/below thermocline) varia-tion. For example, in the Southern North Sea a modest in-crease in netPP is seen, compared with the large inin-crease in benthic recycling, possibly because light limitation plays a role in these near-coastal waters. The Central and North-ern North Sea, Skagerrak/Kattegat, Norwegian Trench, and Shetland/Irish shelf all show a decrease in netPP significantly less than the decrease in winter N would suggest, indicating that the temperature and growing season effects outweigh the stratification effects in these regions.
Fig. 5.Fractional change in winter DIN and total N comparing A1B and A1Bb with CNTRL.
4 Ocean-shelf nutrient transport
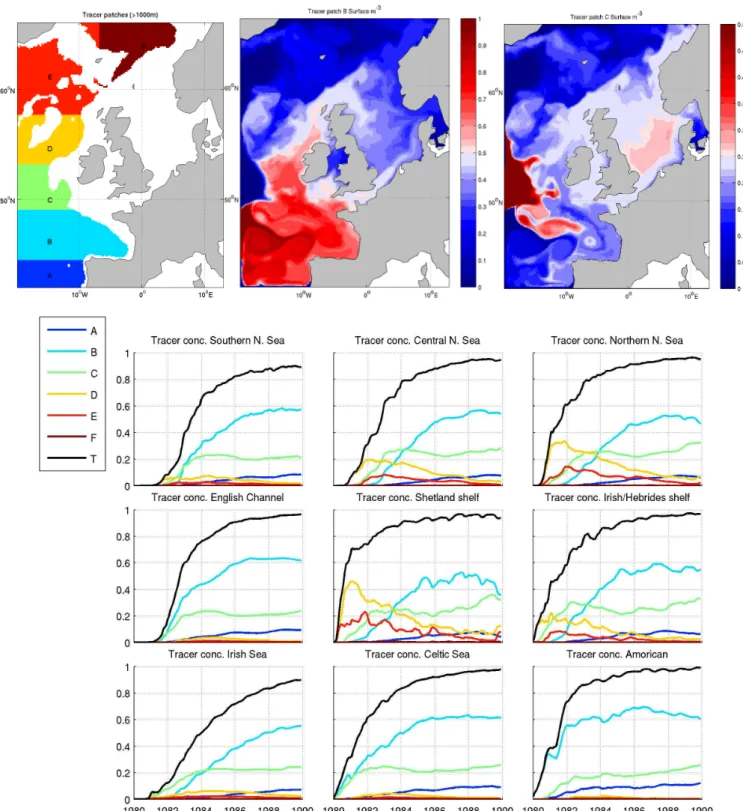
Before considering the on-shelf nutrient transport in the full POLCOMS-ERSEM model, it is insightful to explore the ocean-shelf water transport using a passive tracer experi-ment. Here we introduce 6 tracer patches in experiment ERA40 from January 1980 to December 1990, with the ob-jective of identifying the general regions of origin of the on-shelf water. Initial value is 1 m−3throughout the water
col-umn in total water depths deeper than 1000 m, as shown in Fig. 8, along with example tracer fields after 5 yr of integra-tion from two of the patches. Time series of mean concentra-tions in 9 of the regions shown in Fig. 1 (Fig. 8) demonstrate how water from different oceanic regions impinges on-shelf. Riverine and Baltic water is introduced with zero concentra-tion, so the total tracer concentration gives a good indication of the oceanic influence in each region. Open boundary con-centrations are fixed at unity, so oceanic concon-centrations are replenished on inflow with water of the original patch in that location.
Fig. 6.Total annual DIN uptake and previous winter mean DIN, averaged for the on-shelf regions shown in Fig. 1 for ERA40.
it is apparent that both of these pathways are active, but the transport into the Celtic Seas from patch B is slow. This may well reflect our inability to resolve the pertinent shelf-exchange processes active in this region with this coarse res-olution model (see Huthnance, 1995). Figure 8a also shows transport into the Southern North Sea from B and C occurs via the Celtic Sea and Dover Straits route before the northern route.
To explore the detailed spatial structure of the ocean-shelf transport, fluxes of DIN across the shelf break (defined by the 200 m isobath; Fig. 9) are calculated from monthly mean model output of the layer integrals ofu·DIN, where,uis the velocity normal to the 200 m isobaths, with on-shelf values being positive. These are time averaged during the model simulation and so include both mean and fluctuating (e.g. tidal residual) components but do not include any numeri-cal diffusion arising from the advection scheme. A passive tracer horizontal diffusion term is not explicitly included in this model (Holt and James, 2001). The northwest European continental shelf has an overall downwelling circulation with water being brought on-shelf at the surface and leaving at depth (Holt et al., 2009), both in the large scale circulation and the surface and benthic Ekman layers. These layers are associated, respectively, with the wind driven circulation and the slope current. This downwelling circulation is reflected by the overall DIN transport across the shelf break. When the change in DIN transport between the time-slices is consid-ered (Fig. 9), a reduction in mean DIN transport on-shelf is apparent around the whole shelf break from 53◦
N to 61.3◦ N,
with only localised increases. This arises primarily from a substantial reduction in DIN around the shelf break above ∼80 m depth, owing to a reduction in oceanic surface DIN. There is a small reduction in volume flux between these ex-periments. This is particularly noticeable where the slope current intrudes on-shelf at∼54.5◦N in the region of Porcu-pine bank.
The on-shelf nutrient flux has a strong seasonal signal; for example, the mean N flux above 150 m for the length of shelf break shown in Fig. 9 is 4.0 mmol N m−1s−1between
December and March, compared with 2.2 mmol N m−1s−1
from April to November. This arises both because of de-pleted surface nutrients in the growing season and increased currents in the winter. In contrast the off-shelf transport near-bed shows little seasonal variation. This confirms its identification as an Ekman drain under the continuous slope current as opposed to a density cascade, which would be a predominantly winter phenomenon.
4.1 Shelf wide context of ocean shelf exchange
We can summaries the shelf wide impacts of changes in ocean-shelf exchange by considering the various terms in the N equation for pelagic DIN (Ni), total organic N (TON; No)
and benthic N (NB):
dNi
dt =Ai−P+R+Bi+Fr+Fa (4) dNo
Fig. 7.Total annual DIN uptake and winter mean DIN compared with CNTRL, averaged for the regions shown in Fig. 1 for A1B (left) and A1Bb (right). Absolute and fractional differences are shown in top and bottom panels. Error bars indicate the inter-annual variability of the DIN uptake.
dNB
dt =Bo−Bi−D (6)
Here we amalgamate the full model equations (shown schematically in Fig. 2) to give:
– Ai,oAdvective flux divergence (inorganic, organic5)
– P Pelagic phytoplankton uptake – RPelagic recycling
– BiBenthic recycling
5includes implicit riverine organic N input
– BoNet benthic PON inputs (settling plus filter feeders
minus resuspension) – DBenthic dentrification – FrRiver DIN inputs
– FaAtmospheric DIN inputs
We only consider depth integrals here, so no vertical diffu-sion term is needed. We also integrate horizontally over two on-shelf regions (depth<200 m) north of 48◦
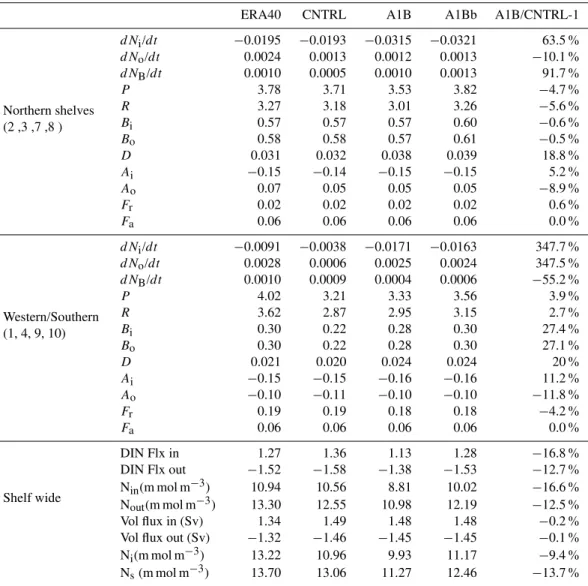
Table 3. Regional integrals of terms in the pelagic DIN (Ni), TON (No) and benthic N (NB) equation (Eqs. 4, 5, 6) and average transports across sections with net flow into and out of the region. Also shown is output from a mixing model calculation (Eq. 7). Values are in G mol day−1except where indicated.
ERA40 CNTRL A1B A1Bb A1B/CNTRL-1
Northern shelves
dNi/dt −0.0195 −0.0193 −0.0315 −0.0321 63.5 %
(2 ,3 ,7 ,8 )
dNo/dt 0.0024 0.0013 0.0012 0.0013 −10.1 %
dNB/dt 0.0010 0.0005 0.0010 0.0013 91.7 %
P 3.78 3.71 3.53 3.82 −4.7 %
R 3.27 3.18 3.01 3.26 −5.6 %
Bi 0.57 0.57 0.57 0.60 −0.6 %
Bo 0.58 0.58 0.57 0.61 −0.5 %
D 0.031 0.032 0.038 0.039 18.8 %
Ai −0.15 −0.14 −0.15 −0.15 5.2 %
Ao 0.07 0.05 0.05 0.05 −8.9 %
Fr 0.02 0.02 0.02 0.02 0.6 %
Fa 0.06 0.06 0.06 0.06 0.0 %
Western/Southern
dNi/dt −0.0091 −0.0038 −0.0171 −0.0163 347.7 %
(1, 4, 9, 10)
dNo/dt 0.0028 0.0006 0.0025 0.0024 347.5 %
dNB/dt 0.0010 0.0009 0.0004 0.0006 −55.2 %
P 4.02 3.21 3.33 3.56 3.9 %
R 3.62 2.87 2.95 3.15 2.7 %
Bi 0.30 0.22 0.28 0.30 27.4 %
Bo 0.30 0.22 0.28 0.30 27.1 %
D 0.021 0.020 0.024 0.024 20 %
Ai −0.15 −0.15 −0.16 −0.16 11.2 %
Ao −0.10 −0.11 −0.10 −0.10 −11.8 %
Fr 0.19 0.19 0.18 0.18 −4.2 %
Fa 0.06 0.06 0.06 0.06 0.0 %
Shelf wide
DIN Flx in 1.27 1.36 1.13 1.28 −16.8 %
DIN Flx out −1.52 −1.58 −1.38 −1.53 −12.7 %
Nin(m mol m−3) 10.94 10.56 8.81 10.02 −16.6 %
Nout(m mol m−3) 13.30 12.55 10.98 12.19 −12.5 %
Vol flux in (Sv) 1.34 1.49 1.48 1.48 −0.2 %
Vol flux out (Sv) −1.32 −1.46 −1.45 −1.45 −0.1 %
Ni(m mol m−3) 13.22 10.96 9.93 11.17 −9.4 %
Ns(m mol m−3) 13.70 13.06 11.27 12.46 −13.7 %
Table 3. This shows that in all runs the model is close to equi-librium withdNi,o,B/dt being the smallest terms. The
inor-ganic trend term is consistently negative, whereas the orinor-ganic and benthic terms are positive, indicating a slow adjustment in the model towards equilibrium. This may well represent the benthic sub-model adjusting on much slower timescales than the pelagic. The terms in CNTRL and ERA40 generally agree well, especially in the northern region. The primary balance in the inorganic system is between the net pelagic uptake, −P +R, and the flux from the benthic sub-model, Bi. The net loss through advection is similar in both groups
of region, but the river sources are substantially greater in the western/southern regions. Comparing A1B and CNTRL in the northern region, the balance remains generally un-changed; the decrease inP is matched by a decrease inR
(the net pelagic uptake changes by only 2 %), the benthic system shows little change and a small increase in advec-tive loss matches the change in the trend term. Similarly the organic system remains in close balance. The western and southern regions show a somewhat different pattern. The net pelagic uptake increases (i.e. becomes more autotrophic) by ∼12 % and the cycling through the benthic system increases by∼27 %.
Considering the results integrated across the whole of the NWS (Table 3), the mean DIN, Ni, decreases by ∼9 %
Fig. 9.Mean volume flux, DIN flux and DIN concentration at 200 m isobath (representing the shelf break), projected on to latitude: CNTRL (left); A1B minus CNTRL (right). Positive values indicate an on-shelf flux.
proportion to the decrease in DIN concentration at the shelf edge (Nin and Nout), since the changes in volume flux are
only small.
It is useful to compare the modelled on-shelf nutrient concentration with that predicted by a simple “mixing-box” model (Gordon et al., 1996). Here we assume river and oceanic water enters the region with volume fluxesQr,oand
nutrient concentrations, Nr,o. This water is well-mixed on
the shelf to give a concentration, Ns, which leaves the shelf
with volume fluxQo+Qr(to give a constant volume). The
steady-state concentration (including the area averaged at-mospheric input,Fa) is then given by:
Ns=
QoNo+QrNr+Fa
Qo+Qr
. (7)
Values for Ns calculated with the ocean in-flow and
in proportion with each other. The values from this very sim-ple calculation agree reasonably well with the full model, with Nsbeing consistently greater than Niowing to
biologi-cal activity. The change between the time-slices is over pre-dicted by the simple model as biogeochemical processes act to reduce the magnitude of change that this simple, steady state, passive model suggests.
5 Discussion and conclusions
Changes in oceanic nutrients are clearly demonstrated here to be a first order factor in determining changes in on-shelf primary production on time scales of 5–10 yr. While it has long been known that oceans supply a substantial fraction of shelf sea nutrients (e.g. Galloway et al., 1996), the conse-quences for on-shelf primary production of potential future changes has not up until now been clearly articulated. The importance of changes in oceanic nutrient inputs is generally supported by a simple mixing model, so is robust and not sen-sitive to the details of the coupled hydrodynamic-ecosystem model we employ. However, while shelf sea regions are vul-nerable to changes in oceanic nutrient inputs, there are sev-eral on-shelf processes that mitigate this and the changes are generally less than either a simple passive tracer or nutrient based analysis would suggest. Generally shelf regions that are most directly exposed to ocean-shelf exchange show a strong reduction in primary production, whereas those where the exchange is slower show a weaker reduction or a net in-crease. Examples of the former include Irish, Hebrides and Shetland Shelves, and the Northern and Central North Sea. Examples of less controlled regions are the English Chan-nel, Irish Sea, Celtic Sea and Southern North Sea. Hjøllo et al. (2009) also find a distinction between the Northern and Southern North Sea’s response to external forcing, in that case the North Atlantic Oscillation.
The mitigation of reduced on-shelf nutrient transport arises from changes in temperature that lead to increased re-cycling rates in both the pelagic and benthic systems (Ta-ble 2). These temperature changes also lead to increased on-shelf stratification, which in turn leads to reduced cross-pynocline nutrient flux into the euphotic zone and lengthened growing season (Table 2). Simply comparing the fractional changes in Table 2 suggests the former dominates. That the reduction in netPP by stratification effects is offset by temperature and growing season effects is confirmed by the boundary condition perturbation experiment (A1Bb) show-ing a general increase in netPP across the shelf, except in the Central/Northern North Sea, where the net change is small. We also note that the total nitrogen inventory is seen to in-crease in some regions, comparing A1B and CNTRL. This cannot simply be a recycling phenomenon, but must involve a process of nutrient capture. This necessarily involves mate-rial in the particulate phase. The concentration of dissolved material cannot accumulate, and the boundary concentrations
here are decreasing. In contrast, the particulate phase can accumulate, as it does not necessarily move with the water. This, along with the temperature and stratification effects de-serves a much more detailed investigation than can be given here. These mitigation processes will be diagnosed in more detail in future model experiments. They will be explored both in the context of overall primary production changes and with regards to changes to the seasonality, which are po-tentially important both to phytoplankton production and to higher trophic levels. Similarly we highlight here the impor-tance of the benthic component of the model in these sim-ulations, but this is one of the least well-established areas of marine ecosystem modelling. This component was val-idated during the original development of ERSEM (Black-ford, 1997), however, lack of data has generally prevented much subsequent progress.
It is important to reiterate that here we have only consid-ered a single realisation of possible future conditions. So while we can explore the response of the system to this physically plausible case, we can say little about the likeli-hood of that case. For example, the details of the change in oceanic stratification and the consequences for oceanic nutrients might be expected to be a particular area of un-certainty because of the general uncertainties in accurately modelling the seasonal cycle of upper ocean mixing (e.g. Sinha et al., 2010). Hence, an important next step in this work is to explore the uncertainty in these conclusions. This uncertainty arises from a combination of factors: forcing certainty arises because of the structural and parameter un-certainty in OA-GCMs and unun-certainty in the emissions sce-nario (Hawkins and Sutton, 2009). This is compounded by the difficulty in isolating a clear climate change signal against the background of natural variability (e.g. Table 2). Along-side this are uncertainties in the coastal-ocean hydrodynamic and ecosystem models themselves. Hence, while the natural next step is to consider forcing data from several OA-GCMs (and such work is underway in the EQUIP project6) and build an ensemble of downscaled models, this only gives a partial view of the uncertainty and the structural uncertainty in the coastal-ocean model must be considered in some detail. For example, the details of the division of the shelf sea regions into those where the netPP is dependent on oceanic control and those where local processes are more important is likely to be sensitive to the choice of model and forcing (charac-terised by the zero-fractional-change contour in Fig. 4). Here we use an ecosystem model with a sophisticated representa-tion of pelagic and benthic recycling, and we can speculate that a model without, for example, explicit representation of bacteria or dynamic stochiometric ratios, would give very different results. Similarly, the ERSEM model has a static foodweb with fixed interaction strengths between predators and prey, with no ability to simulate changes in behaviour or food preference. This lack of “plasticity”, necessarily limits
resentation of ocean-shelf exchange in regions, such as the Celtic Sea, where this is dominated by fine scale processes that are not represented in the model, such as internal tides (Sharples et al., 2009). Capturing the uncertainty associated with differing process representation constitutes a substantial challenge for downscaling climate change impacts on marine ecosystems.
Here we are primarily demonstrating the principles using the “blunt instrument” of a future climate change scenario to provide a self-consistent set of forcing. Of equal importance and inherently more testable against observations would be an analysis of the relative oceanic and local controls arising from climate variability in the ERA40 simulation. This is underway in a more in depth analysis of the propagation of signals through the pelagic and benthic systems and will be reported on in due course.
These results suggest that the model considered here is minimal in its spatial extent for investigations of future cli-mate downscaling in many regions of the northwest Euro-pean Continental shelf: models that do not adequately repre-sent changes in ocean-shelf nutrient transport (e.g. on-shelf 3-D models with fixed nutrient boundary conditions or 1-D water column models) miss an important vector of climate change for many regions. Ideally a model covering a sub-stantially larger area of the North Atlantic should be used for the climate change downscaling. Such a model is currently under development in the EURO-BASINS FP7 project7.
Acknowledgements. This work is supported by the NERC National Capability in Modelling programme at the National Oceanography Centre and the Plymouth Marine Laboratory, and Theme 6 of the EC seventh framework program through the Marine Ecosystem Evolution in a Changing Environment (MEECE No. 212085) Collaborative Project.
Edited by: C. Robinson
References
Allen, J. I., Blackford, J., Holt, J. T., Proctor, R., Ashworth, M., and Siddorn, J.: A highly spatially resolved ecosystem model for the North West European continental shelf, SARSIA, 86, 423–440, 2001.
Allen, J. I., Holt, J. T., Blackford, J. C., and Proctor, R.: Error quan-tification of a high-resolution coupled hydrodynamic-ecosystem coastal-ocean model – Part 2: Chlorophyll-a, nutrients and SPM, J. Marine Syst., 68, 381–404, 2007a.
7http://www.euro-basin.eu/
Hardman-Mountford, N., Ross, O. N., Sinha, B., and While, J.: Marine ecosystem models for earth systems applications: The MarQUEST experience, J. Marine Syst., 81, 19–33, 2010. Artioli, Y., Friedrich, J., Gilbert, A. J., McQuatters-Gollop, A.,
Mee, L. D., Vermaat, J. E., Wulff, F., Humborg, C., Palmeri, L., and Pollehne, F.: Nutrient budgets for European seas: A mea-sure of the effectiveness of nutrient reduction policies, Mar. Pol-lut. Bull., 56, 1609–1617, doi:10.1016/j.marpolbul.2008.05.027, 2008.
Artioli, Y., Blackford, J. C., Butensch¨on, M., Holt, J. T., Wakelin, S. L., and Allen, J. I.: The carbonate system of the NW European shelf: sensitivity and model validation, J. Marine Syst., in review. Aumont, O., Maier-Reimer, E., Blain, S., and Monfray, P.: An ecosystem model of the global ocean including Fe, Si, P colimitations, Global Biogeochem. Cy., 17, 1060, doi:10.1029/2001gb001745, 2003.
Bissinger, J. E., Montagnes, D. J. S., Sharples, J., and Atkinson, D.: Predicting marine phytoplankton maximum growth rates from temperature: Improving on the Eppley curve using quantile re-gression, Limnol. Oceanogr., 53, 487–493, 2008.
Blackford, J. C.: An analysis of benthic biological dynamics in a North Sea ecosystem model, J. Sea Res., 38, 213–230, 1997. Blackford, J. C., Allen, J. I., and Gilbert, F. J.: Ecosystem dynamics
at six contrasting sites: a generic model study, J. Marine Syst., 52, 191–215, 2004.
Blackford, J. C., Jones, N., Proctor, R., and Holt, J.: Regional scale impacts of distinct CO2 additions in the North Sea, Mar. Pol-lut. Bull., 56, 1461–1468, doi:10.1016/j.marpolbul.2008.04.048, 2008.
Borges, A. V.: Do we have enough pieces of the jigsaw to integrate CO2fluxes in the coastal ocean?, Estuaries, 28, 3–27, 2005. Cadee, G. C. and Hegeman, J.: Phytoplankton in the Marsdiep at
the end of the 20th Century; 30 yr monitoring biomass, primary production, and Phaeocystis blooms, J. Sea Res., 48, 97–110, 2002.
Carr, M.-E., Friedrichs, M. A. M., Schmeltz, M., Aita, M. N., Antoine, D., Arrigo, K. R., Asanuma, I., Aumont, O., Barber, R., Behrenfeld, M., Bidigare, R., Buitenhuis, E. T., Campbell, J., Ciotti, A., Dierssen, H., Dowell, M., Dunne, J., Esaias, W., Gentili, B., Gregg, W., Groom, S., Hoepffner, N., Ishizaka, J., Kameda, T., Le Qu´er´e, C., Lohrenz, S., Marra, J., Melin, F., Moore, K., Morel, A., Reddy, T. E., Ryan, J., Scardi, M., Smyth, T., Turpie, K., Tilston, G., Water, K., and Yamanaka, Y.: A com-parison of global estimates of marine primary production from ocean color, Deep-Sea Res. II, 11, 741–770, 2006.
Fairall, C. W., Bradley, E. F., Hare, J. E., Grachev, A. A., and Ed-son, J. B.: Bulk parameterization of air-sea fluxes: updates and verification for the COARE algorithm, J. Climate, 16, 571–591, 2003.
re-lating to the Norwegian Coastal Current, in: The Norwegian Coastal Current Vol. 2, edited by: Saetre, R. and Mork, M., 427– 458, 1981.
Force, N. S. T.: North Sea Quality Status Report, OSPAR, 1993. Galloway, J. N., Howarth, R. W., Michaels, A. F., Nixon, S. W.,
Prospero, J. M., and Dentener, F. J.: Nitrogen and phosphorus budgets of the North Atlantic Ocean and its watershed, Biogeo-chemistry, 35, 3–25, 1996.
Garcia, H. E., Locarnini, R. A., Boyer, T. P., and Antonov, J. I.: World Ocean Atlas 2005 – Vol. 4: Nutrients (phosphate, nitrate, silicate), Washington DC, USA, 39, 2006.
Geider, R. J., MacIntyre, H. L., and Kana, T. M.: A dynamical model of phytoplankton growth and acclimation: response of the balanced growth rate to light, nutrient limitation and temperature, Mar. Ecol.-Prog. Ser., 148, 187–200, 1997.
Gomez-Gesteira, M., Beiras, R., Presa, P., and Vilas, F.: Coastal processes in northwestern Iberia, Spain, Cont. Shelf Res., 31, 367–375, doi:10.1016/j.csr.2011.01.002, 2011.
Gordon Jr., D. C., Boudreau, P. R., Mann, K. H., ONG, J.-E., Sil-vert, W. L., Smith, S. V., Wattayakorn, G., Wulff, F., and Yanagi, T.: LOICZ Biogeochemical modelling guidlines, 1996. Gowen, R. J. and Bloomfield, S. P.: Chlorophyll standing crop and
phytoplankton production in the Western Irish Sea during 1992 and 1993, J. Plankton Res., 18, 1735–1751, 1996.
Gowen, R. J., Mills, D. K., Trimmer, M., and Nedwell, D. B.: Pro-duction and its fate in two coastal regions of the Irish Sea: the influence of anthropogenic nutrients, Mar. Ecol.-Prog. Ser., 208, 51–64, 2000.
Hawkins, E. and Sutton, R.: The potential to narrow uncertainties in regional Climate predictions, B. Am. Meteorol. Soc., 90, 1095– 1107, doi:10.1175/2009BAMS2607.1171, 2009.
Hjøllo, S. S., Skogen, M. D., and Svendsen, E.: Exploring currents and heat within the North Sea using a numerical model, J. Marine Sys., 78, 80–192, doi:110.1016/j.jmarsys.2009.1006.1001, 2009. Holt, J., Wakelin, S., and Huthnance, J.: Down-welling circulation of the northwest European continental shelf: A driving mecha-nism for the continental shelf carbon pump, Geophys. Res. Lett., 36, doi:10.1029/2009GL038997, L14602, 2009.
Holt, J., Wakelin, S., Lowe, J., and Tinker, J.: The potential impacts of climate change on the hydrography of the North-west European Continental shelf, Prog. Oceanogr., 86, 361–379, doi:10.1016/j.pocean.2010.1005.1003, 2010.
Holt, J., Hughes, S., Hopkins, J., Wakelin, S. L., Holliday, N. P., Dye, S., Hjøllo, S. S., Lavin, A., Mork, K. A., Proctor, R., Read, J., Shammon, T., Smyth, T., Tattersall, G., Ward, B., and Wilt-shire, K.: Multi-decadal variability of the temperature of the northwest European continental shelf: a model-data synthesis, in preparation.
Holt, J. T. and James, I. D.: An s-coordinate density evolving model of the North West European Continental Shelf – Part 1: Model description and density structure, J. Geophys. Res., 106, 14015-14034, 2001.
Holt, J. T. and Proctor, R.: The seasonal circulation and vol-ume transport on the northwest European continental shelf: a fine-resolution model study, J. Geophys. Res., 113, C06021, doi:10.1029/2006JC004034, 2008.
Holt, J. T., Proctor, R., Blackford, J. C., Allen, J. I., and Ashworth, M.: Advective controls on primary production in the stratified western Irish Sea: an eddy-resolving model study, J. Geophys.
Res., 109, C05024, doi:10.1029/2003JC001951, 2004.
Holt, J. T., Allen, J. I., Proctor, R., and Gilbert, F.: Error quan-tification of a high resolution coupled hydrodynamic-ecosystem coastal-ocean model – Part 1: Model overview and assessment of the hydrodynamics, J. Marine Sys., 57, 167–188, 2005. Huisman, J., van Oostveen, P., and Weissing, F. J.: Critical depth
and critical turbulence: Two different mechanisms for the devel-opment of phytoplankton blooms, Limnol. Oceanogr., 44, 1781– 1787, 1999.
Huthnance, J. M.: Circulation, exchange and water masses at the ocean margin: the role of physical processes at the shelf edge, Prog. Oceanogr., 35, 353–431, 1995.
Huthnance, J. M.: North Sea interaction with the North Atlantic Ocean, Deutsche Hydrographische Zeitschrift, 49, 153–162, 1997.
Huthnance, J. M., Holt, J. T., and Wakelin, S. L.: Deep ocean ex-change with west-European shelf seas, Ocean Sci., 5, 621–634, 2009,
http://www.ocean-sci.net/5/621/2009/.
Hydes, D. J., Gowen, R. J., Holliday, N. P., Shammon, T., and Mills, D.: External and internal control of winter concentrations of nu-trients (N, P and Si) in Northwest European shelf seas, Estuar. Coast. Shelf Sci., 59, 151–161, doi:10.1016/j.ecss.2003.08.004, 2004.
Joint, I. and Pomeroy, A.: Phytoplankton Biomass and Production in the Southern North-Sea, Mar. Ecol.-Prog. Ser., 99, 169–182, 1993.
Joint, I., Wollast, R., Chou, L., Batten, S., Elskens, M., Edwards, E., Hirst, A., Burkill, P., Groom, S., Gibb, S., Miller, A., Hydes, D., Dehairs, F., Antia, A., Barlow, R., Rees, A., Pomroy, A., Brock-mann, U., Cummings, D., Lampitt, R., Loijens, M., Mantoura, F., Miller, P., Raabe, T., Alvarez-Salgado, X., Stelfox, C., and Woolfenden, J.: Pelagic production at the Celtic Sea shelf break, Deep-Sea Res. II – Top. Stud. Oceanogr., 48, 3049–3081, 2001. Kuhn, W., Patsch, J., Thomas, H., Borges, A. V., Schiettecatte, L.
S., Bozec, Y., and Prowe, A. E. F.: Nitrogen and carbon cycling in the North Sea and exchange with the North Atlantic-A model study – Part 2: Carbon budget and fluxes, Cont. Shelf Res., 30, 1701–1716, doi:10.1016/j.csr.2010.07.001, 2010.
Lenhart, H. J., Mills, D. K., Baretta-Bekker, H., van Leeuwen, S. M., van der Molen, J., Baretta, J. W., Blaas, M., Desmit, X., Kuhn, W., Lacroix, G., Los, H. J., Menesguen, A., Neves, R., Proctor, R., Ruardij, P., Skogen, M. D., Vanhoutte-Brunier, A., Villars, M. T., and Wakelin, S. L.: Predict-ing the consequences of nutrient reduction on the eutrophica-tion status of the North Sea, J. Marine Syst., 81, 148–170, doi:10.1016/j.jmarsys.2009.12.014, 2010.
Lewis, K., Allen, J. I., Richardson, A., J, and Holt, J. T.: Error quan-tification of a high resolution coupled hydrodynamic-ecosystem coastal-ocean model – Part 3: Validation with Continuous Plank-ton Recorder data, J. Marine Syst., 63, 209–224, 2006.
Mariani, P. and Visser, A. W.: Optimisation and emergence in ma-rine ecosystem models., Prog. Oceanogr., 84, 89–92, 2010. Marti, O., Braconnot, P., Bellier, J, R, B., Bony, S., Brockmann, P.,
bon of the European continental rivers for the years 1977–2002, Berichte aus dem Zentrum f¨ur Meeres- und Klimaforschung; Reihe B: Ozeanographie, 48, 159pp., 2004.
P¨atsch, J. and Kuhn, W.: Nitrogen and carbon cycling in the North Sea and exchange with the North Atlantic – A model study – Part I: Nitrogen budget and fluxes, Cont. Shelf Res., 28, 767– 787, doi:10.1016/j.csr.2007.12.013, 2008.
Pingree, R. D., Sinha, B., and Griffiths, C. R.: Seasonality of the eu-ropean slope current (Goban Spur) and ocean margin exchange, Cont. Shelf Res., 19, 929–975, 1999.
Proctor, R., Holt, J. T., Allen, J. I., and Blackford, J. C.: Nutrient fluxes and budgets for the North West European Shelf from a three-dimensional model, Sci Total Environ., 314–316, 769–785, 2003.
Rydberg, L., Aertebjerg, G., and Edler, L.: Fifty years of primary production measurements in the Baltic entrance region, trends and variability in relation to land-based input of nutrients, J. Sea Res., 56, 1–16, doi:10.1016/j.seares.2006.03.009, 2006. Sarmiento, J. L., Slater, R., Barber, R., Bopp, L., Doney, S. C.,
Hirst, A. C., Kleypas, J., Matear, R., Mikolajewicz, U., Monfray, P., Soldatov, V., Spall, S. A., and Stouffer, R.: Response of ocean ecosystems to climate warming, Global Biogeochem. Cy., 18, Gb3003, doi:10.1029/2003gb002134, 2004.
Schrum, C., Hubner, U., Jacob, D., and Podzun, R.: A coupled at-mosphere/ice/ocean model for the North Sea and the Baltic Sea, Clim. Dynam., 21, 131–151, doi:10.1007/s00382-003-0322-8, 2003.
Sharples, J.: Potential impacts of the spring-neap tidal cycle on shelf sea primary production, J. Plankton Res., 30, 183–197, 2008.
Sharples, J., Ross, O. N., Scott, B. E., Greenstreet, S. P. R., and Fraser, H.: Inter-annual variability in the timing of stratification and the spring bloom in the Northwestern North Sea, Cont. Shelf Res., 26, 733–751, 2006.
Sharples, J., Moore, C. M., Hickman, A. E., Holligan, P. M., Twed-dle, J. F., Palmer, M. R., and Simpson, J. H.: Internal tidal mixing as a control on continental margin ecosystems, Geophys. Res. Lett., 36, L23603, doi:10.1029/2009gl040683, 2009.
Shutler, J. D., Smyth, T. J., Saux-Picart, S., Wakelin, S. L., Hyder, P., Orekhov, P., Grant, M. G., Tilstone, G. H., and Allen, J. I.: Evaluating the ability of a hydrodynamic ecosys-tem model to capture inter- and intra-annual spatial characteris-tics of chlorophyll-ain the Northeast Atlantic., J. Marine Syst., 88, 169–182, 2011.
Siddorn, J. R., Allen, J. I., Blackford, J. C., Gilbert, F. J., Holt, J. T., Holt, M. W., Osborne, J. P., Proctor, R., and Mills, D. K.: Modelling the hydrodynamics and ecosystem of the North-West European continental shelf for operational oceanography, J. Ma-rine Syst., 65, 417–429, 2007.
Sinha, B., Buitenhuis, E. T., Quere, C. L., and Anderson, T. R.: Comparison of the emergent behavior of a complex ecosystem model in two ocean general circulation models, Prog. Oceanogr., 84, 204–224, 2010.
Smith, G. and Haines, K.: Evaluation of the S(T) assimilation method with the Argo dataset, Q. J. Roy. Meteorol. Soc., 135, 739–756, 2009.
Smyth, T. J., Tilstone, G. H., and Groom, S. B.: Integra-tion of radiative transfer into satellite models of ocean pri-mary production, J. Geophys. Res.-Oceans, 110, C10014, doi:10.1029/2004jc002784, 2005.
Song, Y. and Haidvogel, D.: A semi-implicit ocean circulation model using a generalized topography-following coordinate sys-tem, J. Comput. Phys., 115, 228–244, 1994.
Steele, J. H.: Plant pproduction on the Fladen Ground, Journal of Marine Biology Association UK, 35, 1-3, 1956.
Steinacher, M., Joos, F., Fr¨olicher, T. L., Bopp, L., Cadule, P., Cocco, V., Doney, S. C., Gehlen, M., Lindsay, K., Moore, J. K., Schneider, B., and Segschneider, J.: Projected 21st century decrease in marine productivity: a multi-model analysis, Bio-geosciences, 7, 979–1005, doi:10.5194/bg-7-979-2010, 2010. Stow, C. A., Jolliff, J., McGillicuddy, D. J., Doney, S. C.,
Allen, J. I., Friedrichs, M. A. M., Rose, K. A., and Wall-headg, P.: Skill assessment for coupled biological/physical models of marine systems, J. Marine Syst., 76, 4–15, doi:10.1016/j.jmarsys.2008.03.011, 2009.
Taucher, J. and Oschlies, A.: Can we predict the direction of ma-rine primary production change under global warming?, Geo-phys.Res. Lett., 38, L02603, doi:10.1029/2010gl045934, 2011. Thomas, H., Bozec, Y., Elkalay, K., and de Baar, H. J. W.: Enhanced
Open Ocean Storage of CO2from Shelf Sea Pumping, Science, 304, 1005–1008, 2004.
Vermaat, J. E., McQuatters-Gollop, A., Eleveld, M. A., and Gilbert, A. J.: Past, present and future nutrient loads of the North Sea: Causes and consequences, Estuar. Coast. Shelf S., 80, 53–59, doi:10.1016/j.ecss.2008.07.005, 2008.
V¨or¨osmarty, C. J., Fekete, B. M., Meybeck, M., and R., L.: A simu-lated topological network representing the global system of rivers at 30 min spatial resolution (STN-30), Global Biogeochem. Cy., 14, 599–621, 2000.
Wakelin, S. L., Holt, J. T., and Proctor, R.: The influence of ini-tial conditions and open boundary conditions on shelf circulation in a 3-D ocean-shelf model of the North East Atlantic, Ocean Dynam., 59, 67–81, doi:10.1007/s10236-10008-10164-10233, 2009.
Wakelin, S. L., Holt, J. T., Blackford, J. C., Allen, J. I., Butenschon, M., and Artioli, Y.: Modelling the carbon fluxes of the Northwest European Continental Shelf: validation and budgets, J. Geophys. Res., in review.
Watson, R. and Pauly, D.: Systematic distortions in world fisheries catch trends, Nature, 414, 534–536, 2001.