www.atmos-chem-phys.net/10/695/2010/ © Author(s) 2010. This work is distributed under the Creative Commons Attribution 3.0 License.
Chemistry
and Physics
Effects of boundary layer particle formation on cloud droplet
number and changes in cloud albedo from 1850 to 2000
J. Merikanto, D. V. Spracklen, K. J. Pringle, and K. S. Carslaw
School of Earth and Environment, University of Leeds, Leeds, UK
Received: 21 October 2008 – Published in Atmos. Chem. Phys. Discuss.: 26 February 2009 Revised: 13 November 2009 – Accepted: 18 January 2010 – Published: 25 January 2010
Abstract. We use a global aerosol microphysics model to estimate the effect of particle formation through activation nucleation in the boundary layer (BL) on cloud droplet num-ber concentration (CDNC) on global and regional scales. The calculations are carried out for years 1850 and 2000 using historical emissions inventories for primary particles and aerosol precursor gases. Predicted CDNC in 2000 are in good agreement with in-situ observations when activa-tion nucleaactiva-tion is included. We find that BL particle for-mation increases global annual mean CDNC by approxi-mately the same relative amount in both years (16.0% in 1850 and 13.5% in 2000). As a result, global mean changes in cloud albedo are similar with and without BL particle for-mation. However, there are substantial regional effects of up to 50% enhancement or suppression of the 1850–2000 albedo change. Over most modern-day polluted northern hemi-sphere regions, including BL particle formation scheme sup-presses the 1850–2000 increase in CDNC and cloud albedo because BL particle formation is already large in 1850. Over the Arctic the albedo change is suppressed by 23% in the annual mean and by 43% in summer when BL particle for-mation is taken into account. The albedo change of the per-sistent stratocumulus cloud deck west of Chile is enhanced by 49%.
1 Introduction
Cloud droplet number concentration (CDNC) is controlled by the concentration of aerosol particles large enough to act as cloud condensation nuclei (CCN) (Lohmann and Feichter,
Correspondence to:J. Merikanto ([email protected])
2005; Dusek et al., 2006). The CDNC depends on the con-centration, size distribution and chemical properties of CCN and on the updraft velocity defining the maximum supersat-uration in a cloud parcel (Nenes and Seinfeld, 2003). Higher CDNC leads to an enhanced cloud albedo (Twomey, 1991). This effect is known as the first indirect effect, and its magni-tude is one of the most poorly quantified factors in assessing human impacts on climate (IPCC, 2007). Estimates of the aerosol indirect effect obtained from different global climate models (GCMs) vary from−0.3 Wm−2to−1.8 Wm−2, and
the main cause of the spread in results is the difference in pre-dicted aerosol concentrations between different models given a fixed set of sources (Penner et al., 2006).
CDNC is controlled by the number of CCN-sized particles that originate from emissions of primary particles or from at-mospheric particle formation. In a previous study we used a global aerosol microphysics model to demonstrate that par-ticle formation through activation nucleation in the BL in-creases the global mean CCN (0.2% supersaturation) concen-trations by 3−20% and CCN (1%) by 5−50% (Spracklen et al., 2008). The uncertainties in these values are related to uncertainties in particle formation and growth rates. Thus BL particle formation is an important, though still quite un-certain, source of CCN in the present atmosphere. But the important question for climate is whether the contribution of BL particle formation to CCN has changed over the indus-trial period, which would affect the calculated aerosol indi-rect forcing. There are reasons to suspect that it might have changed. In Spracklen et al. (2006) we showed that changes in primary emissions could lead to non-linear changes in par-ticle number: primary emissions are a source of parpar-ticles but also a sink for nuclei. We showed that the total num-ber of particles initially goes down as primary emissions are reduced, but as they are reduced further particle number goes up again because BL particle formation becomes enhanced. Gaydos et al. (2005) and Jung et al. (2006) also showed a non-linear response of nucleation to SO2emissions in a box
model. But the impact of long-term changes in nucleating vapours and primary particles is likely to be complex and regionally variable because of the non-linear response of nu-cleation to production and loss processes.
The importance of activation nucleation in the BL has been recently studied also with other global models. Makkonen et al. (2009) used ECHAM5-HAM to show that activation nu-cleation is likely to enhance global present day CDNC signif-icantly, but also noted that the uncertainties in the mechanism lead to large uncertainties in the obtained CDNC. Wang and Penner (2009) studied the effect of activation nucleation on present day and pre-industrial CCN and on the first indirect effect. They found that this mechanism increased present day global boundary layer CCN by 31.4% when no primary emitted sulfate was included and 5.3% when primary sulfate was included. Overall, activation nucleation reduced the an-thropogenic fraction of CCN and decreased the first aerosol indirect effect. In another recent model study, Pierce and Adams (2009) also obtained a 5% increase in global CCN due to activation nucleation, but also pointed out that the sen-sitivity of CCN to different nucleation scenarios depended on the selected primary emission and secondary organic aerosol schemes.
Here, we extend our model simulations of present day CCN to quantify the effect of BL particle formation on CDNC and cloud albedo under pre-industrial (1850) and present-day (2000) conditions. We use a mid-range estimate for the BL particle formation rate leading to a 10–20% in-crease in global present-day CCN. Our aim is not to calcu-late a new value for the indirect forcing, but to demonstrate that while work is in progress to improve the representation
of aerosol in GCMs, BL particle formation should be consid-ered due to its sizable contribution to CDNC and to estimates of the cloud albedo change.
2 Model description
We use the global aerosol microphysics model GLOMAP, which is an extension of the offline 3-D chemical transport model TOMCAT (Chipperfield, 2006). Full details of the model microphysics scheme are described in Spracklen et al. (2005a). GLOMAP treats two externally mixed aerosol distributions described by a two-moment sectional scheme with 20 sections spanning 3 nm to 25 µm dry diameter. One of the distributions is partly hydrophyllic including sulfate, sea-salt, black carbon (BC) and organic carbon (OC). The other distribution representing freshly emitted primary car-bonaceous particles contains BC and OC and is assumed to be hydrophobic. The hydrophobic OC and BC particles are transferred to the hydrophyllic distribution through coagula-tion and condensacoagula-tion of soluble gas-phase species. These species include gaseous H2SO4 and the first-stage
oxida-tion products of monoterpenes (Guenther et al., 1995), which form hydrophilic secondary organic aerosol material with an assumed yield of 13% (Spracklen et al., 2006). The model has a horizontal resolution of∼2.8◦by∼2.8◦with 31 ver-tical levels between the surface and 10 hPa and is forced by analyses from the European Centre for Medium-Range Weather Forecasts for the year 2000. The same meteorology and oxidants are used both for 1850 and 2000 runs.
New particle formation is modelled with the cluster activa-tion theory (Kulmala et al., 2006). According to this scheme, nucleation rate of 1 nm clustersJ1[cm−3s−1] is given by
J1=A[H2SO4], (1)
whereJ1is the,[H2SO4]is the gas phase sulfuric acid
con-centration in cm−3andAis the activation coefficient. Here
we have used A=2×10⁻⁶s−1, which is based on
empir-ical calculations (Sihto et al., 2006) and on our previous comparisons with ground level observations (Spracklen et al., 2006, 2008). Calculated A-factors for observed nucle-ation events vary temporally and regionally between A= 10−8−10−4s−1(Riipinen et al., 2007). However, reasons
for the variations in A-factor are not known.
The effective formation rate of 3 nm particles added to the first size bin is obtained with the parameterization of Kermi-nen and Kulmala (2002), expressed as
J3=J1exp
−0.153CS ′
GR
, (2)
where CS′is the reduced condensation sink and GR (nm h−1)
is the cluster growth rate, assumed to be constant between 1 nm and 3 nm and given by 0.73·10−7[H
2SO4]. In
2004b; Hirsikko et al., 2005). However, a large body of ex-perimental evidence supports the idea that particle formation rates depend mainly on the interplay between the sulfuric acid concentration and condensation sink, as in the above pa-rameterization.
The above particle formation mechanism is confined to the BL in our model runs. Aircraft observations suggest that the total particle concentration has a minimum just above the BL (Schroder et al., 2002). The concentrations increase again in the free and upper troposphere, where homogeneous bi-nary H2O−H2SO4or ternary H2O−H2SO4−NH3particle
formation mechanisms are the most likely sources of new particles (see e.g. Kulmala et al. (1998); Merikanto et al. (2007)). Above the boundary layer we use the parameter-ized H2O−H2SO4particle formation rates of Kulmala et al.
(1998), which we have previously shown to reproduce the observed particle number concentrations in the upper tropo-sphere (Spracklen et al., 2005a). However, in this study we focus only on the effects of BL particle formation.
The cloud drop number concentration (CDNC) is calcu-lated from the time-averaged hydrophyllic particle distribu-tion using the iterative scheme of Nenes and Seinfeld (2003) and Fountoukis and Nenes (2005). The application of this scheme in GLOMAP is described in Pringle et al (2009). The schemes take into account the fraction of soluble material in the particles and the number of ions released into the solu-tion, and are capable of predicting the observed CDNC with good accuracy (Meskhidze et al., 2005). The calculations are carried out for every grid box regardless of the presence of clouds at 300–1000 m above ground level. The CDNC are calculated as a diagnostic and are not fed back into the aerosol microphysics. Cloud droplet activation in clouds is modeled using a constant activation dry diameter of 50 nm. In an earlier GLOMAP study the 50 nm activation diameter was found to correspond to a minimum updraft velocity of approximately 0.4 m/s in the Nenes and Seinfeld (2003) pa-rameterization both in polluted and clean conditions (Fig. 8 in Korhonen et al., 2008).
The changes in aerosol, and hence in cloud drop number, are quantified using emissions for 1850 and 2000. The an-thropogenic sulfur emissions, accounting also for changes in wildfires, are taken from the inventory of Smith et al. (2004). According to this inventory, the global sulfur emis-sions have increased from 1.4 to 59.4 Tg(S)a−1 between
1850 and 2000. We emit 2.5% of sulfur directly as partic-ulate sulfate with mode diameters of 60 nm (50% of ground level sulfate emissions), 150 nm (50% of ground level sulfate emissions), 150 nm (50% of elevated sulfate emissions) and 1500 nm (50% of elevated sulfate emissions). The remain-ing 97.5% of athropogenic sulfur is emitted as SO2. The
marine dimethylsulfide emissions and sulfur emissions from constantly erupting volcanoes are assumed to be the same for both years, accounting for 17.7 Tg(S)a−1and 13.0 Tg(S)a−1
respectively. We use the inventory of Bond et al. (2007) for energy related emissions of BC and OC, and further separate
Table 1. Comparison of modelled 2000 CDNC [cm−3] to CDNC
observed in in-situ measurement campaigns. Model calculations are carried out with typical updraught velocities (w) [ms−1] observed
during the campaigns. Results are shown with (BLPF) and without (no BLPF) boundary layer particle formation.
Location w no BLPF BLPF Observed Beaufort sea (April) 0.4 70 86 90a Key West (July) 2.0 409 631 836±727b Monterey (July) 0.2 274 298 378±72b Cleveland (August) 0.4 566 763 881±285c
aGultepe and Isaac (2002, 2004);bMeskhidze et al. (2005); cFountoukis et al. (2007).
these emissions into biofuel and fossil fuel components using the database of Fernandes et al. (2007). Monthly wildfire BC and OC emissions are from Dentener et al. (2006), where the values for 1850 are obtained by taking a population weighted average of 1750 and 2000 emissions. The total global BC particulate emissions are 2.1 Tga−1and 8.0 Tga−1for 1850
and 2000, respectively, and 20.5 Tga−1 and 49.2 Tga−1 for
OC. The sea-salt emissions are calculated using Gong (2003) and are identical for both years. Emissions of monoterpenes are from Guenther et al. (1995) and are assumed to be iden-tical for both years.
3 Results
3.1 Evaluation of model cloud droplet number
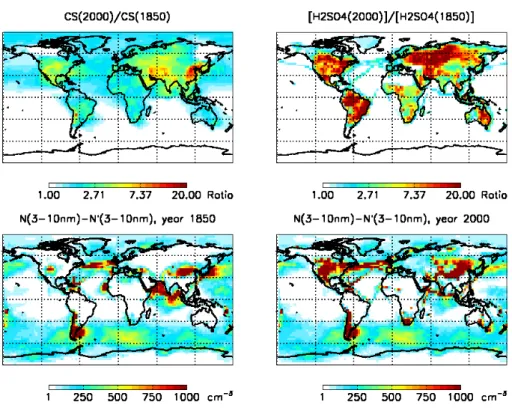
Fig. 1.Upper panels: The ratio of annual mean 2000 and 1850 values for condensation sink (CS) and gas-phase sulfuric acid concentration at 300–1000 m above ground level. Lower panels: The difference in concentrations of 3 nm–10 nm particles with (N) and without (N’) boundary layer particle formation in 1850 and 2000 at 300–1000 m above ground level.
3.2 Changes in aerosol and condensation sink
The formation rate of 3 nm particles depends primarily on the sulfuric acid concentration and the magnitude of the condensation sink. Figure 1 shows the ratio of 1850 and 2000 yearly mean condensation sinks and the ratio of sul-furic acid concentrations, and the concentrations of 3–10 nm particles resulting from BL particle formation. Already in the relatively clean atmosphere in 1850 BL particle forma-tion has produced significant amounts of new particles. Con-sidering that the anthropogenic sulfur emissions in 1850 are only 1.4 Tg(S)a−1compared to Tg(S)a−1TgS/yr from
natu-ral sulfur emissions most of the formation in 1850 must be driven by natural sulfur sources. The gaseous sulfuric acid concentration has increased from 1850 to 2000 mainly over continental regions where anthropogenic emissions have in-creased from 1850 to 2000. Over the continents typical changes in condensation sink are smaller in magnitude than the changes in sulfuric acid concentration. Therefore, the average continental BL particle formation rates are larger in 2000 than in 1850. On the other hand, in many marine re-gions especially in the northern hemisphere, the condensa-tion sink has grown due to increased shipping and outflow of aged particles causing the formation rates in these regions to decrease or to stay constant. A smaller proportion of newly formed marine particles is able to grow to large sizes in 2000
than in 1850 because the changes in condensation sink are larger than changes in condensing sulfuric acid as shown in Fig. 1.
3.3 Changes in cloud droplet number
Fig. 2. Upper panels: Annual mean cloud droplet number concentration at 300–1000 m above ground level with BL particle formation. Results are shown for 1850 and 2000. Lower panels: The difference in cloud droplet number concentration with and without activation-type BL particle formation in 1850 and 2000. The updraft velocity is taken to bew=0.4m/s in all cases. Grey boxes show marine regions with persistent stratiform cloud formation.
In both years CDNC is higher over continents than ma-rine areas, but the mama-rine-continent contrast is much larger in 2000 than in 1850. Large differences in continental CDNC can also be seen in less industrialized regions, like over the equatorial Africa and South America. These differences are mostly due to increases in particulate emissions from bio-fuel and forest burning. However, BL particle formation still accounts for a significant proportion of CDNC in these areas regardless that the in-situ particle formation rates are negligi-ble. This can be seen by comparing the lower panels of Fig. 2 to the original locations of BL particle formation shown in the lower panels of Fig. 1. The differences in the patterns in these figures are due to long range transport of particles: the effect of BL particle formation on CDNC spreads to remote regions where particle formation does not take place in-situ. Changes in CDNC are summarized in Table 2 for several continental regions and marine regions with persistent strat-iform cloud formation, indicated in Fig. 2 by gray boxes in the upper two panels. A clear increase in CDNC can be seen in all cases when particle formation is included. The glob-ally averaged fractional changes in CDNC are quite similar in the runs with and without BL particle formation (66.1% and 68.7% respectively, see Table 2). However, there are large regional differences in the relative importance of BL particle formation. Particularly, in many parts of the
north-ern hemisphere the relative contribution of BL particle for-mation in 2000 is less than in 1850. This is particularly the case in modern-day polluted regions. On the other hand, in the southern hemisphere the relative contribution of BL par-ticle formation to CDNC is greater in 2000 than 1850, prob-ably due to assumed increase in SO2emissions by wildfires
in Amazonian, West African and Australian regions. This re-sult could be reversed if global wildfires were more abundant in 1850 than in 2000 as suggested by Marlon et al. (2008), contrary to AEROCOM predictions (Dentener et al., 2006). It appears that already in 1850 BL particle formation made a substantial contribution to Arctic CDNC both through ticle transport and in-situ formation. In the Arctic, BL par-ticle formation suppresses the 1850–2000 change in CDNC. Overall, 1850–2000 increase in CDNC with BL particle for-mation shows a very different pattern than 1850–2000 in-crease in CDNC if BL particle formation is omitted.
3.4 Changes in cloud albedo
Table 2.Summary of yearly average CDNC [cm−3] and1Rc obtained from model runs at 300–1000 m above ground level. Primed values
indicate results without BLPF. CDNC is calculated with an updraft velocityw=0.4 m/s.1Rc is the corresponding change in albedo for an initial albedo of Rc=0.35 The last column shows the correction from BLPF to albedo change,(1Rc−1Rc′)/1Rc′. The marine regions
refer to west of North America (NAM), west of South America (SAM), west of North Africa (NAF), west of South Africa (SAF), and East of North-East Asia (NEA) (see Fig. 2).
1850 2000
Region CDNC′ CDNC CDNC′ CDNC 1Rc′% 1Rc % d1Rc
|1Rc′|%
Total Global 125 145 211 240 3.97 3.85 −3.0 Arctic 54 81 86 116 3.60 2.72 −24.3 North temperate zone 139 173 325 374 6.47 5.85 −9.6 Northern tropics 141 161 250 274 4.33 4.03 −6.7 Southern tropics 167 178 217 243 1.97 2.35 19.4 South temperate zone 88 101 104 125 1.30 1.64 25.8 Antarctic 56 64 56 64 0.027 0.053 94.5 Total Marine 102 117 155 176 3.13 3.09 −1.2 NAM 99 114 214 236 5.81 5.52 −5.0 SAM 107 116 127 149 1.30 1.94 49.2 NAF 92 113 199 241 5.82 5.76 −0.9 SAF 142 151 165 186 1.17 1.58 34.7 NEA 127 168 352 389 7.77 6.34 −18.4 Total Continental 186 219 362 413 5.04 4.81 −4.7 Europe 232 291 562 621 6.73 5.75 −14.6 Africa 233 263 377 419 3.65 3.52 −3.6 N. America 170 215 330 419 5.05 5.05 0.1 S. America 250 274 408 466 3.72 4.02 8.1 N.‘Asia 117 152 280 336 6.63 6.00 −9.5 SE Asia 203 245 558 598 7.65 6.75 −11.8 Oceania 219 243 287 352 2.05 2.80 36.1
1Rc=Rc(1−Rc)/3ln
CDNC(2000) CDNC(1850)
, (3)
where Rc is the cloud initial albedo. The difference in cloud albedo change with and without BL particle formation is given by
d1Rc=1Rc−1Rc′ (4)
=Rc(1−Rc)/3ln
CDNC(2000)
CDNC(1850)
CDNC′(2000) CDNC′(1850)
,
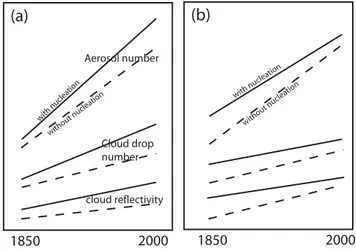
where the primed values indicate results without BL parti-cle formation. The logarithmic term in the above equation, the ratio of CDNC ratios between runs with and without BL particle formation, shows that BL particle formation has an effect on albedo change only if its relative contribution to CDNC has changed over time. A schematic representation of the effects of particle formation is shown in Fig. 3. It shows that particle formation can both enhance and suppress the obtained albedo changes. To calculate1Rc we assume an initial albedo of 0.35. Although the 1850–2000 changes in albedo are affected by the assumed initial albedo, the
as-sumption does not alter the calculated relative impact of BL particle formation.
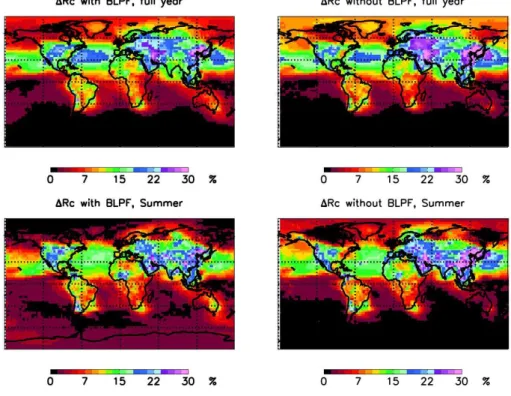
Figure 4 shows the resulting changes in 1Rc with and without BL particle formation. The figure shows the av-eraged full year and northern hemisphere summer values. The regional patterns of1Rc are quite strongly affected by particle formation. For example, during the northern hemi-sphere summer BL particle formation completely suppresses the albedo change over large parts of the Arctic region. The full year regional changes are summarized in Table 2. The global mean albedo change is predicted to be 3.97% with BL particle formation and 3.85% without, so the globally aver-aged impact of BL particle formation is negligible. How-ever, the negligible effect of BL particle formation on aver-age global albedo change may be coincidental and related to the selected representation of emissions, as discussed in Introduction. Using different but plausible combinations of emissions could lead to both increase or decrease in the av-erage global albedo change due to BL particle formation.
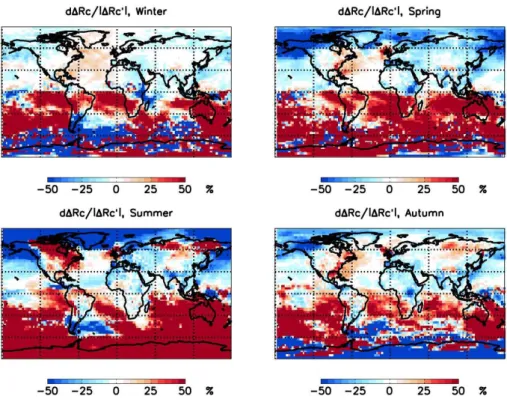
d1Rc/|1Rc′|and is independent of the initial albedo. We note that results are similar with different updraft velocities, although the regional differences are more pronounced with higher updrafts. This is because the importance of activation BL nucleation on CDNC decreases with smaller updrafts due to increasing cloud droplet activation radius. Clouds that are most susceptible to albedo change may have smaller charac-teristic updrafts than 0.4 m/s, but larger impact of BL nucle-ation on high updraft clouds would partly compensate this.
Blue areas in Fig. 5 indicate regions where the 1850 to 2000 changes in CDNC or1Rc are reduced by including BL particle formation, and red areas indicate where the changes are increased. It can be seen that BL particle formation has a substantial regional impact on calculated1Rc. In large parts of the globed1Rc/|1Rc′|exceeds 50%. The results show a large north-south contrast: BL particle formation re-duces the calculated albedo change in the north and increases it in the south. Results show relatively high seasonal varia-tion, and the largest regional changes are obtained during the northern hemisphere summer. During the summer the posi-tive albedo change in the northern hemisphere is greatly re-duced, except in North America where BL particle formation results in a larger positive albedo change. In the south tropics BL particle formation enhances the obtained albedo change during all seasons. The changes in the Antarctic region are not statistically significant since the obtained albedo change is negligible in all cases.
In their recent study Wang and Penner (2009) found that BL particle formation through activation nucleation de-creases the first aerosol indirect effect especially over north-ern hemisphere oceans. Also in our simulations the albedo change is decreased in these regions. Over northern hemi-sphere land regions Wang and Penner (2009) found a modest decrease in the first indirect effect due to BL particle for-mation when primary sulfate was included, or a modest in-crease in the first indirect effect when primary sulfate was not included. According to our results the albedo change is decreased over most northern hemisphere land areas (except spring and summer seasons in Canada and Siberia due to re-ductions in wildfire emissions since 1850 in these regions). Our results suggest an enhanced albedo change over most of the southern hemisphere, while Wang and Penner (2009) ob-tained a modest decrease or no change at all in this region depending on the applied primary sulfate scheme.
Our model simulations show that BL particle forma-tion has a regionally variable impact on CDNC and albedo changes between 1850 and 2000. In some regions the in-creases in albedo are enhanced when BL particle formation is included, while in other regions it is suppressed. The regional differences arise because the relative contribution of BL par-ticle formation to aerosol in 1850 and 2000 has changed (il-lustration in Fig. 3). In regions where albedo changes are suppressed, BL particle formation had a greater proportional effect on aerosol in 1850 than in 2000, and vice versa in re-gions where albedo changes are enhanced. A greater
pro-1850 2000 1850 2000
Aerosol number
Cloud drop number
cloud reflectivity
(a)
(b)
without nuclea tion
with nucleation without nuclea
tion
with nuclea tion
Fig. 3.Schematic showing how the inclusion of boundary layer
nu-cleation can either increase or decrease the change in cloud albedo (1Rc) between 1850 and 2000. (a)Nucleation increases1Rc: the fractional impact of nucleation on aerosol number, cloud drop num-ber and cloud albedo is less in 1850 than in 2000. (b)Nucleation decreases1Rc: the fractional impact of nucleation on aerosol num-ber, cloud drop number and cloud albedo is greater in 1850 than in 2000. Note that fractional changes in CDNC are always smaller than fractional changes in aerosol number, and fractional changes in Rc are smaller still. So although the change in aerosol between 1850 and 2000 is much larger than any effect of activation-type BL particle formation, this is not the case for changes in albedo. The effect is exaggerated in the diagram.
portional effect in 1850 can be explained in two ways: that industrial emissions of precursor gases and primary aerosol in 2000 have acted to suppress BL particle formation, imply-ing that increases in the condensation sink have outweighed increases in the nucleating H2SO4vapour, or that a greater
fraction of CDNC are due to primary particles in 2000.
4 Conclusions and discussion
We have used a global aerosol model to explore the effect of activation-type BL particle formation on global and regional CDNC. The obtained CDNC with particle formation are in good agreement with in-situ observations at marine and con-tinental sites, while those without BL particle formation tend to underestimate CDNC. The effect on CDNC can be seen on most parts of the globe, but the relative contribution of particle formation to regional CDNC varies greatly. Further-more, this contribution is nonlinear to in-situ particle forma-tion rates. Particle formaforma-tion can greatly enhance CDNC also in regions where in-situ formation rates are negligible due to long range transport of aerosol.
Fig. 4. The 1850–2000 change in cloud albedo with and without boundary layer particle formation at 300–1000 m above ground level. Results are shown for an initial albedo Rc=0.35 assuming cloud updraft velocityw=0.4ms−1.
2000 show that particle formation made a nearly equal con-tribution (16%–13.5%) to global CDNC in both years. How-ever, there are distinct regional differences in the historical contribution of BL particle formation to CDNC that can af-fect albedo changes by more than 50%. We find that there is a strong north-south contrast in the obtained albedo changes due to BL particle formation. With some exceptions, BL par-ticle formation decreases the albedo changes in the polluted regions of northern hemisphere and increases the albedo changes in the southern hemisphere. In the Arctic BL particle formation appears to suppress the 1850 to 2000 summertime albedo change by as much as 43%. Thus, BL particle for-mation was a much more important source of CDNC in the Arctic in 1850 than today. The explanation is that the sulfur pollution in the modern-day Arctic exists as sulfate aerosol, which act as a sink for new particles, rather than SO2, which
would act as a source for particle formation.
Of importance for the pattern of radiative forcing is that BL particle formation enhances the long term increase in CDNC in the persistent stratocumulus regions to the west of Africa and west of South America. Without BL parti-cle formation, the CDNC change west of South America is predicted to be 18.7% but with BL particle formation it is 29.0%. This leads to an estimated 49% enhancement in the 1850–2000 change in cloud albedo. New observations com-bined with high resolution cloud-scale modelling of outflow of pollutants from South America are needed to improve our
low resolution model estimate. In the persistent stratocumu-lus region East of North-East Asia the 1850-2000 albedo en-hancement is particularly strong. With BL particle forma-tion, the obtained albedo enhancement is reduced by 18.4%. The impact on climate change needs to be considered in longer simulations that include a calculation of cloud radia-tive forcing and the co-location of cloud type and CDNC change. Substantial changes in cloud albedo are predicted in regions with persistent low level clouds, but there are also substantial effects on CDNC in regions where other cloud types dominate. The substantial suppression of summertime Arctic indirect effect needs further investigation. Our model captures Arctic summertime particle size distributions fairly well (Korhonen et al., 2008) but, given the importance of Arctic climate change, further work is needed in this area. We also find that the effect of BL particle formation on CDNC becomes more pronounced at higher updraft veloci-ties since smaller particles become activated. Climate model simulations of the effects of CDNC on high updraft cumulus clouds are at an early stage (Wu et al., 2007), but nucleation could have an important influence on long term changes in CDNC in these clouds.
Fig. 5. Upper panel: The relative error in calculation of the change in cloud albedo if activation BL particle formation is neglected at 300–1000 m above ground level. Results are shown for four northern hemisphere seasons. The updraft velocity is taken to bew=0.4m/s.
distribution of primary particles both in 1850 and 2000. Wildfires represent a major but uncertain component in 1850 continental primary emissions. Recent charcoal records sug-gest that global wildfire activity was much higher in 1850 than today (Marlon et al., 2008). For 1850 we have used a population-weighted average of AEROCOM estimates for years 1750 and 2000 (Dentener et al., 2006) where wildfire emissions in the high latitudes in the northern hemisphere (Europe, N. America, Russia) are higher in 1850 than in 2000 due to less fire suppression, but total emissions are lower in 1850 than in 2000 due to changes in population and land use. We show that the regional contribution of BL particle formation to CDNC is not the same over the period 1850 to 2000. Therefore, climate model studies that do not ac-count for BL particle formation are likely to get the regional climate forcing from anthropogenic aerosol incorrect. Both this work and that of Pierce and Adams (2009) show that on a global scale BL particle formation contributes equally, to CDNC and CCN concentrations respectively, over this pe-riod. There are significant uncertainties in the emissions of primary particles and aerosol precursor gases. With differ-ent emission assumptions historical changes in BL particle formation may also be important at the global scale.
There are also uncertainties in the BL particle formation rate that can affect the results. In this study we have as-sumed a universally constant activation nucleation rate coef-ficientA=2×10⁻⁶s−1, but observed rate coefficients vary
between 10−8−10−4s−1for different nucleation events
(Ri-ipinen et al., 2007). It is not clear if a single rate coeffi-cient can be applied in different regions. We also assume the same rate coefficient for 1850 to 2000, but it is possi-ble that some unknown factors contributing to the rate coef-ficient have changed since 1850. However, our other work (Spracklen et al., 2008; Merikanto et al., 2009) has shown that CCN (and therefore CDN) are fairly insensitive to large changes in the A-factor. The fundamental mechanism of par-ticle formation is still poorly understood, and the process may be limited by the abundance of some other chemical species beside sulfuric acid as assumed here. For example, it has been suggested that the neutral activated cluster may con-stitute ammonia and sulfuric acid (Vehkamaki et al., 2004; Ortega et al., 2008), which may affect the nucleation rate in some regions (Gaydos et al., 2005; Jung et al., 2006). It is also possible that biogenic organic species control BL parti-cle formation (Bonn et al., 2008).
Acknowledgements. This work was supported by grants from NERC: (AEROFORM NE/D01395X/1 and APPRAISE CP3), a Royal Society International Joint Project, and the EU EUCAARI integrated project. J. Merikanto was also supported by Academy of Finland grant no. 126105.
Edited by: A. Wiedensohler
References
Adams, P. J. and Seinfeld, J. H.: Predicting global aerosol size distributions in general circulation models, J. Geophys. Res., 107(D19), 4370, doi:10.1029/2001JD001010, 2002.
Bond, T., Bhardwaj, E., Dong, R., Jogani, R., Jung, S., Roden, C., Streets, D. G., and Trautmann, N. M.: Historical emissions of black and organic carbon aerosol from energy-related com-bustion, 1850–2000, Global Biogeochem. Cycles, 21, GB2018, doi:10.1029/2006GB002840, 2007.
Bonn, B., Kulmala, M., Riipinen, I., Sihto, S.-L., and Ruuskanen, T. M.: How biogenic terpenes govern the correlation between sul-furic acid concentrations and new particle formation, J. Geophys. Res., 113, D12209, doi:10.1029/2007JD009327, 2008.
Chipperfield, M.: New version of the TOMCAT/SLIMCAT off-line chemical transport model: Intercomparison of stratospheric tracer experiments, Q. J. R. Meteorol. Soc., 132, 1179-1203, doi:10.1256/qj.05.51, 2006.
Dentener, F., Kinne, S., Bond, T., Boucher, O., Cofala, J., Generoso, S., Ginoux, P., Gong, S., Hoelzemann, J. J., Ito, A., Marelli, L., Penner, J. E., Putaud, J.-P., Textor, C., Schulz, M., van der Werf, G. R., and Wilson, J.: Emissions of primary aerosol and pre-cursor gases in the years 2000 and 1750 prescribed data-sets for AeroCom, Atmos. Chem. Phys., 6, 4321–4344, 2006,
http://www.atmos-chem-phys.net/6/4321/2006/.
Dusek, U., Frank, G. P., Hildebrandt, L., Curtius, J., Schneider, J., Walter, S., Chand, D., Drewnick, F., Hings, S., Jung, D., Bor-rmann, S., and Andreae, M. O.: Size Matters More Than Chem-istry for Cloud-Nucleating Ability of Aerosol Particles, Science, 312, 1375, doi:10.1126/science.1125261, 2006.
Fernandes, S. D., Trautmann, N. M., Streets, D. G., Roden C. A., and Bond, T., C.: Global biofuel use, 1850–2000, Global Bio-geochem. Cy., 21, GB2019, doi:10.1029/2006GB002836, 2007. Fountoukis, C. and Nenes, A.: Continued developement of a cloud droplet formation parameterization for global cli-mate models, J. Geophys. Res.-Atmos., 110, D11212, doi:10.1029/2004JD005591, 2005.
Fountoukis, C., Nenes, A., Meskhidze, N., Bahreini, R., Conant, W. C., Jonsson, H. Murphy, S., Sorooshian, A., Varutbangkul, V., Brechtel, F., Flagan, R. C., and Seinfeld J. H.: Aerosolcloud drop concentration closure for clouds sampled during the Inter-national Consortium for Atmospheric Research on Transport and Transformation 2004 campaign, J. Geophys. Res., 112, D10S30, doi:10.1029/2006JD007272, 2007.
Gaydos, T. M., Stanier, C. O., and Pandis, S. N.: Mod-eling of in situ ultrafine atmospheric particle formation in the eastern United States, J. Geophys. Res., 110, D07S12, doi:10.1029/2004JD004683, 2005.
Gong, S. L.: A parameterization of sea-salt aerosol source function for sub- and super-micron particles, Global Biogeochem. Cy., 17(4), 1097,doi:10.1029/2003GB002079, 2003.
Guenther, A., Hewitt, C. N., Erickson D., et al.: A global model of natural volatile organic compound emissions, J. Geophys. Res., 100, 8873–8892, 1995.
Gultepe, I. and Isaac, G. A.: The effects of air-mass origin on Arctic cloud microphysical parameters during FIRE. ACE, J. Geophys. Res., 107(C10), 8029, doi:10.1029/2000JC000440, 2002 Gultepe, I. and Isaac, G. A.: Aircraft observations of cloud droplet
number concentration: Implications for climate studies, Q. J. Roy. Meteorol. Soc., 130, 2377–2390, doi:10.1256/qj.03.120, 2004.
Hirsikko, A., Laakso, L., Horrak, U., Aalto, P.P., Kerminen, V.M., and Kulmala, M.: Annual and size dependent variation of growth rates and ion concentrations in boreal forest, Boreal Environ. Res., 10(5), 357–369, 2005.
IPCC: 4th Assessment Report of the Intergovernmental Panel on Climate Change, IPCC, Geneva, Switzerland, WG1, 502, 2007. Jung, J, Adams, P. J., and Pandis, S. N.: Simulating the size
dis-tribution and chemical composition of ultrafine particles during nucleation events, Atmos. Environ., 40, 2248–2259, 2006. Kerminen, V.-M. and Kulmala, M.: Analytical formulae connecting
the “real” and the apparent nucleation rate and the nuclei number concentration for atmospheric nucleation events, J. Aerosol Sci., 33, 609–622, 2002.
Kerminen, V.-M., Lihavainen, H., Komppula, M., Viisanen, Y., and Kulmala, M.: Direct observational evidence linking atmospheric aerosol formation and cloud droplet activation, Geophys. Res. Lett., 32, L14803, doi:10.1029/2005GL023130, 2005.
Korhonen, H., Carslaw, K. S., Spracklen, D. V., Ridley, D. A., and Str¨om, J.: A global model study of processes controlling aerosol size distribution in the Arctic spring and summer, J. Geophys. Res., 113, D08211, doi:10.1029/2007JD009114, 2008.
Kuang, C., McMurry, P. H., McCormick, A. V., and Eisele, F. L.: Dependence of nucleation rates on sulfuric acid vapor concen-tration in diverse atmospheric locations, J. Geophys. Res., 113, D10209, doi:10.1029/2007JD009253, 2008.
Kulmala, M., Laaksonen, A., and Pirjola, L.: Parameterizations for sulfuric acid/water nucleation rates, J. Geophys. Res.-Atmos., 103(D7), 8301–8307, 1998.
Kulmala, M., Vehkam¨aki, H., Pet¨aj¨a, T., Dal Maso, M., Lauri, A., Kerminen, V.-M., Birmili, W., and McMurry, P. H.: Formation and growth of ultrafine atmospheric parti-cles: a review of observations, J. Aerosol Sci., 35, 143–176, doi:10.1016/j.jaerosci.2003.10.003, 2004a.
Kulmala, M., Kerminen, V.-M., Anttila, T., Laaksonen, A., and O’Dowd, C. D.: Organic aerosol formation via sulphate clus-ter activation, J. Geophys. Res.-Atmos., 109(D4), D04205, doi:10.1029/2003JD003961, 2004b.
Kulmala, M., Lehtinen, K. E. J., and Laaksonen, A.: Cluster activa-tion theory as an explanaactiva-tion of the linear dependence between formation rate of 3 nm particles and sulphuric acid concentration, Atmos. Chem. Phys., 6, 787–793, 2006,
http://www.atmos-chem-phys.net/6/787/2006/.
Laaksonen, A., Hamed, A., Joutsensaari, J., Hiltunen, L., Cavalli, F., Junkermann, W., Asmi, A., Fuzzi, S., and Facchini, M. C.: Cloud condensation nucleus production from nucleation events at a highly polluted region, Geophys. Res. Lett., 32, L06812, doi:10.1029/2004GL022092, 2005.
“po-tential” cloud condensation nuclei associated with atmospheric new-particle formation in northern Finland, J. Geophys. Res., 108(D24), 4782, doi:10.1029/2003JD003887, 2005.
Lohmann, U. and Feichter, J.: Global indirect aerosol effects: a review, Atmos. Chem. Phys., 5, 715–737, 2005,
http://www.atmos-chem-phys.net/5/715/2005/.
Makkonen, R., Asmi, A., Korhonen, H., Kokkola, H., J¨arvenoja, S., R¨ais¨anen, P., Lehtinen, K. E. J., Laaksonen, A., Kerminen, V.-M., J¨arvinen, H., Lohmann, U., Bennartz, R., Feichter, J., and Kulmala, M.: Sensitivity of aerosol concentrations and cloud properties to nucleation and secondary organic distribution in ECHAM5-HAM global circulation model, Atmos. Chem. Phys., 9, 1747–1766, 2009,
http://www.atmos-chem-phys.net/9/1747/2009/.
Marlon, J. R., Bartlein, P. J., Carcaillet, C., Gavin, D. G., Harrison, S. P., Higuera, P. E., Joos, F., Power, M. J., and Prentice, I. C.: Climate and human influences on global biomass burning over the past two millennia, Nature Geoscience 1, 697–701, 2008. Merikanto, J., Napari, I., Vehkam¨aki, H., Anttila, T., and Kulmala,
M.: New parameterization of ternary sulfuric acid-ammonia-water ternary nucleation rates at tropospheric conditions, J. Geo-phys. Res.-Atmos., 112, D15207, doi:10.1029/2006JD007977, 2007.
Merikanto, J., Spracklen, D. V., Mann, G. W., Pickering, S. J., and Carslaw, K. S.: Impact of nucleation on global CCN, Atmos. Chem. Phys., 9, 8601–8616, 2009,
http://www.atmos-chem-phys.net/9/8601/2009/.
Meskhidze, N., Nenes, A., Conant, W. C., and Seinfeld, J. H.: Eval-uation of a new cloud droplet activation parameterization with in situ data from CRYSTAL-FACE and CSTRIPE, J. Geophys. Res., 110, D16202, doi:10.1029/2004JD005703, 2005.
Nenes, A. and Seinfeld, J. H.: Parameterization of cloud droplet formation in global climate models, J. Geophys. Res.-Atmos., 108(D14), 4415, doi:10.1029/2002JD002911, 2003.
Nenes., A., Ghan, S., Abdul-Razzak, H., Chuang, P. Y., and Sein-feld, J. H.: Kinetic Limitations on Cloud Droplet Formation and Impact on Cloud Albedo, Tellus, 53B, 133–149, 2001.
O’Dowd, C. D., Aalto, P., H¨ameri, K., Kulmala, M., and Hoffmann, T.: Atmospheric particles from organic Vapours, Nature, 416, 497–498, 2002a.
Ortega, I. K., Kurt´en, T., Vehkam¨aki, H., and Kulmala, M.: The role of ammonia in sulfuric acid ion induced nucleation, Atmos. Chem. Phys., 8, 2859–2867, 2008,
http://www.atmos-chem-phys.net/8/2859/2008/.
Penner, J. E., Quaas, J., Storelvmo, T., Takemura, T., Boucher, O., Guo, H., Kirkev˚ag, A., Kristj´ansson, J. E., and Seland, Ø.: Model intercomparison of indirect aerosol effects, Atmos. Chem. Phys., 6, 3391–3405, 2006,
http://www.atmos-chem-phys.net/6/3391/2006/.
Pierce, J. R. and Adams, P. J.: Uncertainty in global CCN concen-trations from uncertain aerosol nucleation and primary emission rates, Atmos. Chem. Phys., 9, 1339–1356, 2009,
http://www.atmos-chem-phys.net/9/1339/2009/.
Pringle, K. J., Carslaw, K. S., Spracklen, D. V., Mann, G. M., and Chipperfield, M. P.: The relationship between aerosol and cloud drop number concentrations in a global aerosol microphysics model, Atmos. Chem. Phys., 9, 4131–4144, 2009,
http://www.atmos-chem-phys.net/9/4131/2009/.
Riipinen, I., Sihto, S.-L., Kulmala, M., Arnold, F., Dal Maso, M.,
Birmili, W., Saarnio, K., Teinil¨a, K., Kerminen, V.-M., Laak-sonen, A., and Lehtinen, K. E. J.: Connections between atmo-spheric sulphuric acid and new particle formation during QUEST III/IV campaigns in Heidelberg and Hyyti¨al¨a, Atmos. Chem. Phys., 7, 1899–1914, 2007,
http://www.atmos-chem-phys.net/7/1899/2007/.
Schr¨oder F. P., K¨archer, B., Fiebig, M., and Petzold, A.: Aerosol states in the free troposphere at northern midlatitudes, J. Geo-phys. Res., 107(D21), 8126, doi:10.1029/2000JD000194, 2002. Smith, S. J., Andres, R., Conception, E., and Lurz, J.: Historical
sul-fur dioxide emissions 1850–2000: Methods and results, PNNL Research Report, PNNL-14537, 2004.
Sihto, S.-L., Kulmala, M., Kerminen, V.-M., Dal Maso, M., Pet¨aj¨a, T., Riipinen, I., Korhonen, H., Arnold, F., Janson, R., Boy, M., Laaksonen, A., and Lehtinen, K. E. J.: Atmospheric sulphuric acid and aerosol formation: implications from atmospheric mea-surements for nucleation and early growth mechanisms, Atmos. Chem. Phys., 6, 4079–4091, 2006,
http://www.atmos-chem-phys.net/6/4079/2006/.
Spracklen, D. V., Pringle, K. J., Carslaw, K. S., Chipperfield, M. P., and Mann, G. W.: A global off-line model of size-resolved aerosol microphysics: I. Model development and prediction of aerosol properties, Atmos. Chem. Phys., 5, 2227–2252, 2005a, http://www.atmos-chem-phys.net/5/2227/2005/.
Spracklen, D. V., Pringle, K. J., Carslaw, K. S., Chipperfield, M. P., and Mann, G. W.: A global off-line model of size-resolved aerosol microphysics: II. Identification of key uncertainties, At-mos. Chem. Phys., 5, 3233–3250, 2005b,
http://www.atmos-chem-phys.net/5/3233/2005/.
Spracklen, D. V., Carslaw, K. S., Kulmala, M., Kerminen, V.-M., Mann, G. W., and Sihto, S.-L.: The contribution of boundary layer nucleation events to total particle concentrations on re-gional and global scales, Atmos. Chem. Phys., 6, 5631–5648, 2006, http://www.atmos-chem-phys.net/6/5631/2006/.
Spracklen, D. V., Carslaw, K.S., Kulmala, M., Kerminen, V.-M., Sihto, S.-L., Riipinen, I., Merikanto, J., Mann, G. W., Chip-perfield, M. P., Wiedensohler, A., Birmili, W., and Lihavainen, H.: Contribution of particle formation to global condensa-tion nuclei concentracondensa-tions, Geophys. Res. Lett., 35, L06808, doi:10.1029/2007GL033038, 2008.
Twomey, S.: Aerosols, clouds and radiation, Atmos. Environ., Part A, 25, 2435–2442, 1991.
Vehkam¨aki, H., Napari, I., Kulmala, M., and Noppel, M.: Sta-ble ammonium bisulphate clusters in the atmosphere, Phys. Rev. Let., 93, 148501, doi:10.1103/PhysRevLett.93.14850, 2004. Wang, M. and Penner, J. E.: Aerosol indirect forcing in a global
model with particle nucleation, Atmos. Chem. Phys., 9, 239-260, 2009, http://www.atmos-chem-phys.net/9/239/2009/.
Weber, R. J., McMurry, P. H., Eisele, F. L., and Tanner, D. J.: Measurements of expected nucleation precursor species and 3– 500 nm diameter particles at Mauna Loa observatory, Hawaii, J. Atmos. Sci., 52, 2242–2257, 1995.
Weber, R. J., McMurry, P. H., Eisele, F. L., Tanner, D. J., and Jeffer-son, A.: Measurements of new particle formation and ultrafine particle growth rates at a clean continental site, J. Geophys. Res., 102, 4375–4385, 1997.
![Table 1. Comparison of modelled 2000 CDNC [cm −3 ] to CDNC observed in in-situ measurement campaigns](https://thumb-eu.123doks.com/thumbv2/123dok_br/17118039.238297/3.892.466.815.199.304/table-comparison-modelled-cdnc-cdnc-observed-measurement-campaigns.webp)

![Table 2. Summary of yearly average CDNC [cm −3 ] and 1Rc obtained from model runs at 300–1000 m above ground level](https://thumb-eu.123doks.com/thumbv2/123dok_br/17118039.238297/6.892.172.721.202.623/table-summary-yearly-average-cdnc-obtained-model-ground.webp)