ACPD
10, 27631–27672, 2010Cloud condensation nuclei measurements
D. S. Ward and W. R. Cotton
Title Page
Abstract Introduction
Conclusions References
Tables Figures
◭ ◮
◭ ◮
Back Close
Full Screen / Esc
Printer-friendly Version Interactive Discussion
Discussion
P
a
per
|
Dis
cussion
P
a
per
|
Discussion
P
a
per
|
Discussio
n
P
a
per
|
Atmos. Chem. Phys. Discuss., 10, 27631–27672, 2010 www.atmos-chem-phys-discuss.net/10/27631/2010/ doi:10.5194/acpd-10-27631-2010
© Author(s) 2010. CC Attribution 3.0 License.
Atmospheric Chemistry and Physics Discussions
This discussion paper is/has been under review for the journal Atmospheric Chemistry and Physics (ACP). Please refer to the corresponding final paper in ACP if available.
Cold and transition season cloud
condensation nuclei measurements in
western Colorado
D. S. Ward1and W. R. Cotton2
1
Earth and Atmospheric Science, Cornell University, Ithaca, New York, USA 2
Atmospheric Science, Colorado State University, Fort Collins, Colorado, USA
Received: 1 November 2010 – Accepted: 8 November 2010 – Published: 12 November 2010
Correspondence to: D. S. Ward (dsw25@cornell.edu)
ACPD
10, 27631–27672, 2010Cloud condensation nuclei measurements
D. S. Ward and W. R. Cotton
Title Page
Abstract Introduction
Conclusions References
Tables Figures
◭ ◮
◭ ◮
Back Close
Full Screen / Esc
Printer-friendly Version Interactive Discussion
Discussion
P
a
per
|
Dis
cussion
P
a
per
|
Discussion
P
a
per
|
Discussio
n
P
a
per
|
Abstract
Recent research has shown that orographic precipitation and the water resources that depend on it in the Colorado Rocky Mountains are sensitive to the variability of the region’s aerosols, whether emitted locally or from distant sources. However, obser-vations of cloud-active aerosols in western Colorado, climatologically upwind of the 5
Colorado Rocky Mountains, have been limited to a few studies at a single, northern site. To address this knowledge gap, atmospheric aerosols were sampled at a ground site in southwestern Colorado and in low-level north to south transects of the Colorado Western Slope as part of the Inhibition of Snowfall by Pollution Aerosols (ISPA-III) field campaign. Total particle and cloud condensation nuclei (CCN) number concentration 10
were measured for a 24-day period in Mesa Verde National Park, climatologically up-wind of the San Juan Mountains, in Sept. and Oct. 2009. Regression analysis showed a positive relationship between mid-troposphere atmospheric pressure to the west of the site and the total particle count at the ground site, but no similar statistically signif-icant relationship for the observed CCN. These data were supplemented with particle 15
and CCN number concentration, as well as particle size distribution measurements aboard the KingAir platform during December 2009. A CCN closure attempt was per-formed using the size distribution information and suggested that the sampled aerosol in general had low hygroscopicity that changed slightly with the large-scale wind direc-tion. Together, the sampled aerosols from these field programs were characteristic of a 20
rural continental environment with a cloud active portion that varied slowly in time, and little in space along the Western Slope.
1 Introduction
Variations in the concentration of cloud condensation nuclei (CCN) in the atmosphere have been shown to impact the micro-structure of clouds (Andreae and Rosenfeld, 25
Kauf-ACPD
10, 27631–27672, 2010Cloud condensation nuclei measurements
D. S. Ward and W. R. Cotton
Title Page
Abstract Introduction
Conclusions References
Tables Figures
◭ ◮
◭ ◮
Back Close
Full Screen / Esc
Printer-friendly Version Interactive Discussion
Discussion
P
a
per
|
Dis
cussion
P
a
per
|
Discussion
P
a
per
|
Discussio
n
P
a
per
|
man et al., 2002) and precipitation efficiency (e.g. Warner, 1968; Givati and Rosenfeld, 2004; Saleeby et al., 2009). In general, an increase in CCN number concentration ini-tially leads to a high cloud droplet number concentration (CDNC) compared to a cloud with similar liquid water content (LWC) but relatively fewer CCN, potentially leading to numerous microphysical and dynamical feedbacks (Ramanathan et al., 2001). The 5
magnitude and even the sign of the feedbacks depend on the effected cloud regime and are not all known (Stevens and Feingold, 2009), making characterization of CCN important on local and regional scales. In addition, since a majority of atmospheric par-ticles originate from or are influenced by anthropogenic activities (Andreae, 2007) the CCN population is an essential element in our understanding of the human impacts on 10
clouds, which modulate regional and global climate (Charlson et al., 2001; Ghan and Schwartz, 2007).
Previous studies show that orographic clouds are particularly susceptible to aerosol effects, perhaps the most susceptible regime yet identified (Levin and Cotton, 2009). For example, investigations of precipitation climatology in mountainous regions in the 15
western US have demonstrated a long-term decrease in accumulated precipitation downwind and upslope of urban areas (Givati and Rosenfeld, 2004; Rosenfeld and Givati, 2006). Jirak and Cotton (2006) found similar results along the Colorado Front Range and attributed lower precipitation to increases in pollution from the urban cor-ridor. Case studies of orographic clouds have also attributed lower precipitation pro-20
duction to local anthropogenic aerosol sources (Borys et al., 2000; Borys et al., 2003), and recent modeling studies of these clouds have shown sensitivity in precipitation to changes in CCN number concentration (Lynn et al., 2007; Saleeby et al., 2009).
Issues of orographic precipitation modification are of particular significance in west-ern Colorado where water supplies depend largely on the snow produced by orographic 25
ACPD
10, 27631–27672, 2010Cloud condensation nuclei measurements
D. S. Ward and W. R. Cotton
Title Page
Abstract Introduction
Conclusions References
Tables Figures
◭ ◮
◭ ◮
Back Close
Full Screen / Esc
Printer-friendly Version Interactive Discussion
Discussion
P
a
per
|
Dis
cussion
P
a
per
|
Discussion
P
a
per
|
Discussio
n
P
a
per
|
ideal laboratory for studying aerosol-orographic cloud interactions. In fact, a substantial portion of the research on this topic has taken place in northwestern Colorado.
While the observational evidence supports a potentially important aerosol impact on orographic clouds in western Colorado (Borys et al., 2003), the scope of the im-pact remains largely unknown. For example, it has been hypothesized that differences 5
in cloud LWC may dictate the sensitivity of precipitation to increases in aerosol (Bo-rys et al., 2000). High LWC clouds are more common in southwest Colorado than in northwest Colorado, suggesting a potential difference in the magnitude of aerosol effects. However, the comparison is difficult to make because observational records of droplet-nucleating aerosol do not exist for the majority of the Western Slope. To 10
our knowledge no measurements of CCN number concentration (Nccn) have ever been published for the central Colorado Western Slope leaving a gap in our understanding of aerosol/cloud interactions in a region that is potentially sensitive toNccnvariations.
In this study, atmospheric aerosols were sampled in southwestern Colorado and along the length of the Western Slope to address this knowledge gap. The cloud 15
active portion of the aerosols was measured at fixed supersaturations. Data were collected as part of the 2009–2010 Inhibition of Snowfall by Pollution Aerosols (ISPA)– III field campaign in western Colorado. The goals of this paper are to 1) introduceNccn
datasets for fall and winter in this region, 2) identify the location of possible sources of the observed CCN, 3) report on the bulk hygroscopicity of Western Slope aerosols and 20
4) point out the limitations of the applied methods to guide future research.
2 Mesa Verde observations
Mesa Verde National Park (MVNP) was chosen as the southwestern Colorado sam-pling site for this phase of the ISPA-III project. The site is located to the southwest of the higher elevations in the San Juan Mountains at an elevation of 2190 m above mean 25
ACPD
10, 27631–27672, 2010Cloud condensation nuclei measurements
D. S. Ward and W. R. Cotton
Title Page
Abstract Introduction
Conclusions References
Tables Figures
◭ ◮
◭ ◮
Back Close
Full Screen / Esc
Printer-friendly Version Interactive Discussion
Discussion
P
a
per
|
Dis
cussion
P
a
per
|
Discussion
P
a
per
|
Discussio
n
P
a
per
|
pine trees and the topsoil contains loess, a fine, red-colored silt. It is a location that endures frequent forest fires especially during the summer, although none burned in the vicinity during this project.
Mesa Verde is located in a region of low population density and the typical airmass in the region is of continental origin (Hobbs et al., 1980). The main local industry is 5
agriculture. Most of the agricultural activity takes place in small areas to the north of MVNP and to the east in the Mancos River Valley. Despite the rural setting, there are several large point sources of particles and gas-phase particle precursors that are local to the observation site. The most important of these, potentially, is the Four Corners power plant located about 100 km south-southeast of Mesa Verde. Four Corners is one 10
of the largest coal-firing power plants in the country and one of the larger sulfur emitters (US EPA, 2009). Together with two additional power plants located between the Four Corners plant and Mesa Verde, these sources are responsible for SO2 emissions in excess of 10 tons per day on average and the emission of large amounts of NOx (US EPA, 2009). Decreased visibility was often observed in the direction of these sources, 15
which stand at a lower altitude than the sampling site. Other substantial power plant aerosol sources, the Navajo and Page plants, are located to the west and southwest of Mesa Verde but are more distant than Four Corners.
The sampling site is co-located with the Interagency Monitoring of Protected Visual Environments (IMPROVE) network collection site MEVE. Atmospheric aerosol samples 20
are collected at IMPROVE sites on four separate filters for 24-h periods once every three days. Three filters collect only particles with diameters less than 2.5 µm (PM2.5). The mass ratios of collected particulate species are determined by several different analysis techniques (Hyslop and White, 2008). It is important to note that sulfate and nitrate aerosol are assumed to exist as ammonium sulfate and ammonium nitrate and 25
ACPD
10, 27631–27672, 2010Cloud condensation nuclei measurements
D. S. Ward and W. R. Cotton
Title Page
Abstract Introduction
Conclusions References
Tables Figures
◭ ◮
◭ ◮
Back Close
Full Screen / Esc
Printer-friendly Version Interactive Discussion
Discussion
P
a
per
|
Dis
cussion
P
a
per
|
Discussion
P
a
per
|
Discussio
n
P
a
per
|
Figure 2 shows the contribution to total PM2.5 by IMPROVE estimated species at MEVE averaged from 1999-2008 for the dates of the ISPA-III observations. Since the IMPROVE sampling day is every three days, the averages are for the three days cen-tered on the date shown in the figure. For example, the Sept. 18 average represents samples collected on 17, 18, or 19 September. The average aerosol mass concen-5
tration for this location was about 3 µg m−3during the September–October time period making MEVE one of the cleaner locations in the network, but typical for a site in the Rocky Mountains (Debell, 2006). Similar sulfate and organic aerosol mass are evident in Fig. 2 with only small contributions from nitrate aerosol and elemental carbon.
2.1 Methods
10
Two instruments were deployed to sample aerosols at MVNP: a Droplet Measurement Technologies (DMT) CCN-100 counter and a TSI 3010 condensation particle counter (CPC). These were setup inside a climate controlled building at the Mesa Verde Re-search Center. An inlet was installed on the building solely as an intake for the CCN-100 and CPC. The main inlet was constructed out of 4′′diameter aluminum tubing with 15
a sheltered opening at a height of 4.15 m above the ground and 3.1 m above the CCN-100 inlet manifold. At the bottom of the main inlet a fan was installed to maintain flow from the top of the tubing. Flow was directed from the main inlet to each instrument by a combination of 0.3 m 3/8′′copper tubing and flexible 12 mm (outside diameter) tubing (0.4 m for CCN-100, 0.7 m for CPC). The copper tubing is used to navigate the neces-20
sary change in flow direction from vertical (main inlet) to horizontal (inlet manifolds on the CCN-100 and CPC). To diminish the loss of particles by impaction on the tubing walls the copper tubing was bent only slightly in two locations and the remainder of the required 90◦turn was accomplished with the flexible tubing. The access opening of the copper tubing was tapered. The instrument shed was collocated with a meteorologi-25
ACPD
10, 27631–27672, 2010Cloud condensation nuclei measurements
D. S. Ward and W. R. Cotton
Title Page
Abstract Introduction
Conclusions References
Tables Figures
◭ ◮
◭ ◮
Back Close
Full Screen / Esc
Printer-friendly Version Interactive Discussion
Discussion
P
a
per
|
Dis
cussion
P
a
per
|
Discussion
P
a
per
|
Discussio
n
P
a
per
|
The DMT CCN-100 is a continuous-flow instrument that creates a controlled super-saturated environment within which particles can grow to droplet size. It was developed by Roberts and Nenes (2005) and has been used in many field programs and labora-tory studies since its introduction (e.g. Medina et al, 2007; Petters et al., 2007; Ervens et al., 2007; Cubison et al., 2008; Quinn et al., 2008; Gunthe et al., 2009). Supersatu-5
ration (SS) is produced and maintained in the CCN-100 by imposing a tightly controlled temperature gradient on the sheath/sample flow within a moist growth chamber. While the flow rates are kept constant the SS can be set higher or lower by increasing or decreasing the temperature gradient. Particles enter the growth chamber at slightly above the ambient temperature, flow up the temperature gradient through the super-10
saturated environment in the center of the chamber and either reach stable equilibrium or grow into cloud droplet size. An optical particle counter (OPC) detects droplets that have reached a threshold size and reports these as CCN. The threshold droplet diam-eter was set to 2 µm for the ISPA-III measurements. There is a risk at this size that a few of the smallest particles will activate but not have time to reach the threshold at the 15
SS settings that were used (Roberts and Nenes, 2005). The decision to use 2 µm was made to ensure consistency between this dataset and previously collected datasets at Storm Peak Lab (SPL) in northwestern Colorado. The CCN-100 was operated at a 10:1 sheath to sample flow ratio and at two values of SS: 0.3% and 0.5%. It was set to alternate between the two SS settings every 15 minutes, running continuously for the 20
entire project period taking one measurement per second.
The CCN-100 used at Mesa Verde was calibrated on 14 September 2009 at the DMT facility in Boulder, Colorado. The SS in the instrument is calibrated by sampling a distri-bution of particles for which the CCN activity is known, usually ammonium sulfate. The instrument-set SS is then compared to the theoretically determined SS and adjusted 25
for accuracy. Intrinsic instrumental uncertainty is less than 10% for the conditions ex-pected during this project (Roberts and Nenes, as cited by Quinn et al., 2008).
ACPD
10, 27631–27672, 2010Cloud condensation nuclei measurements
D. S. Ward and W. R. Cotton
Title Page
Abstract Introduction
Conclusions References
Tables Figures
◭ ◮
◭ ◮
Back Close
Full Screen / Esc
Printer-friendly Version Interactive Discussion
Discussion
P
a
per
|
Dis
cussion
P
a
per
|
Discussion
P
a
per
|
Discussio
n
P
a
per
|
that is saturated with butanol vapor and then down a temperature gradient to cause the vapor to condense onto the particles. The resulting droplets are counted by an OPC and divided by the flow volume to compute a particle number concentration. This system works with a large sample flow rate, which makes observing particles in very clean environments practical for a range in particle sizes. It was shown by Mertes et 5
al. (1995) that the lower detection limit of the CPC could be decreased to diameter (d)=5 nm particles by increasing the temperature difference between the saturation and condensation regions. This detection limit is defined as the diameter at which 50% of the particles will activate and become detectable. At Mesa Verde, the CPC was run with the recommended temperature differential which results in a lower detection limit 10
of approximatelyd=10 nm. The particles and CCN observed by these instruments will be described next.
2.2 Mesa Verde results
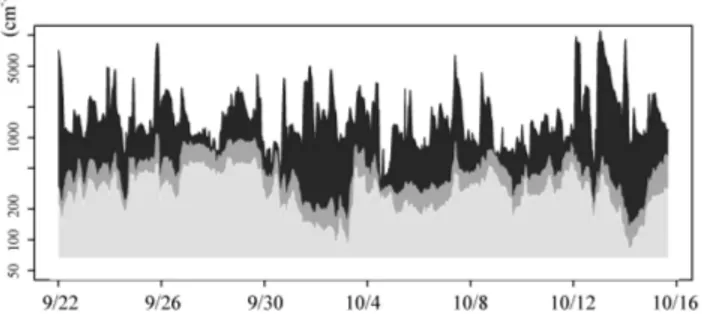
The time series ofNccn and Ncn for the entire project are shown in Fig. 3. The high-frequency data (one observation per second for the CCN-100 and one observation 15
per 10 s for the CPC) were smoothed using a 30-min running average. Note that a 30-min average of theNccn at a specific SS includes only 15 min of data because of the instrument SS cycling. For this averaging an assumption is made that the CCN-100 is sampling similar ambient air during the 30-minutes when the instrument cycles once through each SS. Data that met certain criteria were flagged and set as missing. 20
This was done any time the temperature gradient in the CCN-100 was not stabilized, which occurs between every change in instrument SS and sometimes lasts between 1–2 min. Other flagging criteria, including sharp changes in the air pressure and a significant change in the flow rate through either instrument, were not encountered. An attempt was made to eliminate observations that may have been contaminated by 25
ACPD
10, 27631–27672, 2010Cloud condensation nuclei measurements
D. S. Ward and W. R. Cotton
Title Page
Abstract Introduction
Conclusions References
Tables Figures
◭ ◮
◭ ◮
Back Close
Full Screen / Esc
Printer-friendly Version Interactive Discussion
Discussion
P
a
per
|
Dis
cussion
P
a
per
|
Discussion
P
a
per
|
Discussio
n
P
a
per
|
were identified, all occurring between the hours of 7:55am and 5:00pm local time and all on weekdays. Corresponding CCN observations were also disregarded, although the surges in that dataset were not as extreme.
Figure 3 shows the time series ofNccnat both SS values for the entire project. The averageNccn at SS=0.3% was 302 cm−3 and at SS=0.5% was 481 cm−3 (Table 1). 5
Episodes of comparable values ofNccnthat lasted for one to several days are evident in the time series. TheNcn, shown in Fig. 3, appears to vary on much shorter timescales. To further this comparison, the lag autocorrelations of each time series are given in Table 1. TheNccntime series exhibits a high autocorrelation, especially relative to that for theNcntime series. According to VanReken et al. (2003) this is an indication that 10
the largest particle number variations in time occur for particles that are either too small or non-hygroscopic to activate droplets at the prescribed SS.
A direct comparison of the observed CN and CCN is given by the activated fraction (see Table 1). The average values of activated fraction are well below 0.5. This is an indication that the majority of particles counted by the CPC are either too small or too 15
non-hygroscopic to activate at the instrument SS. These values for activated fraction compare well to observations of, presumably, aged continental aerosols collected by Gunthe et al. (2009) in the Amazon rain forest. In contrast, Bougiatioti et al. (2009) found activated fraction values well above 0.5 even at SS=0.4%. They sampled at a marine location where the aerosol is likely to be larger and consist principally of 20
sea-salt.
2.3 Regression analysis
Previous research shows that differences in the observed regional meteorology can ex-plain some of the variability in aerosol properties observed on board aircraft or at sur-face sites (e.g. VanReken et al., 2003; Medina et al., 2007; Quinn et al., 2008; Furutani 25
Bougia-ACPD
10, 27631–27672, 2010Cloud condensation nuclei measurements
D. S. Ward and W. R. Cotton
Title Page
Abstract Introduction
Conclusions References
Tables Figures
◭ ◮
◭ ◮
Back Close
Full Screen / Esc
Printer-friendly Version Interactive Discussion
Discussion
P
a
per
|
Dis
cussion
P
a
per
|
Discussion
P
a
per
|
Discussio
n
P
a
per
|
tioti et al. (2009). Moreover, it is difficult to test whether the relationship between the computed trajectories and observed aerosols would apply generally to future cases. In this section regression analysis will be used to investigate a more broadly applicable relationship between the large-scale wind and MVNP CCN and CN number concentra-tions.
5
The 700 mb and 500 mb geopotential height fields from the North American Regional Reanalysis (NARR) dataset (Mesinger et al., 2006) were used. NARR data are output on a 349x by 277y polar-stereographic grid with a horizontal grid spacing of about 32 km in the lower latitudes. The data are available in 3-h increments. Output from 9/23/09 00:00 GMT to 10/16/09 00:00 GMT was used to construct the time series of 10
the geopotential height fields.
In preparation for analysis, the 700 mb and 500 mb geopotential height fields were weighted by the cosine of the latitude. This essentially equalizes the influence of each grid point on the basis of grid-box area. The 24-h time mean was removed from all grid points. Missing data were removed from the dataset before analysis. Next, the time 15
series ofNcn andNccnfrom MVNP were averaged over 3-h time periods, centered on the corresponding NARR output time. The time series were standardized and the 24-h time mean was removed from each. Then, the 500 mb and 700 mb geopotential height time series were regressed onto the time series ofNccnandNcn. The resulting regres-sion maps were plotted and the correlations at each grid point were computed. The 20
correlations are used to test whether the regression relationship is significant and could be applied to cases outside of the ISPA-III observation period, or if the relationship is specific to this case and not representative of the potential population of regression coefficients at each grid point. The latter is the null hypothesis. The correlations were checked for significance against the null hypothesis using a two-tailed student t test. 25
An effective sample size was calculated for the test using equation 5.12 from Wilks (1995):
n′∼
=n1−ρ1
ACPD
10, 27631–27672, 2010Cloud condensation nuclei measurements
D. S. Ward and W. R. Cotton
Title Page
Abstract Introduction
Conclusions References
Tables Figures
◭ ◮
◭ ◮
Back Close
Full Screen / Esc
Printer-friendly Version Interactive Discussion
Discussion
P
a
per
|
Dis
cussion
P
a
per
|
Discussion
P
a
per
|
Discussio
n
P
a
per
|
where ρ1 is the lag-1 autocorrelation coefficient, n is the sample size and n′ is the effective sample size, or the equivalent number of independent samples. The effective sample size corrects for the persistence in the CCN dataset. The high persistence in the CCN datasets, given by the autocorrelations in Table 1, reduces the effective sam-ple size to 10. The result is the same whenn′is computed using the lag-1 autocorrela-5
tion for the 3-h standardized dataset. TheNcnseries varies on a shorter timescale and, therefore, has a higher effective sample size,n′=33. This is reduced in the regression analysis to one independent sample per day (n′=23), the assumed sample size for the NARR datasets. Significance was tested at the 95% confidence level.
Figure 4a shows the regression of the 700 mb height field onto theNccn(SS=0.3%) 10
time series. This is the pattern of 700 mb heights that explains the most variance in theNccn(SS=0.3%) time series. The pattern includes positive regression coefficients over the central and western United States, as well as over the northern Pacific. High (low) pressure in these regions was associated with high (low)Nccn at MVNP during this project. The dashed line indicates areas that would be statistically significant for 15
an effective sample size of n′=23, or one independent sample per day. None of the regression coefficients tested significant using the computedn′=10.
The pattern is similar for the regression of 700 mb height ontoNccn(SS=0.5%) and for 500 mb height ontoNccnat both values of SS (not shown). However, the regression onto theNcntime series (Fig. 4b) results in a region of negative regression coefficients 20
off the west coast of the United States. A large portion of this region is statistically significant at a 95% confidence level. The regression coefficients in the MVNP vicinity are not statistically significant at that level but the pattern, with negative regression coefficients to the west and positive to the east, suggests that south wind at 700 mb was associated with highNcnat MVNP.
25
2.4 Discussion
continu-ACPD
10, 27631–27672, 2010Cloud condensation nuclei measurements
D. S. Ward and W. R. Cotton
Title Page
Abstract Introduction
Conclusions References
Tables Figures
◭ ◮
◭ ◮
Back Close
Full Screen / Esc
Printer-friendly Version Interactive Discussion
Discussion
P
a
per
|
Dis
cussion
P
a
per
|
Discussion
P
a
per
|
Discussio
n
P
a
per
|
ously for a period of 24 days. TheNccnobservations varied within a range of about one order of magnitude and rarely exceeded 1000 cm−3at SS=0.5%. The averageNccnat the surface site was 302 cm−3at SS=0.3% and 481 cm−3at SS=0.5%. These values show that the MVNP environment is clean when compared to observations in the north-eastern and southnorth-eastern United States that typically average 2-3 times greater than 5
the MVNP measurements (Medina et al., 2007; Ervens et al., 2007; Hudson, 2007; Quinn et al., 2008). TheNccn observations at MVNP were remarkably episodic, with high or low events lasting for one to several days.
The MVNP measurements are comparable in magnitude toNcnandNccnat SPL col-lected in January and February of 2007 as reported by Saleeby et al. (2009) and Ward 10
et al. (2010). TheNccn observed at MVNP is on average somewhat higher, although this is not unexpected given the difference in seasons. Also, SPL should be expected to be somewhat cleaner because of its high altitude and disconnection from the more polluted surface layer below. The MVNP aerosol may be considered, by geographic proximity to SPL, to also be characteristic of rural continental airmasses, although typ-15
ically size distribution information would be used to make this distinction. CDNC and CCN observed at Elk Mountain in southern Wyoming also fall within the 200–400 cm−3 range although no SS is specified for these measurements (Politovich and Vali, 1983). Eltgroth and Hobbs (1979) measured ambient Ncn in excess of 3500 cm
−3
on three separate days in 1977. Although, they sampled air closer to the Four Corners power 20
plant and these observations are more than 30 years old.
At MVNP in 2009, it is unclear whether the large, local aerosol sources impacted the measurements ofNccnandNcn. Observed spikes inNcnwere not always accompanied by similar spikes inNccn. This could be evidence of the influence of a nearby combus-tion source introducing a large number of small particles into the environment (Medina 25
ACPD
10, 27631–27672, 2010Cloud condensation nuclei measurements
D. S. Ward and W. R. Cotton
Title Page
Abstract Introduction
Conclusions References
Tables Figures
◭ ◮
◭ ◮
Back Close
Full Screen / Esc
Printer-friendly Version Interactive Discussion
Discussion
P
a
per
|
Dis
cussion
P
a
per
|
Discussion
P
a
per
|
Discussio
n
P
a
per
|
dataset did not exhibit this same apparent connection to the local sources. If effluent from Four Corners and other local power plants were contributing particles to MVNP they were likely freshly formed and, therefore, too small to activate droplets.
The regression analysis indicates that high values ofNccnobserved at MVNP were associated with high pressure locally and further west. Although, the fact that the re-5
gression coefficients were not statistically significant, assuming 10 independent sam-ples of CCN, suggests that the height pattern expressed the influence of one or more specific events. Therefore it would not be appropriate to extend these conclusions to fu-ture cases. TheNcnat MVNP varied most with the pressure pattern offthe west coast of the US and Canada. This pattern was statistically significant using the described 10
criteria and could show that the aerosol number concentration at MVNP increases (de-creases) with southerly (northerly) flow that would often result from a strong low (high) pressure center offthe California coast.
3 KingAir observations
CCN data have been collected in northwestern Colorado at SPL (Saleeby et al., 2009), 15
and nearby at Elk Mountain (Politovich and Vali, 1983), and now in southwestern Col-orado (see Sect. 2). About 350 km separate these sites from north to south, a stretch through which much of the aerosol flowing into the central Rocky Mountains of Col-orado will pass on the prevailing westerlies that are common to the region. In Dec. of 2009, sixteen low-altitude transects of this region, also known as the Western Slope, 20
ACPD
10, 27631–27672, 2010Cloud condensation nuclei measurements
D. S. Ward and W. R. Cotton
Title Page
Abstract Introduction
Conclusions References
Tables Figures
◭ ◮
◭ ◮
Back Close
Full Screen / Esc
Printer-friendly Version Interactive Discussion
Discussion
P
a
per
|
Dis
cussion
P
a
per
|
Discussion
P
a
per
|
Discussio
n
P
a
per
|
3.1 The KingAir observational platform
The King Air 200T is a twin-propeller turboprop aircraft operated by the University of Wyoming in Laramie, WY, for tropospheric research. On-board instruments measure cloud physics parameters, atmospheric radiation and atmospheric state quantities. For the ISPA flights the main interest was sampling of aerosols and their CCN activity. For 5
this reason a CPC was operated aboard the aircraft as well as a Particle Measuring Systems passive cavity aerosol spectrometer probe (PCASP) for differentiating particle sizes and a static-diffusion, thermal-gradient CCN counter.
3.1.1 Instruments
The University of Wyoming (UWYO) CCNC-100A measuresNccnby subjecting ambient 10
aerosols to an environment that is supersaturated with respect to water and counting particles that activate droplets. The counter itself consists of a circular chamber with ports for sample intake and exhaust, temperature-controlled plates on top and bottom, and a photodetector. The theory and operation of this instrument is described by De-lene and Deshler (2000), Snider et al. (2003), and Snider et al. (2006). The method 15
for creating a supersaturated environment in the CCNC-100A is similar to that for the DMT continuous flow diffusion chamber in that a sharp temperature gradient across a small space is used to establish and control the SS. In the CCNC-100A, aerosols do not flow continuously through the region of maximum SS. Instead they are admitted into the chamber, which is then sealed off from the ambient air and flow. Particles 20
are allowed to diffuse within the chamber while being exposed to the supersaturated environment. Particles that require a SS below the instrument SS to activate will grow to droplet size. The abundance of droplets is monitored with the photodetector that measures the amount of light scattering caused by the droplets in the chamber. The photodetector voltage is proportional to the number of large particles (droplets) present 25
ACPD
10, 27631–27672, 2010Cloud condensation nuclei measurements
D. S. Ward and W. R. Cotton
Title Page
Abstract Introduction
Conclusions References
Tables Figures
◭ ◮
◭ ◮
Back Close
Full Screen / Esc
Printer-friendly Version Interactive Discussion
Discussion
P
a
per
|
Dis
cussion
P
a
per
|
Discussion
P
a
per
|
Discussio
n
P
a
per
|
The detection stage lasts for 20 s during which a steady SS is maintained within the chamber (Snider et al., 2006). Together with the time needed to flush the old sample out of the chamber, admit the new sample, and achieve the steady state SS, CCN measurements are expected at a frequency of once every 30–35 s (Delene and Deshler, 2000; Snider et al., 2006). In operation, the frequency of measurement was 5
about once every 40 s.
The temperature gradient within the chamber is monitored by thermocouples and the nominal SS (SSnom) is computed from the reported temperature gradient and chamber-top temperature. Water vapor is supplied to the chamber by wetted pads that are re-moistened every 1–2 h. Snider et al. (2006) report that the activation behavior of 10
particles in the CCNC-100A is characteristic of a SS below the SSnom. They define an effective SS (SSeff) to describe this behavior. The reasons for the departure are not entirely understood but through experimentation, Snider et al. (2006) defined a technique for computing Seff. Thus, the SSnom values of 0.4%, 0.8% and 1.6% set during the December flights correspond to SSeff values of about 0.27%, 0.54% and 15
1.08%. It is assumed in the following analysis that the SSeff represents the true SS experienced by particles within the chamber. Overall uncertainty in the CCN count has been estimated to be±40% (Snider and Brenguier, 2000) and, more recently, ±30% (Snider et al., 2006). These estimates do not include detector error associated with the random positions of droplets within the supersaturated chamber. Estimating this error 20
will be explained below since it also applies to the PCASP detection methods.
The PCASP is an optical particle counter, measuring the forward scattered light from particles passing through a laser beam (Snider and Petters, 2008). The scattering is relative to particle size (assuming particles are spherical) so particles intercepted by the PCASP beam can be separated into size bins. Reliable sizing can be done for par-25
ACPD
10, 27631–27672, 2010Cloud condensation nuclei measurements
D. S. Ward and W. R. Cotton
Title Page
Abstract Introduction
Conclusions References
Tables Figures
◭ ◮
◭ ◮
Back Close
Full Screen / Esc
Printer-friendly Version Interactive Discussion
Discussion
P
a
per
|
Dis
cussion
P
a
per
|
Discussion
P
a
per
|
Discussio
n
P
a
per
|
is dry enough to rule out wetted particles, heaters are installed at the inlet. Moreover, typical ambient RH during the December flights was well below the RH=40% quality threshold recommended by Snider and Petters (2008). The sample flow rate is not constant but averages about 1 cm3s−1. The bin number concentration is defined as the count rate divided by the flow rate for each sample.
5
Both CCNC-100A and PCASP use photodetectors that detect only a fraction of par-ticles in each sample. For example, the CCNC-100A chamber fills with activated droplets during the detection stage, but only those droplets that cross the detector beam are counted. The count is considered representative of the entire population, but the droplets are randomly arranged. At the time of detection, they may be arranged 10
such that a larger (or smaller) than representative number lie in the path of the detector beam. Snider et al. (2006) point out that the many arrangements of particles can be represented using a Poisson distribution. Then the average error, known as Poisson error, can easily be estimated for each PCASP size bin using the following expression from Snider et al. (2006):
15
σi=
p
Ci V·log DiDi−1
(2)
where Ci is the count rate for bin i, V is the sample volume, and D represents the diameter limits of size bini. Thus, the Poisson error is proportional to the square root of the particle count and will increase for higher number concentrations, but increase in proportion relative to the total count as the number concentration gets smaller (Snider 20
and Brenguier, 2000).
3.2 ISPA flight plan
ACPD
10, 27631–27672, 2010Cloud condensation nuclei measurements
D. S. Ward and W. R. Cotton
Title Page
Abstract Introduction
Conclusions References
Tables Figures
◭ ◮
◭ ◮
Back Close
Full Screen / Esc
Printer-friendly Version Interactive Discussion
Discussion
P
a
per
|
Dis
cussion
P
a
per
|
Discussion
P
a
per
|
Discussio
n
P
a
per
|
dataset along the Western Slope. Flight days were separated into three flow regimes based on the general direction of the wind at 700 mb and 500 mb in the western United States. Composite images of 500 mb heights for each regime are shown in Fig. 5. The westerly regime was characterized by zonal flow from the west coast through Col-orado. The remaining flights were conducted on days with a 500 mb ridge to the west 5
of Colorado and a trough to the east. The amplitude of the ridge/trough pattern dic-tated whether flow through western Colorado was northwesterly or northerly. Distant sources of particles to the southwest, such as the southern California urban areas, were of interest but unfortunately no episodes of southwest flow were observed.
Dates and other information about each flight are given in Table 2. As indicated in 10
Table 2, two separate flight plans were used (shown in Fig. 1). The first was used for the westerly and northwesterly regimes. Vertical profiles were taken just west of Steamboat Springs and over Cortez. These were done in “vertical stacks” where the aircraft flies at a constant altitude for 40–60 km then turns 180 degrees and abruptly rises, repeating the 40–60 km leg at a higher altitude and in the opposite direction. The 15
stacks included 5 altitudes, the lowest between 250–500 m above ground level (a.g.l.) and increasing about 500 m on each leg with some variation. Flight plan #2 was used during northerly wind events. It differed mainly in the location of the southern stack, which was moved north to Nucla to sample flow into the San Juan Mountains better in this regime. The north to south transects were similar in both flight plans. These were 20
flown at constant height above mean sea level meaning the distance above ground level varied, but in general this was less than 1000 m a.g.l. The flight leg between Laramie and the northern stack was necessarily run at higher altitudes and was used for instrumental setup. Data from this leg are not included in the analysis.
3.3 Results
25
ACPD
10, 27631–27672, 2010Cloud condensation nuclei measurements
D. S. Ward and W. R. Cotton
Title Page
Abstract Introduction
Conclusions References
Tables Figures
◭ ◮
◭ ◮
Back Close
Full Screen / Esc
Printer-friendly Version Interactive Discussion
Discussion
P
a
per
|
Dis
cussion
P
a
per
|
Discussion
P
a
per
|
Discussio
n
P
a
per
|
the voltage, and interpretedNccn, were set to missing. PCASP aerosol size distribution bins and CPC particle number were averaged over 20-s time periods (20 observa-tions), beginning ten seconds before the CCN instrument chamber opened and ending ten seconds after it was opened. The averaged values were then matched with the
Nccncomputed from the aerosol that entered the chamber. 5
Nccnis plotted against SSeff for all valid data points except those collected during the vertical profiles in Fig. 6. The mean observedNccn indicate a clean atmosphere with only a few observations ofNccn>200 cm−3at the lowest SSef f. This plot also illustrates
the expected increase inNccn with increasing SSeff that has been represented using the power law relationship from Twomey (1959). The dataset is separated into large-10
scale flow regimes, as defined in Fig. 5, and the composite plots are shown as different colors. The meanNccn was similar for the northerly (red) and northwesterly regimes (green), although the latter was less variable. The westerly regime (blue) was cleaner in general, with a meanNccnof about 50 cm−3at SSeff=0.27%.
To test for spatial trends in theNccnalong the horizontal transects, the SSeff=0.27% 15
data were binned by latitude. The latitude bins were averaged and plotted for all tran-sects in Fig. 7. Nccn averaged higher in the northern portion of the flights, but the difference was slight. In general, Nccn varied little along the Western Slope. The lati-tude bin-averageNcnis also plotted on Fig. 7 (on a different scale) to show the variation in activated fraction. Values of activated fraction were low in magnitude across the en-20
tire flight track, although higher in the southern portions than in the north. Only 5–10% of particles counted by the CPC were cloud active, on average. The implications are that greater than 90% of the ambient particles along the flight track were too small or non-hygroscopic to activate droplets at SSeff=0.27%. Values of activated fraction were about twice as high on average at MVNP for SS=0.3%.
25
ACPD
10, 27631–27672, 2010Cloud condensation nuclei measurements
D. S. Ward and W. R. Cotton
Title Page
Abstract Introduction
Conclusions References
Tables Figures
◭ ◮
◭ ◮
Back Close
Full Screen / Esc
Printer-friendly Version Interactive Discussion
Discussion
P
a
per
|
Dis
cussion
P
a
per
|
Discussion
P
a
per
|
Discussio
n
P
a
per
|
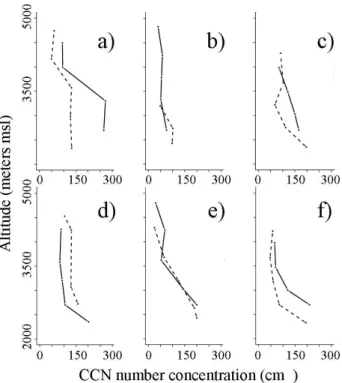
A distance of 40–60 km was flown at each stack leg to collect several data points at each SSnomat a constant altitude, and legs were repeated if necessary. The data were averaged over each altitude, disregarding horizontal variations in sampling along the flight leg. For the purpose of plotting these data, any stack leg with less than 3 valid data points was set as missing. The altitude of the stacks sometimes varied between 5
profiles, usually because clouds were encountered at target altitudes. The approxi-mate ground levels at the three locations are 2100 m m.s.l. for Steamboat Springs, 2000 m m.s.l. for Cortez and 1850 m m.s.l. for Nucla.
The vertical profiles are given in Fig. 8 for all stacks. They are set in order by date and time flown and show Nccnfor all three SSnom settings and also Ncn. On occasion 10
the Nccn plotted for a lower SSeff exceeds that plotted for a higher SSeff. Recall that the CCNC-100A makes one observation every 40 s. Over a 40 km or 60 km flight leg, the CCNC-100A is sampling proximate air parcels at each SSnom, but not the same air parcels. Therefore it is possible to bias measurements at a particular SS. In general, the King Air 200T flew through higher numbers of particles and cloud-active particles 15
in the lowest level of the stack compared to the highest level. This difference was most pronounced on the F7 and F8 flights for both northern and southern stacks (Fig. 8e and f). Still, theNccnaverage at SSeff=0.27% never exceeded 200 cm
−3
even at the lowest altitudes. Activated fraction did not vary considerably with height for the majority of profiles.
20
On the F1 and F5 flights (Fig. 8a and 8c),NccnandNcndid not decrease constantly with altitude. Instead, a relative clean layer was observed on these days with slightly higher Nccn and Ncn in the altitudes above the clean layer. During the F1 stacks the clean layer was evident in both the northern and southern profiles and at similar alti-tudes. For F5, the clean layer was more pronounced in the southern stack and difficult 25
to discern in the northern stack.
ACPD
10, 27631–27672, 2010Cloud condensation nuclei measurements
D. S. Ward and W. R. Cotton
Title Page
Abstract Introduction
Conclusions References
Tables Figures
◭ ◮
◭ ◮
Back Close
Full Screen / Esc
Printer-friendly Version Interactive Discussion
Discussion
P
a
per
|
Dis
cussion
P
a
per
|
Discussion
P
a
per
|
Discussio
n
P
a
per
|
were characterized by northerly or northwesterly flow. This suggests that the King Air 200T was sampling within the same, or similar airmasses. This may be intuitive for north and south stacks under northerly flow, but it is an important point to make. Aerosol measurements are more available in northwestern Colorado in comparison to southwestern Colorado. It now appears that, especially under north and northwesterly 5
winds, the northern measurements could be used to estimate Nccn in the southern locations. In contrast, the vertical profiles for the westerly flow flights F4 and F5 do not appear to be as consistent from north to south. Differences in aerosol sources to the west of the Colorado mountains may lead to these inconsistencies with westerly winds.
3.4 CCN prediction
10
3.4.1 CCN closure review
CCN closure is regarded as one of the most effective techniques for evaluating the character of ambient CCN-active aerosol and assessing our ability to predict their CCN activity. A CCN closure study, as explained by VanReken et al. (2003), is an attempt to match observed CCN number concentrations with those predicted using one of several 15
methods, usually involving knowledge of the aerosol size distribution, composition, or both. Only when CCN number concentration is predicted nearly perfectly is closure achieved. Squires and Twomey (1961) and Twomey and Warner (1967) published two of the earliest studies along these lines, although their goal was not to show whether CCN could be predicted but instead to find out whether CCN could be used to predict 20
CDNC. In the process they showed that CCN were related to CDNC observed in the low-levels of nearby clouds.
More recent closure studies use Kohler theory to modelNccnat a fixed SS. Covert et al. (1998) describe one of the first attempts at CCN closure using this method. They measuredNccn with a static diffusion, thermal gradient instrument at a coastal site in 25
ACPD
10, 27631–27672, 2010Cloud condensation nuclei measurements
D. S. Ward and W. R. Cotton
Title Page
Abstract Introduction
Conclusions References
Tables Figures
◭ ◮
◭ ◮
Back Close
Full Screen / Esc
Printer-friendly Version Interactive Discussion
Discussion
P
a
per
|
Dis
cussion
P
a
per
|
Discussion
P
a
per
|
Discussio
n
P
a
per
|
from the Kohler equations using the hygroscopic growth information and temperature and SS set in the CCN counter. The number of observed particles larger than the critical size is counted and regarded as the prediction ofNccnused to test for closure. Covert et al. (1998) found thatNccnwas, on average, overpredicted but only by about 20%. Subsequent studies have achieved a wide range of results with respect to CCN 5
closure. Chuang et al. (2000) systematically, and substantially, underpredicted CCN in marine aerosol samples. The majority of their error probably resulted from instrument bias but they also note the importance of the treatment of aerosol composition in CCN prediction.
In contrast, a CCN closure study in south Florida reported by VanReken et al. (2003) 10
found excellent agreement between measured and predictedNccn while assuming all particles were composed of pure ammonium sulfate. While they speculated that the simplified representation of aerosol composition might apply in other environments, this was not the case for rural continental aerosol sampled by Medina et al. (2007). They observed CCN and size-dependent aerosol composition at a site in southern 15
New Hampshire for 7 days in August. By including a size-dependent insoluble fraction parameter, based on the observations, in their CCN model, they realized substantial improvement in CCN predictions relative to CCN measurements.
Recent attempts have focused on measuring aerosol hygroscopicity as the key to achieving CCN closure (Ervens et al., 2007; Quinn et al., 2008; Furutani et al., 2008; 20
Bougiatioti et al., 2009). Broekhuizen et al. (2006) and Cubison et al. (2008) both show evidence that CCN closure can be improved with knowledge of size-dependent composition. Cubison et al. (2008) also found that assumptions about the aerosol mix-ing state (internal or external) can adversely impact CCN predictions. They sampled aerosol near Los Angeles, California in an urban airmass. For this case, assuming an 25
ACPD
10, 27631–27672, 2010Cloud condensation nuclei measurements
D. S. Ward and W. R. Cotton
Title Page
Abstract Introduction
Conclusions References
Tables Figures
◭ ◮
◭ ◮
Back Close
Full Screen / Esc
Printer-friendly Version Interactive Discussion
Discussion
P
a
per
|
Dis
cussion
P
a
per
|
Discussion
P
a
per
|
Discussio
n
P
a
per
|
al. (2007) aptly reflects the current state of CCN closure studies by pointing out that inadequate understanding of aerosol composition effects on hygroscopicity and instru-ment inaccuracies are the main barriers to achieving CCN closure.
3.4.2 CCN closure attempt
As in the studies outlined above, to predict Nccn for the King Air horizontal transects, 5
information about the aerosol size distribution and composition, more specifically hy-groscopicity, are needed. To compute the critical size for each sample, the temperature and SS are set equal to the conditions in the CCNC-100A. Size distribution data are given by the PCASP.
Hygroscopicity has traditionally been approximated using estimates of ion dissoci-10
ation and the proportion of soluble material contained in the droplet nucleus. These approximations are not always appropriate for describing hygroscopicity, according to Pruppacher and Klett (1997). Recently Petters and Kreidenweis (2007) introduced a more functional representation of hygroscopicity. They show how the expression for water activity,aw, can be simplified to a function of the ratio between dry particle vol-15
ume (Va) and water volume (Vw) using a single parameter, κ. In Eq. (2) from Petters and Kreidenweis (2007):
1
aw=1+κ Vs
Vw (3)
Theκparameter is determined experimentally for different aerosol species and is listed by Petters and Kreidenweis (2007) for most common aerosol constituents. They also 20
show that the hygroscopicity of particles containing more than one chemical species, known as internal mixtures, can be computed simply as a volume-weighted averageκ:
κ=X
i
εiκi (4)
ACPD
10, 27631–27672, 2010Cloud condensation nuclei measurements
D. S. Ward and W. R. Cotton
Title Page
Abstract Introduction
Conclusions References
Tables Figures
◭ ◮
◭ ◮
Back Close
Full Screen / Esc
Printer-friendly Version Interactive Discussion
Discussion
P
a
per
|
Dis
cussion
P
a
per
|
Discussion
P
a
per
|
Discussio
n
P
a
per
|
introduction, κ has been used to represent hygroscopicity in both observational (e.g. Gunthe et al., 2009; Koehler et al., 2009) and modeling studies (e.g. Reutter et al., 2009; Eidhammer et al., 2009).
Since composition measurements were not taken during this project, a reasonable estimate of aerosol hygroscopicity must be used instead. This estimate is, unfortu-5
nately, constrained by the detection limits of the PCASP. The PCASP lower size limit for reliable measurements was given as 0.135 µm earlier in this section. However, even at SSeff=0.27% and the average temperature of the CCNC-100A, a particle with the hygroscopicity of ammonium sulfate corresponds to a critical diameter of 0.07 µm. Therefore, if the value of κ for ammonium sulfate were used to predict Nccn, an un-10
measured portion of the aerosol size distribution would exist above the critical size. These particles would go uncounted andNccn could be underpredicted considerably. Only less hygroscopic particles would possess a critical size larger than 0.135 µm. To ensure that the computed critical size will fall within the detection range of the PCASP at SSnom=0.4% (SSeff approximately 0.27%), a value ofκ≤0.125 must be assumed. 15
A value ofκ=0.1 is used for this study. This is equivalent to assuming the sampled aerosol have a low hygroscopicity, more characteristic of organic aerosol species than sulfates or nitrates.
Using the estimated κ=0.1, a critical diameter is computed using the forms of the K ¨ohler equations given in Petters and Kreidenweis (2007). This is done separately for 20
each sample since the SSeff and average chamber temperature vary from sample to sample. Particles in size bins greater than the critical size, as counted by the PCASP, are summed. The sum is regarded as the predictedNccn. Note, due to the limitations of the PCASP size range, only CCN measurements at SSnom=0.4% were used in this analysis.
25
ACPD
10, 27631–27672, 2010Cloud condensation nuclei measurements
D. S. Ward and W. R. Cotton
Title Page
Abstract Introduction
Conclusions References
Tables Figures
◭ ◮
◭ ◮
Back Close
Full Screen / Esc
Printer-friendly Version Interactive Discussion
Discussion
P
a
per
|
Dis
cussion
P
a
per
|
Discussion
P
a
per
|
Discussio
n
P
a
per
|
instrument uncertainty as estimated by Snider et al. (2006). The PCASP uncertainty is shown as the sum of the Poisson error for each size bin used forNccn prediction. Despite the low prescribed value ofκ, the data do not exhibit an obvious underpredic-tion bias. Instrument bias aside, this indicates that the sampled aerosol had very low hygroscopicity (κ<0.1, in general). There is no specific reason to expect instrument 5
bias, but as Stroud et al. (2007) note, this should not be ruled out for these instru-ments. Figure 9 also shows substantial spread of the data points. The assumptions made concerning the aerosol composition and mixing state probably contributed to the spread and, clearly, instrument uncertainty played a large role. In general,Nccn was predicted within a factor of two when compared to the measurements. The results of 10
this analysis are consistent with the observation of very low activated fraction that was made using the CPC.
The CCN closure plot is separated into flow regime by colors in Fig. 9. The noted differences in magnitude of Nccn between regimes are apparent. Low values ofNccn, mainly between 30 and 50 cm−3, were observed under westerly flow and these were 15
consistently underpredicted. Observations under northwesterly flow show the largest average deviation from the plotted 1:1 relation line. This could indicate a change in aerosol mixing state or average composition sampled during these flights.
The low aerosol hygroscopicity estimated from these observations was particularly noteworthy. Values of κ around 0.1 are indicative of a dominant organic or insolu-20
ble aerosol component and a minor contribution from the more hygroscopic inorganic species. This is inconsistent with observations from the IMPROVE network site at Mount Zirkel (MOZI) in the Colorado Park Range. The composition of the PM2.5aerosol sampled at MOZI in December from 1999–2008 averaged more than 50% sulfate and nitrate by mass. This is corroborated by the analysis of Borys et al. (2000) who found 25
ACPD
10, 27631–27672, 2010Cloud condensation nuclei measurements
D. S. Ward and W. R. Cotton
Title Page
Abstract Introduction
Conclusions References
Tables Figures
◭ ◮
◭ ◮
Back Close
Full Screen / Esc
Printer-friendly Version Interactive Discussion
Discussion
P
a
per
|
Dis
cussion
P
a
per
|
Discussion
P
a
per
|
Discussio
n
P
a
per
|
mass except during dust events. In light of these observations, it is possible that the estimated hygroscopicity values in this study are biased low either due to the instru-mentation or the method of estimation. A more robust method for predictingNccnfrom aerosol size distribution information was introduced by Petters et al. (2007) but this method requires size-selection of particles during sampling.
5
4 Summary and conclusions
In combination with observations from MVNP and SPL, the foundation for fall and winter season CCN climatologies now exists for the Western Slope. TheNccn and activated fractions are consistent with remote continental, aged aerosol. These characteristics were true from SPL, south to MVNP, and somewhat consistent in time as well as space. 10
This result suggests that variability of CCN in this region may be less important than originally thought. This has implications for studies of aerosol effects on orographic clouds in this region. CCN flowing in to the San Juan Mountains and other locations along the Western Slope can be estimated by the available measurements from north-western Colorado, at least for particular wind regimes and seasons. This may also 15
be encouraging from a modeling perspective. The lack of variability associated with CCN along the Western Slope could justify simplified representations of aerosols in numerical simulations, provided the simplifications are based on averaged observed quantities.
Several conclusions about the nature of CCN flowing into the Colorado Rocky Moun-20
tains from the Western Slope can be drawn from these results. The CCN observed at SPL, MVNP, and on a line between the two sites, was characteristic of rural continen-tal aerosol as defined by Seinfeld and Pandis (2006). For rural continencontinen-tal aerosols, the particle number distribution is dominated by a nuclei (Aitken) mode, particle sur-face area is largest in the accumulation mode, and particle mass is dictated by a small 25
ACPD
10, 27631–27672, 2010Cloud condensation nuclei measurements
D. S. Ward and W. R. Cotton
Title Page
Abstract Introduction
Conclusions References
Tables Figures
◭ ◮
◭ ◮
Back Close
Full Screen / Esc
Printer-friendly Version Interactive Discussion
Discussion
P
a
per
|
Dis
cussion
P
a
per
|
Discussion
P
a
per
|
Discussio
n
P
a
per
|
According to Seinfeld and Pandis (2006), the nuclei mode receives its largest con-tributions of particles from local anthropogenic sources. This is difficult to reconcile with the December observations of CCN along the Western Slope that suggest local sources make only minor contributions to the regional CCN field. One explanation is that number fluctuations in the nuclei mode do not impact CCN at ambient SS due to 5
their small size. The CCN in this region would then be dependent on the aged, accu-mulation mode particles that are more likely to have regional or distant origins. The observations from MVNP, whereNcnwas highly variable butNccnchanged slowly and within a much smaller range, support this view. Additionally, the low activated frac-tion computed from the measurements suggests that a large number of the ambient 10
particles are too small to activate droplets at the set values of SS.
Many questions remain unanswered, especially concerning the sources of the CCN, and potential differences with season that are not captured here. Future studies should incorporate aerosol composition measurements, as suggested by Medina et al. (2007) or include size-separated CCN sampling as an estimate of aerosol hygroscopicity as in 15
Petters et al. (2007). With these additional measurements the speculative conclusions of this work could be better substantiated.
Acknowledgements. The authors would like to thank George San Miguel of the National Park Service and Ian McCubbin of the Desert Research Institute (DRI), as well as Larry Oolman and the rest of the King Air facility stafffor essential logistical support. We would also like to
20
ACPD
10, 27631–27672, 2010Cloud condensation nuclei measurements
D. S. Ward and W. R. Cotton
Title Page
Abstract Introduction
Conclusions References
Tables Figures
◭ ◮
◭ ◮
Back Close
Full Screen / Esc
Printer-friendly Version Interactive Discussion
Discussion
P
a
per
|
Dis
cussion
P
a
per
|
Discussion
P
a
per
|
Discussio
n
P
a
per
|
References
Andreae, M. O.: Aerosols before pollution, Science, 315, doi:10.1126/science.1136529, 2007. Andreae, M. O. and Rosenfeld, D.: Aerosol–cloud–precipitation interactions. Part 1.
The nature and sources of cloud-active aerosols, Earth-Sci. Rev., 89, 13–41, doi:10.1016/j.earscirev.2008.03.001, 2008.
5
Borys, R. D., Lowenthal, D. H., Cohn, S. A., and Brown, W. O. J.: Mountaintop and radar measurements of anthropogenic aerosol effects on snow growth and snowfall rate, Geophys. Res. Lett., 30(10), 1538, doi:10.1029/2002GL016855, 2003.
Borys, R. D., Lowenthal, D. H., and Mitchell, D. L.: The relationship among cloud microphysics, chemistry, and precipitation rate in cold mountain clouds, Atmos. Environ., 34, 2593–2602,
10
2000.
Bougiatioti, A., Fountoukis, C., Kalivitis, N., Pandis, S. N., Nenes, A., and Mihalopoulos, N.: Cloud condensation nuclei measurements in the marine boundary layer of the eastern Mediterranean: CCN closure and droplet growth kinetics, Atmos. Chem. Phys., 9, 7053– 7066, doi:10.5194/acp-9-7053-2009, 2009.
15
Broekhuizen, K., Chang, R. Y.-W., Leaitch, W. R., Li, S.-M., and Abbatt, J. P. D.: Closure be-tween measured and modeled cloud condensation nuclei (CCN) using size-resolved aerosol compositions in downtown Toronto, Atmos. Chem. Phys., 6, 2513–2524, doi:10.5194/acp-6-2513-2006, 2006.
Charlson, R. J., Seinfeld, J. H., Nenes, A., Kulmala, M., Laaksonen, A., and Facchini, M. C.:
20
Reshaping the theory of cloud formation, Science, 292, 2025–2026, 2001.
Chuang, P. Y., Collins, D. R., Pawlowska, H., Snider, J. R., Jonsson, H. H., Brenguier, J. L., Flagan, R. C., and Seinfeld, J. H.: CCN measurements during ACE-2 and their relationship to cloud microphysical properties, Tellus, 52B, 843–867, 2000.
Covert, D. S., Gras, J. L., Wiedensohler, A., and Stratmann, F.: Comparison of directly
mea-25
sured CCN with CCN modeled from the number-size distribution in the marine boundary layer during ACE 1 at Cape Grim, Tasmania, J. Geophys. Res.-Atmos., 103, 16597–16608, 1998.
Cubison, M. J., Ervens, B., Feingold, G., Docherty, K. S., Ulbrich, I. M., Shields, L., Prather, K., Hering, S., and Jimenez, J. L.: The influence of chemical composition and mixing state of
30