ACPD
10, 4189–4223, 2010The role of the particle size
distribution
D. S. Ward et al.
Title Page
Abstract Introduction
Conclusions References
Tables Figures
◭ ◮
◭ ◮
Back Close
Full Screen / Esc
Printer-friendly Version
Interactive Discussion
Atmos. Chem. Phys. Discuss., 10, 4189–4223, 2010 www.atmos-chem-phys-discuss.net/10/4189/2010/ © Author(s) 2010. This work is distributed under the Creative Commons Attribution 3.0 License.
Atmospheric Chemistry and Physics Discussions
This discussion paper is/has been under review for the journal Atmospheric Chemistry and Physics (ACP). Please refer to the corresponding final paper in ACP if available.
The role of the particle size distribution in
assessing aerosol composition e
ff
ects on
simulated droplet activation
D. S. Ward1, T. Eidhammer2, W. R. Cotton1, and S. M. Kreidenweis1
1
Atmospheric Science, Colorado State University, Fort Collins, Colorado, USA
2
National Center for Atmospheric Research, Boulder, Colorado, USA
Received: 21 January 2010 – Accepted: 3 February 2010 – Published: 11 February 2010 Correspondence to: D. S. Ward ([email protected])
Published by Copernicus Publications on behalf of the European Geosciences Union.
ACPD
10, 4189–4223, 2010The role of the particle size
distribution
D. S. Ward et al.
Title Page
Abstract Introduction
Conclusions References
Tables Figures
◭ ◮
◭ ◮
Back Close
Full Screen / Esc
Printer-friendly Version
Interactive Discussion
Abstract
Variations in the chemical composition of atmospheric aerosols alter their hygroscop-icity and can lead to changes in the cloud-active fraction of the aerosols, or cloud con-densation nuclei (CCN) number concentration. To investigate the importance of this effect under different atmospheric conditions, cloud droplet formation was simulated
5
with a Lagrangian parcel model. Initial values of updraft speed and temperature were systematically varied along with aerosol number concentration, size and hygroscopicity (represented by the hygroscopicity parameter,κ). A previous study classifies the sen-sitivity of CCN activity to compositional changes based on the supersaturation reached in the parcel model. We found that these classifications could not be generalized to a
10
range of aerosol size distribution median radii. Instead, variations in sensitivity with size depend on the location of the dry critical radius for droplet activation relative to the size distribution median radius. The parcel model output was used to construct droplet ac-tivation lookup tables based onκ that were implemented in the Regional Atmospheric Modeling System (RAMS) microphysical scheme. As a first application of this system,
15
aerosol hygroscopicity and size were varied in a series of RAMS mesoscale simula-tions designed to investigate the sensitivity of a mixed-phase orographic cloud case to the parameter variations. Observations from a recent field campaign in northwestern Colorado provided the basis for the aerosol field initializations. Model results show moderate sensitivity in the distribution of total case precipitation to extreme changes in
20
κ, and minimal sensitivity to observed changes in estimatedκ. The impact of varying aerosol hygroscopicity diminished with increasing median radius, as expected from the parcel model results. The conclusions drawn from these simulations could simplify sim-ilar research in other cloud regimes by defining the need, or lack of need, for detailed knowledge of aerosol composition.
ACPD
10, 4189–4223, 2010The role of the particle size
distribution
D. S. Ward et al.
Title Page
Abstract Introduction
Conclusions References
Tables Figures
◭ ◮
◭ ◮
Back Close
Full Screen / Esc
Printer-friendly Version
Interactive Discussion
1 Introduction
K ¨ohler theory predicts that the chemical composition of an atmospheric particle partly determines its ability to activate as a cloud droplet. Changes in the composition of a droplet nucleus can alter the supersaturation required for activation, or critical su-persaturation (Sc), of the solution droplet through the solute effect and surface tension
5
effects (Pruppacher and Klett, 1997). In these ways, aerosol composition can influence cloud condensation nuclei (CCN) number concentrations. In fact, unknown or variable aerosol composition is often cited as the main source of error in CCN closure studies that attempt to model observed CCN activity using observed aerosol characteristics (e.g., Cantrell et al., 2001; Rissman et al., 2006; Bougiatioti et al., 2009).
10
While laboratory and field studies have clearly shown that CCN activity depends on aerosol composition, the degree of the dependence for atmospheric aerosol has been the subject of recent debate. Several single-site observational studies have found that CCN number concentrations active at a specified supersaturation can be predicted accurately without detailed knowledge of the aerosol chemical composition (Dusek et
15
al., 2006; Ervens et al., 2007; Medina et al., 2007). In contrast, the measurements of Hudson (2007) and Quinn et al. (2008) show substantial variability in the CCN activity of aerosol sampled in different air masses of both continental and marine origin.
Since simplifications of the complex composition of ambient aerosol are sought for modeling applications, the debate about the level of detail to which composition must
20
be known has important implications for studies of aerosol direct and indirect effects on regional and global scales (Dusek et al., 2006). Recently, Reutter et al. (2009) re-ported the results from a parcel model study of aerosol composition effects on CCN activity in pyrocumulus cloud conditions that simplified the treatment of compositional dependence by defining environmental regimes. These regimes were based on the
25
ratio of updraft speedwto particle number concentrationNcn. Conditions with low val-ues of this ratio were classified as updraft-limited (w/Ncn<≈10−4ms−1/(cm−3)) and
high values as aerosol-limited (w/Ncn>≈10−3ms−1/(cm−3)) with a transition regime
ACPD
10, 4189–4223, 2010The role of the particle size
distribution
D. S. Ward et al.
Title Page
Abstract Introduction
Conclusions References
Tables Figures
◭ ◮
◭ ◮
Back Close
Full Screen / Esc
Printer-friendly Version
Interactive Discussion
between these two extremes (10−4ms−1/(cm−3)<
≈w/Ncn<≈10−
3
ms−1/(cm−3)). The median radius of the input lognormal aerosol size distribution was held fixed. They found that changes in composition had an insignificant effect on droplet activation in the aerosol-limited regime and a moderate impact on droplet number concentrations for updraft-limited conditions.
5
In Reutter et al. (2009), as in previous studies (e.g., Feingold, 2003; Rissman et al., 2004; McFiggans et al., 2006), a sensitivity parameter was defined to describe the effects of perturbations in aerosol or environmental characteristics on droplet number concentrations or droplet effective radii. We adopt the same convention as Reutter et al. (2009), who defined the sensitivity parameter as the logarithmic change in droplet
10
number concentrationNd with the logarithmic change in a specified chemical or physi-cal parameterXi:
S(Xi)= ∂lnNd
∂lnXi
(1)
In this paper, we consider the Reutter et al. (2009) environmental regimes, but vary the lognormal median aerosol radius used to initialize the parcel model, to examine
15
the role of particle size on CCN activity with changing composition. The results of the simulations were also used to construct droplet activation lookup tables with aerosol hygroscopicity as an independent variable, expanding on the original design of Saleeby and Cotton (2004) which has been applied in several cloud-scale modeling studies (e.g., van den Heever and Cotton, 2007; Cheng et al., 2009). These lookup tables were
20
implemented in the Colorado State University version of the Regional Atmospheric Modeling System (RAMS; Cotton et al., 2003). Here we use the new droplet activation scheme to investigate the susceptibility of a simulated mixed-phase orographic cloud to variations in aerosol characteristics.
The distribution of precipitation from orographic clouds in which liquid and ice
par-25
ACPD
10, 4189–4223, 2010The role of the particle size
distribution
D. S. Ward et al.
Title Page
Abstract Introduction
Conclusions References
Tables Figures
◭ ◮
◭ ◮
Back Close
Full Screen / Esc
Printer-friendly Version
Interactive Discussion
of the collector ice crystal and the size of the cloud droplets being collected, and de-creases rapidly for droplets with diameters below 10 µm (Pruppacher and Klett, 1997). Therefore, an increase in CCN, if resulting in smaller droplet sizes, can decrease rim-ing, leading to suppressed precipitation totals on the windward side of the orogra-phy and increased accumulated precipitation on the leeward slope as unrimed, slowly
5
falling snow crystals are advected further downstream (Saleeby et al., 2009). This “spillover” effect has also been shown in two-dimensional simulations of warm-phase orographic clouds, although in these cases the precipitation redistribution is attributed to a slowing of the rate of cloud droplet collection or autoconversion (Muhlbauer and Lohmann, 2008; Lynn et al., 2007). Previous modeling studies on this topic have shown
10
the impacts of varying the initial modelNcnon orographic cloud microphysics. With the simulations in our study we aim to determine the importance of the model aerosol size and hygroscopicity on these same cloud systems by applying the expanded droplet activation scheme to a case observed during the Inhibition of Snowfall by Pollution Aerosols (ISPA) II field campaign in February 2007. Aerosol size and droplet activation
15
data collected during this study provided representative values for the initialization of RAMS in these simulations. The parcel model results and sensitivity studies are used to make recommendations for estimating the potential impact of variations in aerosol composition on cloud droplet number concentration in observed cloud regimes.
2 Parcel model simulations
20
2.1 Model setup
To simulate the activation of cloud droplets we make use of a Lagrangian parcel model. The parcel model used for this study was introduced by Heymsfield and Sabin (1989) and has been described thoroughly by Saleeby and Cotton (2004). The parcel model follows a simulated air parcel as it is lifted with an initial updraft velocity and becomes
25
ACPD
10, 4189–4223, 2010The role of the particle size
distribution
D. S. Ward et al.
Title Page
Abstract Introduction
Conclusions References
Tables Figures
◭ ◮
◭ ◮
Back Close
Full Screen / Esc
Printer-friendly Version
Interactive Discussion
scribed distribution of dry aerosol. The distribution is assumed to be lognormal with shape parameterσg=1.8 and the total number concentration is divided into bins with assigned representative radii. While being lifted, activation of haze particles and the growth of droplets in each size bin along with expressions for the change in temper-ature, pressure, air density and liquid water content with time are solved iteratively.
5
After reaching its maximum supersaturation (Smax), the parcel is lifted a further 50 m to
provide ample time for activated droplets to grow.
The percentage of the initialNcnthat activates into cloud droplets in the parcel model depends on a number of input variables that describe the initial aerosol and environ-mental conditions. To limit the number of combinations of initial settings, Saleeby and
10
Cotton (2004) restricted the independent variables to four: temperatureT,w,Ncn, and the aerosol distribution number median radius rg, and assumed a constant aerosol composition of ammonium sulfate or sodium chloride with a constant insoluble fraction. We have extended this scheme to include aerosol hygroscopicity as a fifth independent variable.
15
The incorporation of aerosol hygroscopicity was made possible by modifications made to the original Heymsfield and Sabin (1989) parcel model by Eidhammer et al. (2009). Their model development work included the introduction of the hygroscop-icity parameter (κ) (Petters and Kreidenweis, 2007) into the saturation ratio formula for liquid droplets. The hygroscopicity factor is a proxy for chemical composition, and was
20
tabulated by Petters and Kreidenweis (2007) for many aerosol constituents; it can also be computed for internal mixtures of assumed components or determined empirically from experiments. The research reported here includes only one aerosol mode char-acterized by a single value ofκfor each simulation. As in previous studies (e.g., Ervens et al., 2007; McFiggans et al., 2006; Rissman et al., 2004), we note the inaccuracy of
25
ACPD
10, 4189–4223, 2010The role of the particle size
distribution
D. S. Ward et al.
Title Page
Abstract Introduction
Conclusions References
Tables Figures
◭ ◮
◭ ◮
Back Close
Full Screen / Esc
Printer-friendly Version
Interactive Discussion
conclude that using an internal mixture for modeling can lead to both over and under-predictions of CCN. While it could be expected that freshly-emitted aerosol would be externally mixed, McFiggans et al. (2006) notes that the mixing state of most ambient aerosol can be considered at least quasi-internal.
With the Eidhammer et al. (2009) changes in place, the parcel model was run for
5
all combinations of initial T, w, Ncn, and rg used in Saleeby and Cotton (2004) and for 23 values ofκ between 0.00001–1.28. These values were selected to span typical observed magnitudes of aerosol hygroscopicity in both urban and remote locations. Andreae and Rosenfeld (2008) reported typical continental values forκ of 0.2 to 0.4 with few observations below 0.1, and 1.28 is the reported value for NaCl (Petters and
10
Kreidenweis, 2007). The initial pressure, 600 mb, and initial relative humidity, 99%, were kept the same for all model runs. Smaxachieved in the parcels, and the resulting
Nd, were recorded.
In general, the sensitivity of droplet activation to changingκ has been shown to de-crease substantially with increasingκ(Petters and Kreidenweis, 2007). For this reason,
15
several of the high-κ parcel model results can be disregarded for construction of look-up tables while maintaining sufficient resolution of the potential impacts on activated fraction. Lookup tables for the following ten values of κ were included in the RAMS droplet activation scheme: 0.00001, 0.01, 0.1, 0.2, 0.25, 0.35, 0.45, 0.6, 0.9, 1.28. When intermediate values ofκ occur in the course of a simulation, Nd is determined
20
by linear interpolation between the activated fraction for the adjacent higher and lower κlookup tables.
2.2 Parcel model results
As κ is increased in the parcel model, the simulated particles become more hygro-scopic and equivalent particle sizes will activate at lower supersaturations. Thus,
25
increases in κ allow for particles with incrementally smaller sizes to reach the criti-cal threshold and a larger portion of the aerosol distribution to activate. Reutter et al. (2009) found that the relationship between an increase inκ and an increase inNd
ACPD
10, 4189–4223, 2010The role of the particle size
distribution
D. S. Ward et al.
Title Page
Abstract Introduction
Conclusions References
Tables Figures
◭ ◮
◭ ◮
Back Close
Full Screen / Esc
Printer-friendly Version
Interactive Discussion
was not constant, but varied with changes in the ratio of the initial updraft speed to the initial particle number (w/Ncn). In our study, w/Ncn will also be used to compare the parcel model output to these previous results. The w/Ncn quantity is especially useful for classifying different parcel model environments, as it is an able predictor of the model Smax. In our simulations, between values of w/Ncn=10−6ms−1/(cm−3)
5
andw/Ncn=10−1ms−1/(cm−3), theS
max(averaged over all initialrg andT) was highly correlated withw/Ncn in a positive sense (linear correlation coefficientr=0.93).
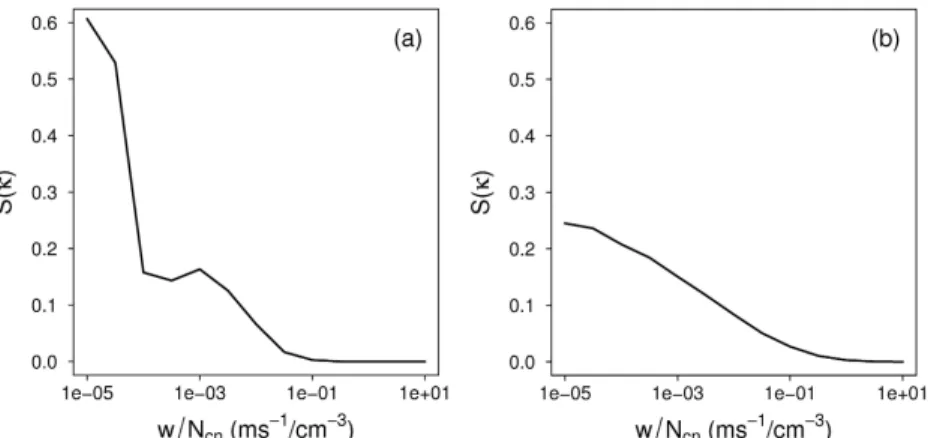
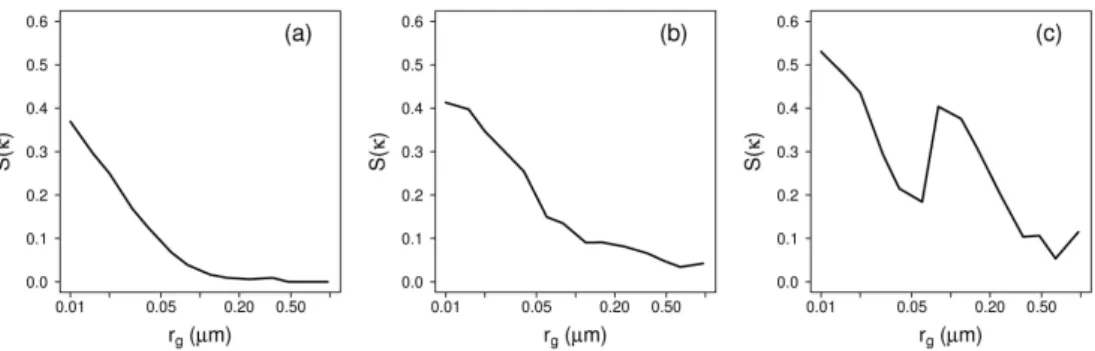
Figure 1a shows how changes in aerosol composition affect CCN activity as w/Ncn increases in the parcel model, for an initialrg=0.06 µm. We compute the dependent variable, S(κ), using the method shown by Feingold (2003) and summarized as
fol-10
lows. Parcel model predictions ofNd are plotted againstκ on a log-log plot. A linear relationship is fitted to the plot using regression and the resulting slope of the line is understood to beS(κ) for the specified range inκand given initial conditions. Reutter et al. (2009) use this approach but plot values ofNd for each initial κ that have been averaged over the all the initial conditions and name the modified parameter ¯S(κ). In
15
our simulations, several combinations of initialw and Ncn result in the same value of w/Ncn, meaning multiple values ofS(κ) occur at the samew/Ncn. Additionally, several values of S(κ) are computed at the same w/Ncn but for different initial T. These are averaged to give the single value ofS(κ) at eachw/Ncn shown in Fig. 1a. The range inκ for this portion of the analysis, 0.2 to 0.5, was chosen to incorporate the typical
20
hygroscopicity values for continental aerosol. It extends the range suggested by An-dreae and Rosenfeld (2008) for continental airmass modeling (0.2 to 0.4) to include the majority of observations compiled by Hudson (2007) in continental regions, reported asκ=0.33+/−0.15 by Andreae and Rosenfeld (2008).
The updraft and aerosol-limited regimes are clearly discerned in Fig. 1a and
com-25
ACPD
10, 4189–4223, 2010The role of the particle size
distribution
D. S. Ward et al.
Title Page
Abstract Introduction
Conclusions References
Tables Figures
◭ ◮
◭ ◮
Back Close
Full Screen / Esc
Printer-friendly Version
Interactive Discussion
change in κ from 0.2 to 0.5 leads to the highest values of S(κ) for w/Ncn less than 10−4ms−1/(cm−3), defined as the updraft-limited regime. When the model is initialized as aerosol-limited (w/Ncn>10−3ms−1/(cm−3)), S(κ) is small and diminishes to near zero with increasingw/Ncn. In this regime, as noted by Reutter et al. (2009), the par-cel reaches aSmaxgreat enough to activate nearly 100% of the particles in the given
5
distribution at all values ofκ and for all initial values ofw. Thus, compositional effects are rendered insignificant in these highly supersaturated model environments.
To extend this analysis to a range of size distributions we compare the results of simulations with different initialrg. Fourteen values ofrgbetween 0.01 µm and 0.96 µm were used to initialize the parcel model. Figure 1b shows the same quantities as in
10
Fig. 1a, but averaged over the range of initialrg. The resulting curve exhibits the same three-regime structure as in Fig. 1a, but the divisions between the regimes are no longer distinct. The sharp decrease inS(κ) between the updraft-limited and transition regimes has been reduced, and some sensitivity to the change inκ extends well into the aerosol-limited regime.
15
A better demonstration of the effect of changing the size distribution is given in Fig. 2, which displays the change in S(κ) with increasing rg while holding w/Ncn constant. Previous studies have evaluatedS(κ) and sensitivity to other measures of composition as a singular value representative of the entire initial parameter space (e.g., Rissman et al., 2004; Reutter et al., 2009). This figure shows thatS(κ) varies significantly within
20
that parameter space, in this case with respect to rg. In the aerosol-limited regime (Fig. 2a), S(κ) is small for rg=0.06 µm but increases to S(κ)=0.35 below that size. For these small aerosol, composition affects CCN activity even in the aerosol-limited regime. A similar trend is apparent for the transition regime shown in Fig. 2b, although the highS(κ) values are shifted to higher median radii. Finally, for the updraft-limited
25
regime illustrated in Fig. 2c, the highest sensitivity extends to even larger median radii, tapering off above rg=0.15 µm. In all Fig. 2 plots, the sensitivity to changes in κ varies significantly within thew/Ncnregimes. Altogether, the results in this figure show that w/Ncn, or supersaturation-based regimes, cannot fully predict the compositional
ACPD
10, 4189–4223, 2010The role of the particle size
distribution
D. S. Ward et al.
Title Page
Abstract Introduction
Conclusions References
Tables Figures
◭ ◮
◭ ◮
Back Close
Full Screen / Esc
Printer-friendly Version
Interactive Discussion
dependence of CCN activity independently of therg.
2.3 Relationship betweenr
g andS(κ)
The analysis of thew/Ncn regimes and the sensitivity parameter imply a role of the size distribution in predicting the dependence of CCN activity on aerosol composition. In their review of droplet activation theory, McFiggans et al. (2006) state that CCN
5
activity is determined by the number of particles and the gradient of the size distribution, at the critical radius (rc) or range in rc under investigation. They note that this idea can be attributed to Twomey (1959) whose power-law representation of CCN clearly demonstrates the influence of size distribution parameters over activated fraction. This influence can be shown for lognormal representations of aerosol size distributions as
10
well.
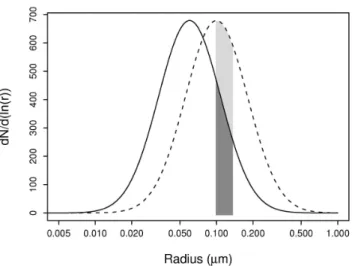
Figure 3 illustrates the impact of the initial size parameterrg onS(κ). The two input aerosol distributions are assumed to have κ=0.2, and the effect of changing this to κ=0.5 is evaluated. The shifts in critical dry size for this κ change, corresponding to a selected Sc (chosen as Sc=0.165%), are indicated. For the distribution with
15
rg=0.10 µm,S(κ)=0.14 (here,S(κ) is computed simply by differencing the logarithm ofNd at eachκ and dividing by the logarithm of the fixed fractional change inκ, see Eq. 1), but the value of this parameter increases to 0.59 forrg=0.06 µm due to the shift of the distribution median relative to therc of the given supersaturated environment. Of course, in the parcel model, critical supersaturation would not be identical whenκ
20
is modified, even for the same updraft velocity, tending to somewhat dampen out these differences (Rissman et al., 2006).
As suggested in Fig. 3, the variability of the compositional-dependence of Nd is explained, in large part, by the location of therc on the size distribution function of an aerosol population. For the lognormal size distribution function, the relative location
25
ACPD
10, 4189–4223, 2010The role of the particle size
distribution
D. S. Ward et al.
Title Page
Abstract Introduction
Conclusions References
Tables Figures
◭ ◮
◭ ◮
Back Close
Full Screen / Esc
Printer-friendly Version
Interactive Discussion
cumulative size distribution function at radiusr=rc:
N(rc)=1 2+
1 2erf
(
ln(rc/rg)
√
2lnσg )
(2)
where erf is the error function andN(rc) is the fraction of particles smaller thanrc for the given size distribution parametersrg andσg. Moderate variations in the prescribed value ofσg, which in these simulations is kept constant, have been shown to play only
5
a minor role in CCN activity by Antilla and Kerminen (2007).
To determine N(rc) a cumulative distribution function was created for each initial value of rg used in the parcel model and σg=1.8. Then, rc was computed using Eq. (10) from Petters and Kreidenweis (2007) for every combination of initialNcn, w, T, andrg, but for the fixed range inκ, 0.2 to 0.5.TheSmaxreached in each simulation
10
was used as theSc required for calculatingrc. The final rc was taken as the average between therc for initial κ=0.5 and the rc for initialκ=0.2, for each combination of the other initial conditions. The span of particle size betweenrc computed forκ=0.5 andκ=0.2 (in Fig. 3, the width of the shaded region along the x-axis) is not constant but varies with the environmental supersaturation and withκ itself. As shown by
Pet-15
ters and Kreidenweis (2007), the change in rc for a fixed range in κ increases with decreasing supersaturation.
The rc, computed as explained above for every combination of Ncn, w, T, and rg, was used to solve the cumulative size distribution function with the correspondingrg. The resultingN(rc) values are positively correlated withS(κ), which is consistent with
20
an increase inrcrelative torgleading to an increase in the sensitivity of CCN activity to changes inκ. The computed Pearson linear correlation coefficient,r=0.82, suggests that the predictive ability ofN(rc) is strong for the entire range of varied initial conditions, including median radius. Therefore, for a fixedrg,S(κ) can be predicted fromrc or, for a knownκ range, from Sc as shown by Reutter et al. (2009). However, the inverse is
25
also true. For a fixedScand a knownκ range, the sensitivity to changes inκ depends on the initialrg. This result is, perhaps, intuitive, but it is also instructive. It suggests
ACPD
10, 4189–4223, 2010The role of the particle size
distribution
D. S. Ward et al.
Title Page
Abstract Introduction
Conclusions References
Tables Figures
◭ ◮
◭ ◮
Back Close
Full Screen / Esc
Printer-friendly Version
Interactive Discussion
that for cloud regimes with characteristic supersaturations the importance of aerosol composition for droplet activation can be anticipated if basic aerosol size and source data are known. Of course, it is important to remember that these conclusions are derived from simulations that assumed a perfect internal mixture of aerosol and known uni-modal size distribution function, conditions that do not apply universally.
5
3 Sensitivity experiment
As an initial application of theκ-based lookup tables, and to test the role of the parti-cle size distribution and aerosol hygroscopicity, sensitivity simulations were carried out centered around a mixed-phase orographic cloud case study for which aerosol size and droplet activation data were known. The sensitivity study was run with RAMS,
10
which is well suited for simulating mixed-phase cloud systems owing to a sophisti-cated bin-emulating, bulk microphysics package (Saleeby and Cotton, 2008). Recently this was enhanced by the inclusion of a binned method for representing the riming process that was shown to improve the prediction of riming efficiencies (Saleeby and Cotton, 2008). RAMS predicts the cloud droplet distribution mixing ratio and number
15
concentration (Saleeby and Cotton, 2004) and also predicts two moments of the distri-butions for rain, hail, pristine ice, snow, aggregates and graupel (Cotton et al., 2003). The formation of ice crystals by homogeneous and heterogeneous freezing, as well as secondary ice production are treated as described by Saleeby et al. (2009) with a vertically-decreasing profile of ice nuclei (IN) number concentration.
20
3.1 Experimental design
An orographic snowstorm that occurred over the Park Range in northwestern Colorado during 11–12 February 2007 was chosen as the case for this sensitivity study. Oro-graphic clouds in this region form with westerly or northwesterly flow which induces the greatest uplift over the north-south running topography. In the absence of a frontal
ACPD
10, 4189–4223, 2010The role of the particle size
distribution
D. S. Ward et al.
Title Page
Abstract Introduction
Conclusions References
Tables Figures
◭ ◮
◭ ◮
Back Close
Full Screen / Esc
Printer-friendly Version
Interactive Discussion
system, this flow is often forced by the presence of a mid-level ridge to the west and a developing lee trough to the east, together setting up a strong cross-barrier pressure gradient over the Park Range (Rauber et al., 1986). The 11–12 February 2007 storm formed under these conditions. It was characterized by a sustained period of high liquid water content (LWC), especially after 00:00 GMT on 12 February, and persistent
precip-5
itation of heavily rimed snow crystals (Saleeby et al., 2009). It has been hypothesized by Borys et al. (2000) that higher LWC mixed-phase orographic clouds are more sen-sitive to changes in CCN number concentration. Also, Saleeby et al. (2009) found that mixed-phase orographic storms that contain large supercooled droplet sizes, therefore riming efficiently, are more susceptible to the impacts of increasing CCN number
con-10
centration. For these reasons, the 11–12 February 2007 storm provides an excellent test case for examining the effects of a variable aerosol population.
To represent realistic variations in aerosol in these simulations, observations from the ISPA field campaign were used as the basis for the model initializations. Aerosol number concentration and size distribution data were collected from 6 January 2007 to
15
28 February 2007 using a scanning mobility particle sizer (SMPS) and an aerodynamic particle size spectrometer (APS) located at the Desert Research Institute (DRI) Storm Peak Laboratory (SPL). SPL is located at an elevation of 3210 m above mean sea level atop the southern extent of the Park Range and is often above cloud base dur-ing winter orographic storms (Borys and Wetzel, 1997). The SMPS measured particle
20
diameters between 0.0087 and 0.34 µm and the APS measured larger particles with diameters between 0.49 and 20.5 µm. TotalNcn was estimated as the sum of particles observed by the SMPS and APS. In addition to the aerosol size distribution, CCN num-ber concentration was measured at supersaturations of 0.1%, 0.2%, 0.3%, 0.4% and 0.6%, as reported by Saleeby et al. (2009), using the Droplet Measurement
Technolo-25
gies (DMT) CCN-100 (Roberts and Nenes, 2005). Observations from the SMPS and APS consistently showed particle counts betweenNcn=500 andNcn=3000 cm−3(for aerosol larger than the SMPS detection limit ofr=0.00435 µm) most often distributed uni-modally with distribution peaks smaller thanr=0.05 µm. The dominant Aitken-size
ACPD
10, 4189–4223, 2010The role of the particle size
distribution
D. S. Ward et al.
Title Page
Abstract Introduction
Conclusions References
Tables Figures
◭ ◮
◭ ◮
Back Close
Full Screen / Esc
Printer-friendly Version
Interactive Discussion
mode (with respect to number) is most characteristic of a rural continental airmass as defined by Seinfeld and Pandis (2006).
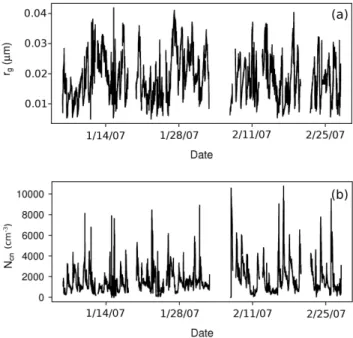
For the purpose of obtaining realistic initial values forrg to initialize the aerosol field in RAMS, a single lognormal mode was fit to the aerosol size distribution samples from ISPA using the method of maximum likelihood. A time series of the resultingrgis shown
5
in Fig. 4a plotted with Ncn (Fig. 4b) at five-minute intervals. For the entire ISPA field study, the estimated averagerg=0.018 µm and varied little with 10th and 90th quantile values ofrg=0.010 µm andrg=0.028 µm. Total aerosol number, as measured by the SMPS and APS, showed more variation with a range ofNcn=461 to 10 762 cm−
3
. The Ncndataset for the entire study period had a mean ofNcn=1681 cm−3but a median of
10
Ncn=1290 cm−3. Some of the samples exhibit an apparent second mode with a peak nearr=0.05 µm containing a relatively small proportion of the aerosol number, also characteristic of the rural continental airmass. In these instances the fitted distribution will underestimate the number of larger particles that, due to their size, are more likely to activate droplets. However, because this second mode contains so few particles, it
15
does not appear in the sampled size distribution when this is averaged over the entire study period. For the purpose of producing an estimatedrg for model initialization, the single moderg will be used.
With the combination of size-differentiated aerosol and droplet activation data, it is possible to estimate theκ value of each ambient aerosol sample if an internal mixture
20
is assumed. At a fixed supersaturation, knowledge of the critical radius, that separates the particles that activate from those that remain unactivated, implies a single value ofκ for internally mixed aerosol. With the CCN number concentration known, the crit-ical radius (and subsequently κ) can be estimated from the aerosol size distribution samples. This method is similar to that used in CCN closure experiments in which,
25
ACPD
10, 4189–4223, 2010The role of the particle size
distribution
D. S. Ward et al.
Title Page
Abstract Introduction
Conclusions References
Tables Figures
◭ ◮
◭ ◮
Back Close
Full Screen / Esc
Printer-friendly Version
Interactive Discussion
aerosol hygroscopicity. The CCN data sampled during ISPA at 0.3% supersaturation were used in this analysis. The DMT-CCN counter uses a temperature differential to create the necessary supersaturated environment. Measurements taken when the temperature differential was not stabilized were neglected. The remaining data were averaged over 5-min periods and compared to a single corresponding SMPS and APS
5
observation. The results of this analysis show very little variation inκ estimated from the SPL measurements. For the entire field campaign, the average estimatedκ was 0.14 with 10th and 90th quantile values ofκ=0.08 andκ=0.18. Past research in the Park Range area has found that sulfate aerosol plays a major role in local orographic cloud microphysics (e.g. Borys et al., 2000; Borys et al., 2003), but the ISPA
measure-10
ments show a low hygroscopicity aerosol population, perhaps indicative of a dominant organic component.
3.2 RAMS setup
RAMS was set up, as in Saleeby et al. (2009), on four horizontal grids with two-way nesting. The grid arrangement and other important model parameters are given in
Ta-15
ble 1. RAMS uses a sigma-z terrain-following vertical coordinate system set up, in this case, with 40 vertical levels. To increase the vertical resolution in the boundary layer, the lowest model level has a vertical grid spacing of 75 m. This is stretched by a ratio of 1.12 for subsequent levels until reaching a maximum spacing of 750m. The North American Regional Reanalysis dataset was used to initialize the meteorological fields
20
as well as nudge the lateral and model top boundary meteorology at 5-minute intervals. Model aerosol number concentration was initialized in a horizontally-homogeneous, vertically-decreasing profile with a surface concentration of Ncn=1500 cm−3. This value is slightly higher than the median concentration observed at SPL during ISPA. It was prescribed assuming that, since therg observed during ISPA was near the lower
25
detection limit of the SMPS instrument, the Aitken mode contained a portion of parti-cles that were not large enough to be observed. Above the model level 150m above ground, the initial aerosol number concentration decreases linearly to the model level
ACPD
10, 4189–4223, 2010The role of the particle size
distribution
D. S. Ward et al.
Title Page
Abstract Introduction
Conclusions References
Tables Figures
◭ ◮
◭ ◮
Back Close
Full Screen / Esc
Printer-friendly Version
Interactive Discussion
4000m above ground. Above 4000m a low, free-tropospheric number concentration Ncn=100 cm−3is assumed.
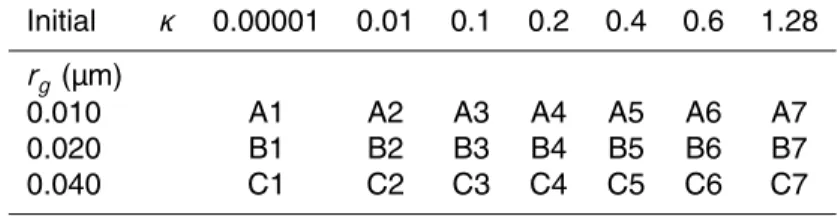
Twenty-one simulations were run with varied initialrg andκ. The initial values ofrg and κ remained constant throughout the entire respective simulation. The values of these parameters are shown in Table 2 for all simulations. Note that here we employ
5
the entire range in κ that is available in the droplet activation look-up tables and no longer restrict the analysis to typical continental values. All simulations were run for a duration of 42 h beginning at 00:00 GMT 11 February 2007 and ending at 18:00 GMT 12 February 2007. This time period captured the length of the storm system which began at around 06:00 GMT on 11 February and began to dissipate by 18:00 GMT on
10
12 February.
3.3 Sensitivity simulations results
It is expected that the riming efficiency, and resulting precipitation distribution, would be modulated by variations in the CCN number concentration flowing into the oro-graphic cloud (Saleeby et al., 2009). How then do adjustments in aerosol
hygroscopic-15
ity change the activated CCN number concentration for the particular orographic cloud conditions? A first check is shown with vertical profiles of initial model CCN number concentration at a superaturation of 0.6% in Fig. 5. CCN number concentration is pre-dicted at prescribed values of supersaturation by the inclusion of the separate updraft look-up table in the RAMS droplet activation scheme. The look-up table is comprised
20
of the updraft speeds required to reach the prescribed supersaturation in the parcel model given the simulatedT,Ncn andrg. In this case,T is set to a constant 25◦C for diagnosis of model CCN to approximate the temperature in the SPL CCN instrument. The vertical profiles in this case were diagnosed at a model grid point upwind of SPL for the B-simulations in whichrg=0.020 µm, about the observed average value for the
25
ACPD
10, 4189–4223, 2010The role of the particle size
distribution
D. S. Ward et al.
Title Page
Abstract Introduction
Conclusions References
Tables Figures
◭ ◮
◭ ◮
Back Close
Full Screen / Esc
Printer-friendly Version
Interactive Discussion
droplets in RAMS at this supersaturation, even near the surface boundary.
The simulated orographic flow strengthened as the model progressed into 12 Febru-ary and reached peak intensity by 12:00 GMT on that day with updraft speeds generally greater than 1 m/s along the windward side of the Park Range and exceeding 2 m/s in many locations. These conditions, along with the prescribedNcn=1500 cm−3put this
5
case into the aerosol-limited regime as defined by Reutter et al. (2009), although areas with weaker updrafts would be classified into the transitional regime. Apart from pre-dictions of sensitivity toκin these regimes, the aerosol-limited regime is characterized by high supersaturation. As a result, in some locations more droplets are activated in the model orographic cloud than were predicted for a supersaturation of 0.6% in
10
Fig. 5. As air parcels enter the high updrafts forced by the topography, even the non-hygroscopic aerosol case (κ=0.00001) produced CDNC values in excess of 700 cm−3 (Fig. 6a). The vertical cross-sections in Fig. 6 are shown at a latitude of 40.455◦ and at 12:00 GMT on 12 February, during the peak intensity of the storm. The differences between the CDNC in simulations B1 and B7 are significant. The high-κsimulation, B7
15
(Fig. 6c), generates between one and two hundred more droplets per unit volume at its maximum and a larger area with CDNC values greater than 700 cm−3than that shown in Fig. 6a for the low-κcase. Also important to note are the smaller mean droplet diam-eters produced in simulations B4 (Fig. 6b) and B7 when compared to B1. Only mean droplet diameters larger than 10 µm are plotted in Fig. 6 to highlight the areas where
20
riming will take place, according to experimentally determined collection efficiencies (Pruppacher and Klett, 1997). Droplets located outside the 10 µm threshold contour will not be collected by ice crystals to an appreciable degree.
The differences in mean droplet diameter for the range inκ are greater for the simu-lations in group A shown in Fig. 6d–f. Large regions of mean droplet diameters near or
25
below 10 µm are predicted in simulation A7 (Fig. 6f) whereas Fig. 6d shows, in general, mean droplet diameters in excess of 10 µm and areas of much larger droplets for A1. For A4, shown in Fig. 6e, the CDNC and mean droplet diameter fields are more similar to those of high-κ conditions than low-κ conditions. This is evidence that the greatest
ACPD
10, 4189–4223, 2010The role of the particle size
distribution
D. S. Ward et al.
Title Page
Abstract Introduction
Conclusions References
Tables Figures
◭ ◮
◭ ◮
Back Close
Full Screen / Esc
Printer-friendly Version
Interactive Discussion
sensitivity toκ in these simulations occurs belowκ=0.2.
Increasing the value of κ from near zero to 1.28 led to changes in the distribution of precipitation across the topographical barrier for all simulation groups. As shown in previous work, an increase in the CDNC leads to a decrease in windward precipitation and an increase in leeward precipitation, known as the spillover effect (Muhlbauer and
5
Lohmann, 2008; Saleeby et al., 2009). To illustrate this effect, the difference between total precipitation in simulations A1 and A7 is shown in Fig. 7 along with the same plot for B1 and B7, and C1 and C7. The location of the continental divide is plotted to show the approximate location of the ridge of the topography. Wind barbs are plotted along the ridge that represent the mean wind speed (kts) and direction for the lowest 1 km
10
of the model environment and averaged over the entire storm period. These indicate the strong cross-barrier flow from west to east that is necessary for sustaining the oro-graphic cloud. In Fig. 7a, a strong spillover effect is apparent. Precipitation is increased on the windward (western) side of the ridge for the low extreme inκwhen compared to the high extreme and decreased on the leeward (eastern) side. The magnitude of the
15
difference, between 4 to 5 mm along the Park Range, accounts for about 10% of the total storm precipitation in this region, similar to that shown by Saleeby et al. (2009) for a change in initialNcn from 300 cm−3 to 1100 cm−3. Of course, this is only theoretical since a range inκ such as that used to initialize A1 and A7 is not likely to be observed at SPL. When the precipitation fields are compared for the simulations based on the
20
10th and 90th quantiles inκestimated from the ISPA project (considered to be A3, B3, C3, and A4, B4, C4), the differences are trivial.
When rg is increased in the model, as in the B and C simulations, the scale of the precipitation differences is diminished. For rg increased to rg=0.02 µm (Fig. 7b), the differences between the high-κ and low-κ simulations are only about half of those
25
ACPD
10, 4189–4223, 2010The role of the particle size
distribution
D. S. Ward et al.
Title Page
Abstract Introduction
Conclusions References
Tables Figures
◭ ◮
◭ ◮
Back Close
Full Screen / Esc
Printer-friendly Version
Interactive Discussion
sizes,rgwill necessarily increase with respect torc. In the model, this leads to weaker CCN sensitivity to changes inκand therefore, less impact on the simulated orographic cloud.
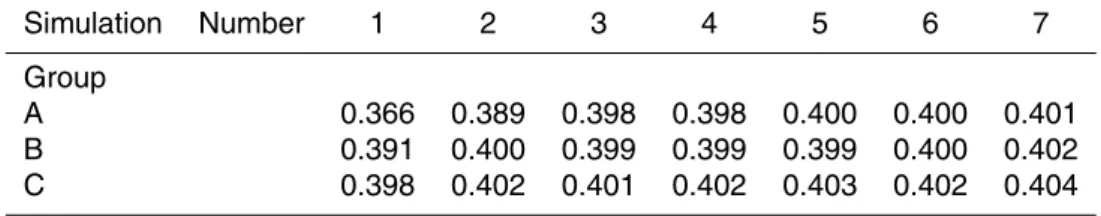
The ratio of leeward precipitation to total orographic precipitation was proposed by Jiang and Smith (2003) as a measure of the spillover effect. This spillover ratio was
5
also used by Muhlbauer and Lohmann (2008) and is applied here as a single number indicator of the impact of the varied aerosol parameters. The leeward precipitation in this case was computed as the sum of all precipitation that fell during the storm period to the east of the continental divide, west of 106.3◦W, and between 40.4◦N and 40.8◦N, per unit area. Total orographic precipitation was defined as precipitation, per
10
unit area, that fell between those same latitudes and between 106.3◦W and 107.0◦W. The spillover ratios for all simulations are shown in Table 3. As expected from the analysis in Fig. 7, the spillover ratio changed the most for the A group of simulations. In all simulation groups, the spillover ratio was apparently most sensitive to variations in the lowest values ofκ.
15
4 Conclusions
Approaches for simplifying CCN predictions for application in mesoscale and larger-scale models are needed. Ideally, simplifications could be made that permit clas-sification of aerosol populations into composition-dependent and non-composition-dependent as a function of observable environmental parameters. Previous studies
20
have shown an apparent tendency for composition-dependence in low-supersaturation conditions (Ervens et al., 2007; Gunthe et al., 2009). Reutter et al. (2009) defined regimes that are consistent with this hypothesis. By simulating the ascent of an aerosol-laden air parcels we have also found that these environments will exhibit more sensitivity to changes in aerosol hygroscopicity because lower supersaturation
typi-25
cally leads to a higher rc. However, this is not the complete picture. The parcel model results show that, because of the nature of the lognormal distribution assumed
ACPD
10, 4189–4223, 2010The role of the particle size
distribution
D. S. Ward et al.
Title Page
Abstract Introduction
Conclusions References
Tables Figures
◭ ◮
◭ ◮
Back Close
Full Screen / Esc
Printer-friendly Version
Interactive Discussion
in the model, low supersaturation environments could potentially exhibit only small composition-dependence for size distributions with the larger initial mode diameters. And at high supersaturations the composition-dependence could be important if the size distribution median radius is more characteristic of a small Aitken mode. In reach-ing this conclusion, internally mixed aerosols with constant hygroscopicity over variable
5
particle size were assumed. As a consequence, none of the complexities associated with external mixtures were examined in this study.
Uni-modal, Aitken mode-size aerosol size distributions were consistently sampled at SPL during the ISPA campaign. Therefore, despite the high supersaturations predicted by RAMS, a simulated orographic snowstorm case from the study period showed some
10
sensitivity, evident as increased spillover precipitation, to extreme changes in the model aerosol hygroscopicity as represented by theκ parameter. The differences in precip-itation amount and distribution were similar to those seen in simulations of the same case by Saleeby et al. (2009) in whichNcnwas varied. However, the lack of variability ofκ and rg, as estimated from SPL observations, suggest only a small role for these
15
quantities in this environment. This leads to the supposition that for these high super-saturation clouds and for rural continental aerosol populations, consideration of aerosol composition might safely be neglected for purposes of modeling the cloud physics.
Similar sensitivity approximations could be applied to other cloud regimes for the purpose of increasing the efficiency of model representations. In areas where sufficient
20
observations are not available, it is instead useful to know what information needs to be gathered to make an educated assumption about the sensitivity of such clouds to changes in aerosol hygroscopicity. In light of the parcel model results described in this paper, any such arrangement should include consideration of the size distribution, as characterized by the median radius.
ACPD
10, 4189–4223, 2010The role of the particle size
distribution
D. S. Ward et al.
Title Page
Abstract Introduction
Conclusions References
Tables Figures
◭ ◮
◭ ◮
Back Close
Full Screen / Esc
Printer-friendly Version
Interactive Discussion Acknowledgements. This research was supported by the National Science Foundation grant
ATM-0835421. The authors would like to thank Gannet Haller and Ian McCubbin of the Desert Research Institute, as well as the Steamboat Ski and Resort Corporation for support during the ISPA field campaign.
References
5
Andreae, M. O., and Rosenfeld, D.: Aerosol–cloud–precipitation interactions. Part 1. The nature and sources of cloud-active aerosols, Earth-Sci. Rev., 89, 13–41, doi:10.1016/j.earscirev.2008.03.001, 2008.
Antilla, T., and Kerminen, V.-M.: On the contribution of Aitken mode particles to cloud droplet populations at continental background areas – a parametric sensitivity study, Atmos. Chem.
10
Phys., 7, 4625–4637, 2007, http://www.atmos-chem-phys.net/7/4625/2007/.
Borys, R. D., Lowenthal, D. H., Cohn, S. A., and Brown, W. O. J.: Mountaintop and radar measurements of anthropogenic aerosol effects on snow growth and snowfall rate, Geophys. Res. Lett., 30(10), 1538, doi:10.1029/2002GL016855, 2003.
Borys, R. D., Lowenthal, D. H., and Mitchell, D. L.: The relationship among cloud microphysics,
15
chemistry, and precipitation rate in cold mountain clouds, Atmos. Environ., 34, 2593–2602, 2000.
Borys, R. D. and Wetzel, M.: Storm Peak Laboratory: A research, teaching, and service facility for the atmospheric sciences, B. Am. Meteorol. Soc., 78(10), 2115–2123, 1997.
Bougiatioti, A., Fountoukis, C., Kalivitis, N., Pandis, S. N., Nenes, A., and Mihalopoulos,
20
N.: Cloud condensation nuclei measurements in the marine boundary layer of the eastern Mediterranean: CCN closure and droplet growth kinetics, Atmos. Chem. Phys., 9, 7053– 7066, 2009, http://www.atmos-chem-phys.net/9/7053/2009/.
Cantrell, W., Shaw, G., Cass, G. R., Chowdhury, Z., Hughes, L. S., Prather, K. A., Guazzotti, S. A., and Coffee, K. R.: Closure between aerosol particles and cloud condensation nuclei at
25
Kaashidhoo Climate Observatory, J. Geophys. Res.-Atmos., 106, 28711–28718, 2001. Cheng, W. Y. Y., Carrio, G., Cotton, W. R., and Saleeby, S. M.: Influence of cloud
condensation and giant cloud condensation nuclei on the development of precipitating trade wind cumuli in a large eddy simulation, J. Geophys. Res.-Atmos., 114, D08201, doi:10.1029/2008JD011011, 2009.
30
ACPD
10, 4189–4223, 2010The role of the particle size
distribution
D. S. Ward et al.
Title Page
Abstract Introduction
Conclusions References
Tables Figures
◭ ◮
◭ ◮
Back Close
Full Screen / Esc
Printer-friendly Version
Interactive Discussion
Cotton, W. R., Pielke Sr., R. A., Walko, R. L., Liston, G. E., Tremback, C. J., Jiang, H., McAnelly, R. L., Harrington, J. Y., Nicholls, M. E., Carrio, G. G., and McFadden, J. P.: RAMS 2001: Current status and future directions, Meteorol. Atmos. Phys., 82, 5–29, 2003.
Cubison, M. J., Ervens, B., Feingold, G., Docherty, K. S., Ulbrich, I. M., Shields, L., Prather, K., Hering, S., and Jimenez, J. L.: The influence of chemical composition and mixing state of
5
Los Angeles urban aerosol on CCN number and cloud properties, Atmos. Chem. Phys., 8, 5649–5667, 2008, http://www.atmos-chem-phys.net/8/5649/2008/.
Dusek, U., Frank, G. P., Hildebrandt, L., Curtius, J., Schneider, J., Walter, S., Chand, D., Drewnick, F., Hings, S., Jung, D., Borrmann, S., and Andreae, M. O.: Size matters more than chemistry for cloud-nucleating ability of aerosol particles, Science, 312, 1375–1378,
10
2006.
Eidhammer, T., DeMott, P. J., and Kreidenweis, S. M.: A comparison of heterogeneous ice nucleation parameterizations using a parcel model framework, J. Geophys. Res.-Atmos., 114, D06202, doi:10.1029/2008JD011095, 2009.
Ervens, B., Cubison, M., Andrews, E., Feingold, G., Ogren, J. A., Jimenez, J. L., DeCarlo,
15
P., and Nenes, A.: Prediction of cloud condensation nucleus number concentration using measurements of aerosol size distributions and composition and light scattering enhance-ment due to humidity, J. Geophys. Res.-Atmos., 112, D10S32, doi:10.1029/2006JD007426, 2007.
Feingold, G.: Modeling of the first indirect effect: Analysis of measurement requirements,
Geo-20
phys. Res. Lett., 30(19), 1997, doi:10.1029/2003GL017967, 2003.
Gunthe, S. S., King, S. M., Rose, D., Chen, Q., Roldin, P., Farmer, D. K., Jimenez, J. L., Artaxo, P., Andreae, M. O., Martin, S. T., and P ¨oschl, U.: Cloud condensation nuclei in pristine tropical rainforest air of Amazonia: size-resolved measurements and modeling of atmospheric aerosol composition and CCN activity, Atmos. Chem. Phys., 9, 7551–7575,
25
2009, http://www.atmos-chem-phys.net/9/7551/2009/.
Harrington, J. Y.: The effects of radiative and microphysical processes on simulated warm and transition season Arctic stratus, Ph.D. thesis, Colorado State University, Colorado, United States, 289 pp., 1997.
Heymsfield, A. J. and Sabin, R. M.: Cirrus crystal nucleation by homogeneous freezing of
30
solution droplets, J. Atmos. Sci., 46, 2252–2264, 1989.
ACPD
10, 4189–4223, 2010The role of the particle size
distribution
D. S. Ward et al.
Title Page
Abstract Introduction
Conclusions References
Tables Figures
◭ ◮
◭ ◮
Back Close
Full Screen / Esc
Printer-friendly Version
Interactive Discussion
Jiang, Q. and Smith, R. B.: Cloud timescales and orographic precipitation, J. Atmos. Sci., 60, 1543–1560, 2003.
Kain, J. S. and Fritsch, J. M.: Convective parameterization for mesoscale models: The Kain-Fritsch scheme, Meteor. Mon., 46, 165–170, 1993.
Lynn, B., Khain, A., Rosenfeld, D., and Woodley, W.: Effects of aerosols on precipitation from
5
orographic clouds, J. Geophys. Res.-Atmos., 112, D10225, doi:10.1029/2006JD007537, 2007.
McFiggans, G., Artaxo, P., Baltensperger, U., Coe, H., Facchini, M. C., Feingold, G., Fuzzi, S., Gysel, M., Laaksonen, A., Lohmann, U., Mentel, T. F., Murphy, D. M., O’Dowd, C. D., Snider, J. R., and Weingartner, E.: The effect of physical and chemical aerosol properties on warm
10
cloud droplet activation, Atmos. Chem. Phys., 6, 2593–2649, 2006, http://www.atmos-chem-phys.net/6/2593/2006/.
Medina, J., Nenes, A., Sotiropoutlou, R.-E. P., Cottrell, L. D., Ziemba, L. D., Beckman, P. J., and Griffin, R. J.: Cloud condensation nuclei closure during the international Consortium for Atmospheric Research on Transport and Transformation 2004 campaign: Effects of
size-15
resolved composition, J. Geophys. Res.-Atmos., 112, D10S31, doi:10.1029/2006JD007588, 2007.
Mellor, G. L. and Yamada, T.: Development of a turbulence closure model for geophysical fluid problems, Rev. Geophys. Space Phys., 20, 851–875, 1982.
Meyers, M. P., Walko, R. L., Harrington, J. Y., and Cotton, W. R.: New RAMS cloud microphysics
20
parameterization. Part II. The two-moment scheme, Atmos. Res., 45, 3–39, 1997.
Muhlbauer, A. and Lohmann, U.: Sensitivity studies of the role of aerosols in warm-phase orographic precipitation in different dynamical flow regimes, J. Atmos. Sci., 65, 2522–2542, doi:10.1175/2007JAS2492.1, 2008.
Petters, M. D. and Kreidenweis, S. M.: A single parameter representation of hygroscopic growth
25
and cloud condensation nucleus activity, Atmos. Chem. Phys., 7, 1961–1971, 2007, http://www.atmos-chem-phys.net/7/1961/2007/.
Pruppacher, H. R. and Klett, J. D.: Microphysics of Clouds and Precipitation, Dordrecht, Kluwer Academic Publishers, 954 pp., 1997.
Quinn, P. K., Bates, T. S., Coffman, D. J., and Covert, D. S.: Influence of particle size and
30
chemistry on the cloud nucleating properties of aerosols, Atmos. Chem. Phys., 8, 1029– 1042, 2008, http://www.atmos-chem-phys.net/8/1029/2008/.
ACPD
10, 4189–4223, 2010The role of the particle size
distribution
D. S. Ward et al.
Title Page
Abstract Introduction
Conclusions References
Tables Figures
◭ ◮
◭ ◮
Back Close
Full Screen / Esc
Printer-friendly Version
Interactive Discussion
of cloud water over the mountains of Northern Colorado during wintertime storms. Part I: Temporal variations, J. Clim. Appl. Meteorol., 25, 468–488, 1986.
Reutter, P., Trentmann, J., Su, H., Simmel, M., Rose, D., Wernli, H., Andreae, M. O., and P ¨oschl, U.: Aerosol- and updraft-limited regimes of cloud droplet formation: influence of par-ticle number, size and hygroscopicity on the activation of cloud condensation nuclei (CCN),
5
Atmos. Chem. Phys., 9, 7067–7080, 2009, http://www.atmos-chem-phys.net/9/7067/2009/. Rissman, T. A., Nenes, A., and Seinfeld, J. H.: Chemical amplification (or dampening) of the
Twomey effect: Conditions derived from droplet activation theory, J. Atmos. Sci, 61, 919–930, 2004.
Rissman, T. A., VanReken, T. M., Wang, J., Gasparini, R., Collins, D. R., Jonsson, H. H.,
10
Brechtel, F. J., Flagan, R. C., and Seinfeld, J. H.: Characterization of ambient aerosol from measurements of cloud condensation nuclei during the 2003 Atmospheric Radiation Mea-surement Aerosol Intensive Observational Period at the Southern Great Plains site in Okla-homa, J. Geophys. Res.-Atmos., 111, D05S11, doi:10.1029/2004JD005695, 2006.
Roberts, G. C. and Nenes, A.: A continuous-flow streamwise thermal-gradient CCN chamber
15
for atmospheric measurements, Aerosol Sci. Technol., 39(3), 206–221, 2005.
Saleeby, S. M., Cheng, W. Y. Y., and Cotton, W. R.: New developments in the Regional Atmo-spheric Modeling System suitable for simulations of snowpack augmentation over complex terrain, J. Weather Mod., 39, 37–49, 2007.
Saleeby, S. M. and Cotton, W. R.: A large-droplet mode and prognostic number concentration
20
of cloud droplets in the Colorado State University Regional Atmospheric Modeling System (RAMS). Part I: Module descriptions and supercell test simulations, J. Appl. Meteorol., 43, 182–195, 2004.
Saleeby, S. M. and Cotton, W. R.: A binned approach to cloud-droplet riming implemented in a bulk microphysics model, J. Appl. Meteorol., 47, 694–703, doi:10.1175/2007JAMC1664.1,
25
2008.
Saleeby, S. M., Cotton, W. R., Lowenthal, D., Borys, R. D., and Wetzel, M. A.: Influence of cloud condensation nuclei on orographic snowfall, J. Appl. Meteorol. Clim., 48, 903–922, doi:10.1175/2008JAMC1989.1, 2009.
Seinfeld, J. H. and Pandis, S. N.: Atmospheric Chemistry and Physics, Wiley & Sons, Hoboken,
30
New Jersey, USA, 1203 pp., 2006.
ACPD
10, 4189–4223, 2010The role of the particle size
distribution
D. S. Ward et al.
Title Page
Abstract Introduction
Conclusions References
Tables Figures
◭ ◮
◭ ◮
Back Close
Full Screen / Esc
Printer-friendly Version
Interactive Discussion
Twomey, S.: The nuclei of natural cloud formation, Part II: The supersaturation in natural clouds and the variation of cloud droplet concentration, Geofis. Pura. Appl., 43, 243–249, 1959. van den Heever, S. C. and Cotton, W. R.: Urban aerosol impacts on downwind convective
storms, J. Appl. Meteorol. Clim., 46, 828–850, 2007.
Walko, R. L., Band, L. E., Baron, J., Kittel, T. G. F., Lammers, R., Lee, T. J., Ojima, D., Pielke
5
Sr., R. A., Taylor, C., Tague, C., Tremback, C. J., and Vidale, P. J.: Coupled atmospheric-biophysics-hydrology models for environmental modeling, J. Appl. Meteorol., 34, 994–999, 2000.
ACPD
10, 4189–4223, 2010The role of the particle size
distribution
D. S. Ward et al.
Title Page
Abstract Introduction
Conclusions References
Tables Figures
◭ ◮
◭ ◮
Back Close
Full Screen / Esc
Printer-friendly Version
Interactive Discussion
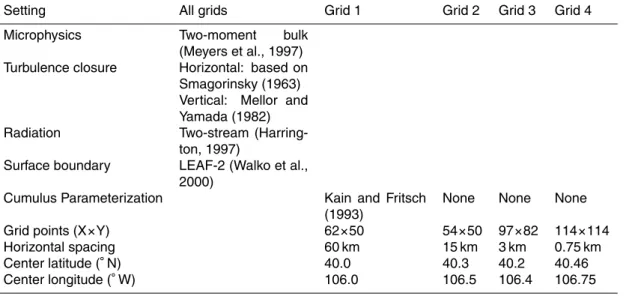
Table 1.Settings used for all RAMS sensitivity simulations.
Setting All grids Grid 1 Grid 2 Grid 3 Grid 4
Microphysics Two-moment bulk (Meyers et al., 1997) Turbulence closure Horizontal: based on
Smagorinsky (1963) Vertical: Mellor and Yamada (1982) Radiation Two-stream
(Harring-ton, 1997)
Surface boundary LEAF-2 (Walko et al., 2000)
Cumulus Parameterization Kain and Fritsch (1993)
None None None
Grid points (X×Y) 62×50 54×50 97×82 114×114
ACPD
10, 4189–4223, 2010The role of the particle size
distribution
D. S. Ward et al.
Title Page
Abstract Introduction
Conclusions References
Tables Figures
◭ ◮
◭ ◮
Back Close
Full Screen / Esc
Printer-friendly Version
Interactive Discussion
Table 2.RAMS sensitivity simulation names and initial values forrgandκ.
Initial κ 0.00001 0.01 0.1 0.2 0.4 0.6 1.28
rg(µm)
0.010 A1 A2 A3 A4 A5 A6 A7
0.020 B1 B2 B3 B4 B5 B6 B7
0.040 C1 C2 C3 C4 C5 C6 C7
ACPD
10, 4189–4223, 2010The role of the particle size
distribution
D. S. Ward et al.
Title Page
Abstract Introduction
Conclusions References
Tables Figures
◭ ◮
◭ ◮
Back Close
Full Screen / Esc
Printer-friendly Version
Interactive Discussion
Table 3.Spillover ratio values for all RAMS sensitivity simulations.
Simulation Number 1 2 3 4 5 6 7
Group
ACPD
10, 4189–4223, 2010The role of the particle size
distribution
D. S. Ward et al.
Title Page
Abstract Introduction
Conclusions References
Tables Figures
◭ ◮
◭ ◮
Back Close
Full Screen / Esc
Printer-friendly Version
Interactive Discussion
Fig. 1.The sensitivity of the droplet number toκ,S(κ), computed from parcel model output, as a function of the ratiow/Ncn, forκ=0.2 to 0.5. The sensitivities were averaged over all initial values ofT. Results are shown for(a)input aerosol size distributions withrg=0.06 µm, and(b) averaged over all initial values ofrg.
ACPD
10, 4189–4223, 2010The role of the particle size
distribution
D. S. Ward et al.
Title Page
Abstract Introduction
Conclusions References
Tables Figures
◭ ◮
◭ ◮
Back Close
Full Screen / Esc
Printer-friendly Version
Interactive Discussion
ACPD
10, 4189–4223, 2010The role of the particle size
distribution
D. S. Ward et al.
Title Page
Abstract Introduction
Conclusions References
Tables Figures
◭ ◮
◭ ◮
Back Close
Full Screen / Esc
Printer-friendly Version
Interactive Discussion
Fig. 3.Representation of the initial lognormal distributions of aerosol used in the parcel model forrg=0.06 µm (solid) andrg=0.10 µm (dashed). Each distribution assumesNcn=1000 and
σg=1.8. The shaded region shows the additional number of particles that would activate in each distribution ifκwere increased from 0.2 to 0.5 in an environment withSmax=0.165%.
ACPD
10, 4189–4223, 2010The role of the particle size
distribution
D. S. Ward et al.
Title Page
Abstract Introduction
Conclusions References
Tables Figures
◭ ◮
◭ ◮
Back Close
Full Screen / Esc
Printer-friendly Version
Interactive Discussion
ACPD
10, 4189–4223, 2010The role of the particle size
distribution
D. S. Ward et al.
Title Page
Abstract Introduction
Conclusions References
Tables Figures
◭ ◮
◭ ◮
Back Close
Full Screen / Esc
Printer-friendly Version
Interactive Discussion
Fig. 5.Vertical profiles of CCN diagnosed from RAMS simulations B2, B3, and B7 for conditions of 0.6% supersaturation andT=25◦C. The profiles were taken from 40.5◦N and 107.0◦W at
30 simulation minutes after the model initialization.
ACPD
10, 4189–4223, 2010The role of the particle size
distribution
D. S. Ward et al.
Title Page
Abstract Introduction
Conclusions References
Tables Figures
◭ ◮
◭ ◮
Back Close
Full Screen / Esc
Printer-friendly Version
Interactive Discussion
Fig. 6.Vertical cross-sections of CDNC (shaded; cm−3) and mean droplet diameter (contoured;
µm) for RAMS simulations(a) B1, (b)B4, (c)B7, (d)A1, (e)A4, (f)A7. Only mean droplet diameters above 10 µm are contoured. The cross-section was taken at 40.455◦N and terrain is
ACPD
10, 4189–4223, 2010The role of the particle size
distribution
D. S. Ward et al.
Title Page
Abstract Introduction
Conclusions References
Tables Figures
◭ ◮
◭ ◮
Back Close
Full Screen / Esc
Printer-friendly Version
Interactive Discussion
Fig. 7. The simulated difference in total storm-period precipitation (mm) between (a)A1–A7, (b)B1–B7,(c)C1–C7 is shown. Positive values (indicating, for example, areas that received more total precipitation in A1 than in A7) are shaded. Negative values are contoured with dotted lines. The continental divide is marked by the solid black line and the mean wind speed (kts) and direction for the lowest 1 km and averaged over the entire simulation time period are plotted with wind barbs.