Effect of air pollution on pediatric
respiratory emergency room visits
and hospital admissions
1Laboratório de Poluição Atmosférica Experimental, Departamento de Patologia
(LIM05), 2Departamento de Pediatria, Pronto Socorro do Instituto da Criança, and 3Departamento de Clínica Médica, Faculdade de Medicina,
Universidade de São Paulo, São Paulo, SP, Brasil
4Programa de Pediatria Ambiental, Departamento de Pediatria,
Faculdade de Medicina, Universidade de Santo Amaro, Santo Amaro, SP, Brasil S.C.L. Farhat1,2, R.L.P. Paulo2,
T.M. Shimoda2,
G.M.S. Conceição1,
C.A. Lin1,3, A.L.F. Braga1,4,
M.P.N. Warth3
and P.H.N. Saldiva1
Abstract
In order to assess the effect of air pollution on pediatric respiratory morbidity, we carried out a time series study using daily levels of PM10, SO2, NO2, ozone, and CO and daily numbers of pediatric
respiratory emergency room visits and hospital admissions at the Children’s Institute of the University of São Paulo Medical School, from August 1996 to August 1997. In this period there were 43,635 hospital emergency room visits, 4534 of which were due to lower respiratory tract disease. The total number of hospital admissions was 6785, 1021 of which were due to lower respiratory tract infectious and/or obstructive diseases. The three health end-points under inves-tigation were the daily number of emergency room visits due to lower respiratory tract diseases, hospital admissions due to pneumonia, and hospital admissions due to asthma or bronchiolitis. Generalized addi-tive Poisson regression models were fitted, controlling for smooth functions of time, temperature and humidity, and an indicator of weekdays. NO2 was positively associated with all outcomes.
Inter-quartile range increases (65.04 µg/m3) in NO
2 moving averages were
associated with an 18.4% increase (95% confidence interval, 95% CI = 12.5-24.3) in emergency room visits due to lower respiratory tract diseases (4-day moving average), a 17.6% increase (95% CI = 3.3-32.7) in hospital admissions due to pneumonia or bronchopneumonia (3-day moving average), and a 31.4% increase (95% CI = 7.2-55.7) in hospital admissions due to asthma or bronchiolitis (2-day moving average). The study showed that air pollution considerably affects children’s respiratory morbidity, deserving attention from the health authorities.
Correspondence
S.C.L. Farhat
Departamento de Pediatria Instituto da Criança Pedro de Alcântara, FM, USP Av. Dr. Enéas C. Aguiar, 647 05403-900 São Paulo, SP Brasil
Fax: +55-11-3064-2744 E-mail: sylviaclf@icr.hcnet.usp.br Presented at the 1st Symposium on Advances in Medical Research, Institute of Medical Investigation Laboratories, HC-FMUSP, São Paulo, SP, Brazil, March 21-22, 2003. Research supported by LIM05 FMUSP, InCr, FMUSP, CNPq, and UNISA. Publication supported by FAPESP.
Received June 12, 2003 Accepted September 30, 2004
Key words
•Time-series •Poisson •Air pollution •Children
•Respiratory morbidity
Introduction
A large number of studies conducted worldwide by different research groups have demonstrated excessive mortality (1-8) and morbidity (9-18) associated with increases
in air pollution. Some have pointed out chil-dren as a group highly susceptible to the effects of air pollution, mainly in terms of respiratory diseases (6,9,12-14,16-18).
further clarification. While air pollution has decreased in urban areas of developed coun-tries, high air pollutant concentrations have been recorded in large urban conglomerates of the developing world (6,7,19-21). In mega-cities of Asia, Africa and Latin America, air pollution has become a permanent compo-nent of the environment.
Time-series analysis seems to be the best approach to detect effects (22,23) in areas where pollution tends to increase. However, the proper application of the time-series ap-proach requires high quality data regarding air pollution and the daily number of a given health outcome such as mortality counts or number of hospital admissions, conditions that are not always satisfied in areas with less developed economies.
São Paulo, the largest city in South Ame-rica and the third most populated in the world, presents adequate conditions to be a good scenario for this kind of analysis. Pres-ently, São Paulo has reliable air pollution and mortality data, and this information was used by our group in previous studies (6,7,24) indicating that air pollution affects mortality in our environment. The objective of our research was to evaluate the impact of air pollution on morbidity based on data gath-ered from a large emergency hospital used as an “environmental probe” (25) and the daily counts of hospital admissions of children in the public health system due to respiratory diseases (26,27). These investigations indi-cated that the effects of air pollution, when expressed in terms of morbidity, are higher than those of mortality, supporting the asso-ciation between quality of the air and quality of life.
In the present study, we prospectively collected data on children’s lower respira-tory tract morbidity (upper airway diseases excluded), expressed in terms of emergency room visits and admissions to our teaching hospital. The associations between these two specific health end-points (emergency room visits and hospital admissions) and air
pollu-tion were investigated in order to determine the pollutants more significantly associated with respiratory morbidity and the lag be-tween worsening in the air quality and the necessity of hospital care and, considering only the hospital admission population, to compare the effects of air pollution on two categories of respiratory diseases, i.e., pa-renchymal disease (pneumonia and bron-chopneumonia) and airway disease (asthma and bronchiolitis).
Material and Methods
Data collection
based on history, physical examination and radiology. Because we are aware of the po-tential misclassification of wheezing-related diseases, we included both asthma and bron-chiolitis in the same disease group called obstructive diseases. Some of the children who are admitted to the emergency room require more prolonged medical care and are admitted to the infirmaries of the Children’s Institute. The number of hospital admissions is smaller than that of emergency room vis-its, but more detailed information can be collected about these patients. This second data set, which includes only the most severe respiratory cases, is similar to that used by Braga and colleagues (26,27).
During the study period, the São Paulo State Sanitary Agency (CETESB) had 13 monitoring stations located in different re-gions of the city. CETESB provides daily values of particulate matter with aerody-namic diameter smaller than 10 µm (PM10) and sulfate dioxide (SO2), measured at 13 stations, and nitrogen dioxide (NO2) meas-ured at 6 stations. For ozone (O3), CETESB provides the highest hourly averages meas-ured at 6 stations, and for carbon monoxide (CO) the highest 8-h moving average meas-ured at 8 stations. The average of the avail-able measurements was calculated for each day and was considered to be representative of citywide conditions. The lowest tempera-ture of the day and the daily relative humid-ity were obtained from the Institute of As-tronomy and Geophysics of the University of São Paulo.
Statistical analysis
We defined three outcomes: lower respi-ratory emergency room visits and hospital admissions due to pneumonia or bronchop-neumonia and to asthma or bronchiolitis. Poisson regression techniques were adopted in this analysis because daily numbers of both emergency room visits and hospital admissions are count events and, therefore,
present Poisson distribution. Generalized additive models (28) were used because they better fit epidemiologic time-series studies of the effects of air pollution on health. They allow a more flexible modeling of the asso-ciation between health end points and the predictor variables due to the possibility to include linear and smooth functions for the confounders in the same model. We adopted the loess, a locally weighted running line smoother, for time, temperature, and humid-ity and day of the week. In each model, the span for the smooth function of time was chosen to remove long-term trends from the data, removing seasonality and minimizing the autocorrelation of the residuals. In mod-els in which serial correlation of the residu-als remained after the adjustment of time span we incorporated autoregressive terms (29).
Spans of smooth functions for tempera-ture and humidity variables were chosen in order to minimize Akaike’s Information Cri-teria (30). In addition, indicators for each day of the week were included in the models. Robust regression (M-estimation) was used in order to reduce sensitivity to outliers in the dependent variable.
To determine the possible lag between the increases in air pollution and emergency room visits or hospital admissions, we adopted regression models considering dif-ferent lag structures for each pollutant, rang-ing from the concurrent day to 7 days. Analy-ses were conducted using single-, 2-pollut-ant, and multi-pollutant models. The results are reported in terms of percent increase in the outcomes and the 95% confidence inter-vals were estimated assuming normal distri-bution of the estimated regression coeffi-cients.
These regression models were estimated using the S-PLUS software (31).
Results
exceeded four times. SO2 levels remained below the regulatory standards.
Descriptive analyses of the variables employed in the study are presented in Table 1. During the study period there were 43,635 hospital emergency room visits, 4534 of which were due to lower respiratory tract disease. The total number of admissions to the Children’s Institute was 6785, 1021 of which were due to lower respiratory tract infectious and/or obstructive diseases.
The Pearson correlation coefficients be-tween air pollutants and weather variables are presented in Table 2. The pollutants were highly correlated to each other except CO and O3. Also, all pollutants were negatively correlated with temperature and humidity.
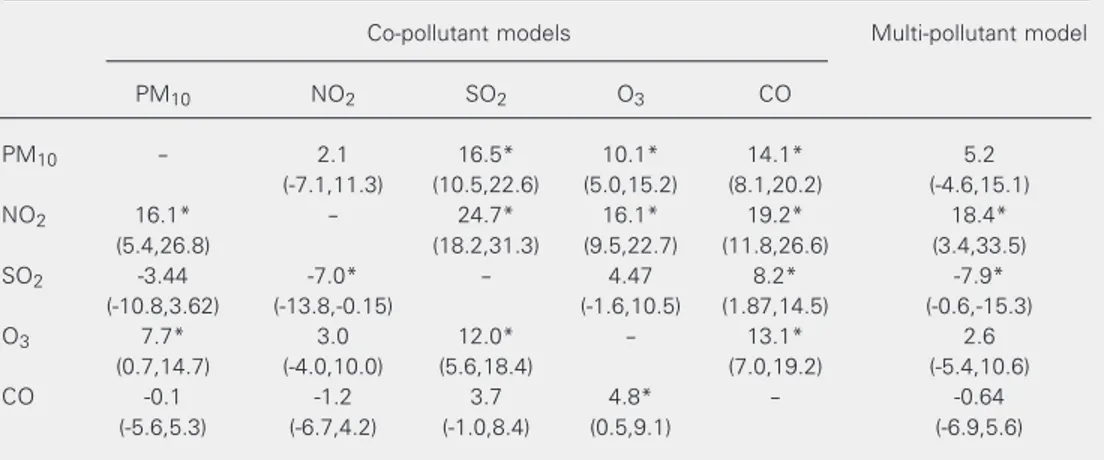
Figure 1 shows the percent increases and 95% confidence intervals in lower respira-tory tract emergency room visits due to inter-quartile range increases in 5-day moving average of PM10, 4-day moving average of NO2, 5-day moving average of SO2, 4-day moving average of O3, and 2-day moving average of CO estimated by single-pollutant models. All of them contributed to an in-crease in emergency room visits. Table 3 presents the effects estimated using co-pol-lutant and multi-polco-pol-lutant models. Only the effect of NO2 did not change substantially in the two approaches, remaining positive and statistically significant, whereas the others presented a highly unstable behavior. PM10 and O3 lost their significance in co-pollutant models when they were included withNO2, and CO and SO2 effects only resisted the inclusion of O3 and CO, respectively. Unex-pected and implausible protective effects were observed for SO2 when it was included in a co-pollutant model with NO2 or in the multi-pollutant model.
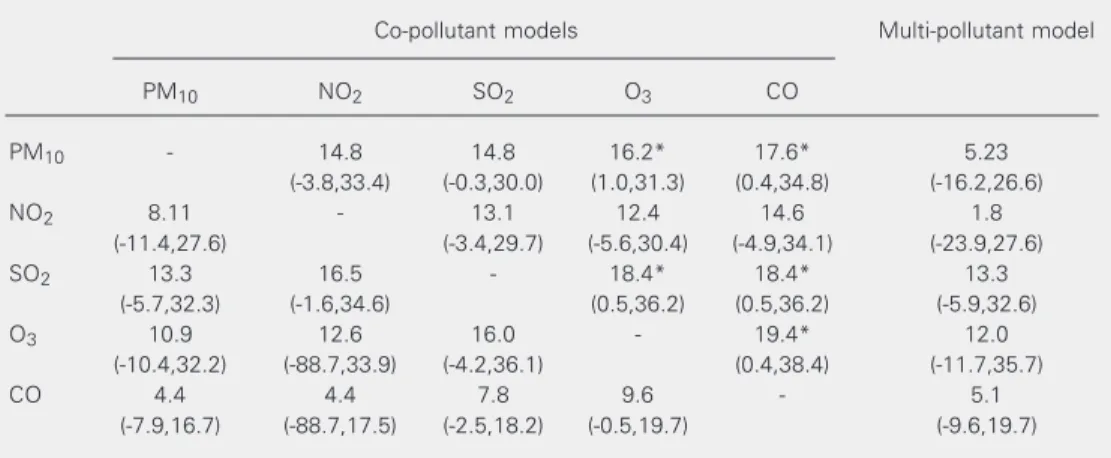
Figure 2 shows the percent increases and 95% confidence intervals in pneumonia or bronchopneumonia hospital admissions due to interquartile range increases in 6-day mov-ing average of PM10, 3-day moving average of NO2, 6-day moving average of SO2, 7-day
Table 2. Pearson correlation coefficients between the variables employed in the present study.
PM10 SO2 NO2 O3 CO Relative
humidity
PM10 1.00
SO2 0.69* 1.00
NO2 0.83* 0.66* 1.00
O3 0.35* 0.28* 0.47* 1.00
CO 0.72* 0.49* 0.59* -0.08 1.00
Relative humidity -0.55* -0.42* -0.41* -0.30* -0.43* 1.00
Minimum temperature -0.44* -0.18* -0.32* -0.01 -0.22* 0.16*
PM10 = particulate matter with aerodynamic diameter smaller than 10 µm. *P < 0.05 (t-test of Ho: coefficient = 0 vs Ha: coefficient ≠ 0).
Table 1. Descriptive statistics for the variables employed in the present study.
Mean SD Minimum IQR Maximum N
Lower respiratory diseases
ER visits per day (total) 11.5 5.7 1.0 30.0 396
Hospital admissions per day
Infectious 2.0 1.6 0 9.0 366
Obstructive 0.8 1.0 0 5.0 366
Pollutants
PM10 (µg/m3) 62.6 26.6 25.5 30.0 186.3 396
SO2 (µg/m3) 23.7 10.0 3.4 12.5 75.2 396
NO2 (µg/m3) 125.3 51.7 42.5 65.0 369.5 396
O3 (µg/m3) 72.1 40.1 11.7 49.3 240.4 396
CO (ppm) 3.8 1.6 1.1 1.8 11.4 396
Weather
Minimum temperature (ºC) 14.6 3.3 4.0 21.1 396
Relative humidity (%) 80.9 7.7 57.0 96.4 396
SD = standard deviation of the mean; IQR = interquartile range; N= number of days; ER = emergency room; PM10 = particulate matter with aerodynamic diameter smaller than 10 µm.
values (average concentration = 62.6 µg/m3) exceeded the annual standard adopted for inhalable particles (yearly mean of 50 µg/ m3). The daily standard of PM
Table 3. Increases of lower respiratory tract disease emergency room visits due to interquartile range increases in 5-day moving average of PM10, 4-day moving average of NO2, 5-day moving average of SO2, 4-day moving average of O3, and 2-day moving average of CO in a multi-pollutant and co-pollutant models.
Co-pollutant models Multi-pollutant model
PM10 NO2 SO2 O3 CO
PM10 - 2.1 16.5* 10.1* 14.1* 5.2
(-7.1,11.3) (10.5,22.6) (5.0,15.2) (8.1,20.2) (-4.6,15.1)
NO2 16.1* - 24.7* 16.1* 19.2* 18.4*
(5.4,26.8) (18.2,31.3) (9.5,22.7) (11.8,26.6) (3.4,33.5)
SO2 -3.44 -7.0* - 4.47 8.2* -7.9*
(-10.8,3.62) (-13.8,-0.15) (-1.6,10.5) (1.87,14.5) (-0.6,-15.3)
O3 7.7* 3.0 12.0* - 13.1* 2.6
(0.7,14.7) (-4.0,10.0) (5.6,18.4) (7.0,19.2) (-5.4,10.6)
CO -0.1 -1.2 3.7 4.8* - -0.64
(-5.6,5.3) (-6.7,4.2) (-1.0,8.4) (0.5,9.1) (-6.9,5.6)
Data are reported as percent increase and 95% confidence interval. PM10 = particulate matter with aerodynamic diameter smaller than 10 µm.
*P < 0.05 (likelihood-ratio test: full model vs reduced model).
Figure 3. Percent increases and 95% confidence inter-vals in asthma or bronchiolitis hospital admissions due to interquartile range increases in 2-day moving aver-age of PM10, 2-day moving average of NO2, 2-day moving average of SO2, 3-day moving average of O3, and 2-day moving average of CO in single-pollutant models. PM10 = particulate matter with aerodynamic diameter smaller than 10 µm.
% Increase
40 30 20 10 0 -10 -20
PM10 NO2 SO2 O3 CO
50 60
Figure 1. Percent increases and 95% confidence inter-vals in lower respiratory tract disease emergency room visits due to interquartile range increases in 5-day mov-ing average of PM10, 4-day moving average of NO2, 5-day moving average of SO2, 4-day moving average of O3, and 2-day moving average of CO in single-pollutant models. PM10 = particulate matter with aerodynamic diameter smaller than 10 µm.
Figure 2. Percent increases and 95% confidence intervals in pneumonia or bronchopneumonia hospital admissions due to interquartile range increases in 6-day moving aver-age of PM10, 3-day moving average of NO2, 6-day moving average of SO2, 7-day moving average of O3, and 2-day moving average of CO in single-pollutant models. PM10 = particulate matter with aerodynamic diameter smaller than 10 µm.
% Increase
30 25
20
15 10
5 0
PM10 NO2 SO2 O3 CO
% Increase
45 40 35 30 25 20 15
PM10 NO2 SO2 O3 CO
Table 5. Increases of asthma or bronchiolitis hospital admissions due to interquartile range increases in 2-day moving average of PM10, 2-day moving average of NO2, 2-day moving average of SO2, 3-day moving average of O3, and 2-day moving average of CO in a multi-pollutant and co-pollutant models.
Co-pollutant models Multi-pollutant model
PM10 NO2 SO2 O3 CO
PM10 - -11.04 15.8 11.7 12.4 -15.5
(-50.0,28.0) (-7.8,39.3) (-10.4,33.9) (-14.8,39.7) (-61.2,30.2)
NO2 47.7* - 33.1* 28.0 28.8 39.3
(1.15,94.2) (5.7,60.5) (-1.0,57.0) (-0.2,57.9) (-14.9,93.5)
SO2 3.8 -1.2 - 9.4 6.2 -0.5
(-23.3,31.0) (-27.4,25.0) (-14.6,33.5) (-18.8,31.2) (-27.7,26.6)
O3 14.2 5.1 18.8 - 20.0 8.7
(-11.9,40.3) (-23.5,33.6) (-6.1,43.7) (-3.7,43.7) (-24.9,42.4)
CO 6.1 2.4 10.6 12.4 - 8.8
(-14.9,27.1) (-16.9,21.7) (-6.6,27.8) (-3.6,28.4) (-15.6,33.3)
Data are reported as percent increase and 95% confidence interval. PM10 = particulate matter with aerodynamic diameter smaller than 10 µm.
*P < 0.05 (likelihood-ratio test: full model vs reduced model). moving average of O3, and 2-day moving average of CO in single-pollutant models. The five pollutants presented positive and statistically significant associations with the outcome and similar effect sizes. Table 4 shows the effects of air pollutants on pneu-monia or bronchopneupneu-monia hospital ad-missions using co-pollutant and multi-pol-lutant models. The inclusion of
co-pollut-ants reducedall effects observed in single-pollutant models. PM10 and SO2 resisted the inclusion of O3 and CO, while the effect of O3 was not substantially affected by CO. Despite these decreases, no protective effect was detected. In a multi-pollutant model all pollutants remained positively associated with the outcome although losing statistical significance.
Table 4. Increases of pneumonia or bronchopneumonia hospital admissions due to interquartile range increases in 6-day moving average of PM10, 3-day moving average of NO2, 6-day moving average of SO2, 7-day moving average of O3, and 2-day moving average of CO in a multi-pollutant and co-pollutant models.
Co-pollutant models Multi-pollutant model
PM10 NO2 SO2 O3 CO
PM10 - 14.8 14.8 16.2* 17.6* 5.23
(-3.8,33.4) (-0.3,30.0) (1.0,31.3) (0.4,34.8) (-16.2,26.6)
NO2 8.11 - 13.1 12.4 14.6 1.8
(-11.4,27.6) (-3.4,29.7) (-5.6,30.4) (-4.9,34.1) (-23.9,27.6)
SO2 13.3 16.5 - 18.4* 18.4* 13.3
(-5.7,32.3) (-1.6,34.6) (0.5,36.2) (0.5,36.2) (-5.9,32.6)
O3 10.9 12.6 16.0 - 19.4* 12.0
(-10.4,32.2) (-88.7,33.9) (-4.2,36.1) (0.4,38.4) (-11.7,35.7)
CO 4.4 4.4 7.8 9.6 - 5.1
(-7.9,16.7) (-88.7,17.5) (-2.5,18.2) (-0.5,19.7) (-9.6,19.7)
Data are reported as percent increase and 95% confidence interval. PM10 = particulate matter with aerodynamic diameter smaller than 10 µm.
Air pollutants increased asthma or bron-chiolitis hospital admissions (Figure 3) and, although these effects were not statistically significant, except for NO2, the size of the effects was almost the same as that observed for pneumonia or bronchopneumonia hospi-tal admissions. The inclusion of PM10 and SO2 did not reducethe effect of NO2. How-ever, implausible protective effects appeared in both co-pollutant and multi-pollutant analyses (Table 5).
Discussion
In the present study, we found significant and positive associations between air pollu-tion and respiratory morbidity in children. The effect of air pollution was detected in terms of emergency room visits and hospital admissions. In terms of respiratory admis-sions, when the cases were separated into diseases of the airways and diseases affect-ing pulmonary parenchyma, the effect was positive in both cases. The associations found occurred within a short period of time of the order of a few days. Although the daily air quality standards were exceeded on a few days during the study period, the association between air pollution and respiratory mor-bidity was robust enough to resist different options of statistical modeling, reinforcing the previous concept that air pollution may affect health even during non-episodic events of pollution (9-11).
It was difficult to ascribe the pathogen-esis of the observed effect to a single pollut-ant. For instance, emergency room visits were significantly associated with all pollut-ants, probably because of the high degree of correlation among them, which is expected to occur in a pollution scenario generated by automotive emissions. The difficulty in iso-lating the most dangerous pollutant is a limi-tation of the ecological approach employed by us, and was present in our previous ani-mal and epidemiological studies (7,25,32,33). In fact, it is not even possible to determine
whether the observed effects were due to the measured pollutants or whether they repre-sent a proxy variable of other compounds present in the atmosphere of São Paulo and that are not evaluated by the existing air pollution monitoring system. Anyway, as reportedin the experimental studies by our group (32,33), the mixture of air pollutants present in São Paulo induces damage to the mucociliary epithelium leading to loss of cilia, increased mucus density, increased in-flammatory responses, and increased fre-quency of inflammatory and infectious dis-eases.
When obstructive pathologies were evalu-ated the number of pollutants associevalu-ated with morbidity decreased. Nitrogen dioxide was the pollutant most robustly associated with cases of severe asthma and bronchiolitis that required hospital admission. This is not the first time that this pollutant appears as a strong indicator of atmospheric risk in São Paulo. Our studies on children and on intra-uterine mortality (6,24) also reported the same finding. We do not know whether this association is real, or if nitrogen oxides rep-resent a good indicator of the complex mix-ture present in automotive emissions, as al-ready mentioned. Moreover, in São Paulo nitrogen oxides represent one of the major sources of atmospheric oxidants generated by photochemical reactions. Thus, we can-not establish an explicit association between respiratory morbidity and nitrogen oxides
per se.
The magnitude of the effect of air pollu-tion on respiratory morbidity varies with the morbidity indicator (emergency room visits or hospital admissions) and with the pollut-ant considered. In the case of patients who required hospital admissions, this number was higher, reaching a peak for obstructive diseases and NO2 levels (31.4%).
References
1. Firket J (1931). Sur les causes des accidents survenus dans la vallée de la Meuse, lors des brouillards de décembre 1930. Bulletin et Memoires de l’Academie Royale de Medecine de Belgique, 11: 683-741.
2. Logan WPD (1953). Mortality in London fog incident. Lancet, 1: 336-338.
3. Fairley D (1990). The relationship of daily mortality to suspended particulates in Santa Clara County, 1980-1986. Environmental Health Perspectives, 89: 159-168.
4. Schwartz J (1991). Particulate air pollution and daily mortality in Detroit. Environmental Research, 56: 204-213.
5. Dockery DW, Pope III CA, Xu X, Spengler JD, Ware JH, Fay ME, Ferris Jr BG & Speizer FE (1993). The association between air pollution and mortality in six US cities. New England Journal of Medicine, 329: 1753-1759.
6. Saldiva PHN, Lichtenfels AJFC, Paiva PSO, Barone IA, Martins MA, Massad E, Pereira JCR, Xavier VP, Singer JM & Böhm GM (1994). Association between air pollution and mortality due to respiratory diseases in children in São Paulo, Brazil: a preliminary report. Envi-ronmental Research, 65: 218-225.
7. Saldiva PHN, Pope II CA, Schwartz J, Dockery DW, Lichtenfels AJFC, Salge JM, Barone IA & Böhm GM (1995). Air pollution and mortality in eldery people. Archives of Environmental Health, 50: 159-163.
8. Pope III CA, Thun MJ, Namboodiri MM, Dockery DW, Evans JS, Speizer FE & Heath Jr CW (1995). Particulate air pollution as a predictor of mortality in a prospective study of US adults. American Journal of Respiratory and Critical CareMedicine, 151: 669-674. 9. Dockery DW, Speizer FE, Stram DO, Ware JH & Ferris Jr BG (1989).
Effects of inhalable particles on respiratory health of children.
Ameri-general rule, the severity of the health effects associated with air pollution is greater for patients that require hospital admission than for patients looking for emergency care. Thus, in the present series, the estimated impact of air pollution varied with the severity of the health outcome. In addition, since several pollutants presented significant associations with respiratory morbidity, there was a varia-tion of the estimated morbidity depending on the pollutant used as a predictor in the statistical modeling. These problems are ag-gravated by the relatively small number of studies focusing specifically on air pollution and children’s hospital admissions. For in-stance, our mean effect of pollution on emer-gency room visits is comparable to that re-ported by Lin et al. (25) and Braga et al. (26). Sunyer et al. (34) reported a relative risk of hospital admissions due to asthma (some-what equivalent to our admissions due to asthma or bronchiolitis) of 1026 per 50 µg/ m3 of NO
2, a value considerably lower than that reported in our study for an equivalent variation of this pollutant (1.16). In fact, the effects of air pollution on children’s health in São Paulo are somewhat greater than those reported for adults in other locations (35,36). The consistency of our results reflects the usefulness of our teaching hospital as a sentinel for epidemiological studies. This is
quite a convenient situation for locations like São Paulo and other Latin American cities where centralized morbidity data are not available. The large university hospitals play a major role in medical care in develop-ing countries and probably report the most reliable morbidity data in these locations, permitting the collection of a large number of morbidity events that may be modeled on ecological studies such as ours. The Children’s Institute attends patients from most of São Paulo’s neighborhoods. In this specific case, its patients may be accepted as a representative sample of the population of São Paulo city. Thus, the validity of the use of morbidity data collected from a single large hospital in studies focusing the health impact of a widespread toxic agent such as air pollution should be further explored in other investigations at other locations.
can Review of Respiratory Disease, 139: 587-594.
10. Pope II CA, Dockery DW, Sengler JD & Raizenne ME (1991). Respi-ratory health and PM10 pollution: a daily time series analysis.
Ameri-can Review of Respiratory Disease, 144: 668-674.
11. Bates DV, Baker-Anderson M & Sizto R (1990). Asthma attack periodicity: A study of hospital emergency visits in Vancouver.
Environmental Research, 51: 51-70.
12. Pope III CA (1991). Respiratory hospital admissions associated with PM10 pollution in Utah, Salt Lake and Cache Valleys. Archives of
Environmental Health, 46: 90-97.
13. Raizenne M, Neas LM, Damokosh AI, Dockery DW, Spengler JD, Koutrakis P, Ware JH & Speizer FE (1996). Health effects of acid aerosols on North American children: pulmonary function. Environ-mental Health Perspectives, 104: 506-514.
14. Boezen HM, van der Zee SC, Postma DS, Vonh JM, Gerritsen J, Hoek G, Brunekreef B, Rijcken B & Schouten JP (1999). Effects of ambient air pollution on upper and lower respiratory symptoms and peak expiratory flow in children. Lancet, 353: 874-878.
15. Samet JM, Speizer FE, Bishop YS, Spengler JD & Ferris Jr BG (1981). Relationship between air pollution and emergency room visits in an industrial community. Journal of the Air Pollution Control Association, 31: 236-240.
16. Dockery DW, Cunningham J, Damokosh AI, Neas LM, Spengler JD, Koutrakis P, Ware JH, Raizenne M & Speizer FE (1996). Health effects of acid aerosols on North American children; respiratory symptoms. Environmental Health Perspectives, 104: 500-505. 17. Samet JM, Lambert WE, Skipper BJ, Cushing AH, McLaren LC,
Schwab M & Spengler JD (1992). A study of respiratory illness in infants and nitrogen dioxide exposure. Archives of Environmental Health, 47: 57-63.
18. Schmitzberger R, Rhomberg K, Buchele H, Puchgger R, Schmitz-berger-Natzmer D, Kemmler G & Pansch B (1993). Effects of air pollution on the respiratory tract of children. Pediatric Pulmonology, 15: 68-74.
19. Ostro B, Sanches JM, Aranda C & Eskeland GS (1996). Air pollution and mortality: results from a study of Santiago, Chile. Journal of Exposure Analysis and Environmental Epidemiology, 6: 97-114. 20. Yang CY, Wang JD, Chen CC, Hwang JS & Chen PC (1998).
Respira-tory symptoms of primary school children living in a petrochemical polluted area in Taiwan. Pediatric Pulmonology, 25: 299-303. 21. Romieu I, Meneses F, Ruiz S, Sienra JJ, Huerte J & White M (1996).
Effects of air pollution on the respiratory health of asthmatic chil-dren living in Mexico City. American Journal of Respiratory and Critical Care Medicine, 154: 300-307.
22. Pope III CA & Schwartz J (1996). Time series for the analysis of pulmonary health data. American Journal of Respiratory and Critical Care Medicine, 154: 229-233.
23. Gamble J & Lewis RJ (1996). Health and respiratory particulate
(PM10) air pollution: a cause or statistical association?
Environmen-tal Health Perspectives, 104: 838-850.
24. Pereira LAA, Loamis D, Conceição GMS, Braga ALF, Arces RM, Kishi H, Singer JM, Böhm GM & Saldiva PHN (1998). Association between air pollution and intrauterine mortality in São Paulo, Brazil.
Environmental Health Perspectives, 106: 325-329.
25. Lin CA, Martins MA, Farhat SCL, Pope III CA, Conceição GMS, Anastácio VM, Hatanaka M, Andrade WC, Hamaue WR & Böhm GM (1999). Air pollution and respiratory illness of children in São Paulo. Paediatric and Perinatal Epidemiology, 13: 475-488. 26. Braga ALF, Conceição GMS, Pereira LAA, Kishi HS, Pereira JCR,
Andrade MF, Gonçalves FLT, Saldiva PHN & Latorre MRDO (1999). Air pollution and pediatric respiratory admissions in São Paulo, Brazil. Journal of Environmental Medicine, 1: 95-102.
27. Braga ALF, Saldiva PHN, Pereira LAA, Menezes JJC, Conceição GMS, Lin CA, Zanobetti A, Schwartz J & Dockery DW (2001). Health effects of air pollution exposure on children and adolescents in São Paulo, Brazil. Pediatric Pulmonology, 31: 106-113.
28. Hastie T & Tibshirani R (1990). Generalized Additive Models. Chapman & Hall, London, UK.
29. Brumback BA, Ryan LM, Schwartz J, Neas LM, Stark PC & Burge HA (2000). Transitional regression models with application to envi-ronmental time series. Journal of the American Statistical Associa-tion, 95: 16-28.
30. Akaike H (1973). Information theory and an extension of the maxi-mum likelihood principle. In: Petrov BN & Csaki F (Editors), 2nd International Symposium of Information Theory. Akademiai Kaiado, Budapest, Hungary.
31. Anonymous (1997). S-Plus for Windows™, Version 4.0. Data analy-sis Products Division, MathSoft Inc., Seattle, WA, USA.
32. Saldiva PHN, King M, Delmonte VLC et al. (1992). Respiratory alterations due to urban air pollution: an experimental study in rats.
Environmental Research, 55: 19-33.
33. Pereira PM, Saldiva PHN, Sakai RS, Böhm GM & Martins MA (1997). Urban levels of air pollution increase lung responsiveness in rats. Environmental Research, 69: 96-101.
34. Sunyer J, Spix C, Quénel P et al. (1997). Urban air pollution and emergency admissions for asthma in four European cities: the APHEA Project. Thorax, 57: 760-765.
35. Thurston GD, Ito K & Lippman M (1992). A multi year period of air pollution and respiratory hospital admissions in three New York state metropolitan area: Results for 1988 and 1989 summers. Jour-nal of Exposure AJour-nalysis and Environmental Epidemiology, 2: 429-450.