Article
J. Braz. Chem. Soc., Vol. 27, No. 5, 950-957, 2016. Printed in Brazil - ©2016 Sociedade Brasileira de Química 0103 - 5053 $6.00+0.00
*e-mail: [email protected]
A New Fluorescence Method for Determination of Ammonium Nitrogen in Aquatic
Environment Using Derivatization with Benzyl Chloride
Guiping Cao,*,a Yang Su,a Yafeng Zhuanga and Jilai Lub
aDepartment of Chemical Engineering, Changzhou Institute of Technology, 213022 Changzhou,
P. R. China
bJiangsu Academy of Environmental Science, 210036 Nanjing, P. R. China
We introduce a novel approach in simple and highly sensitive fluorometric determination of ammonium nitrogen. The proposed method is based on a fluorescence derivatization with benzyl chloride. The benzyl chloride was converted to a new fluorescent derivative by reaction with ammonium ion (NH4+) in the presence of sodium bicarbonate. The excitation and emission wavelengths were 258 and 284 nm, respectively. The effects of benzyl chloride concentration, sodium bicarbonate concentration, reaction temperature and time, and hydrochloric acid concentration were studied in detail. Under the optimal conditions of the experiment, the linear range for determination of ammonium nitrogen was 0.01-0.60 mg L−1, and the detection limit
was 0.008 mg L−1. Relative standard deviation of eleven measurements for 0.40 mg L−1 NH 4+-N was 2.6%. The method was successfully applied to the determination of ammonium nitrogen concentration in different water samples. The mechanism of the derivatization was further confirmed by Fourier transform infrared (FTIR) spectra.
Keywords: ammonium nitrogen, fluorometric determination, derivatization, benzyl chloride
Introduction
Nitrogen is an essential nutrient for all forms of life, and even small changes in biologically-available nitrogen levels can affect the levels of microbiological, plant and animal life.1 In water, there exist toxic, unionized ammonia
(NH3) and the relatively non-toxic ionized ammonium ion
(NH4+). In the pH range of most natural waters, ammonium
nitrogen will exist mainly as ammonium ion.2 Ammonium
is a reduced form of nitrogen and can be oxidized, so it is one of the important micronutrients and intermediates of the nitrogen cycle in aquatic ecosystems.3
However, ammonium is also a common alkaline pollutant in freshwater, and acutely toxic to some fish at concentrations of 200 µg N L−1.4,5 High concentrations
of ammonium nitrogen in water can lead to nutrient enrichment in water ecosystem, and the subsequent increase in biological activity can lead to algal blooms, oxygen depletion, odor and toxicity problems.6 Moreover,
ammonium in drinking water is readily transformed into nitrate, which is reportedly toxic for human beings.7,8
Therefore, the quantity of ammonium nitrogen is a routine examination for the monitoring of surface water and wastewater in China. The development of a sensitive and selective analytical method for ammonium nitrogen is significant in the environmental evaluation of water pollution and fundamental to the understanding of nitrogen cycling in aquatic ecosystems.9
Various methods and techniques have been developed for the estimation of ammonium nitrogen concentration in different samples.10-14 The most popular techniques for the
determination of ammonium nitrogen in aqueous samples are the spectrophotometry method based on the formation of Nessler reagent15 or indophenol blue16 and ion-selective
electrode method.17 Though the spectrophotometry method
using Nessler reagent or indophenols blue is simple and economical, it is not sensitive enough for the determination of sub-micromolar concentrations of ammonium nitrogen18
and also using mercury or cyanide has a problem with regard to waste liquid. A solvent extraction method is developed to increase the sensitivity,19 but the procedure
the upper working range, allowing measurement up to 100 mg L−1.2 However, the detection limit of this method
is high, which restricts its application in trace analysis, and the direct analysis may require long equilibration time. A flow injection chemiluminescence analysis has also been used for the determination of ammonium concentration in rainwater samples.20 However, a limitation to widespread
application of this technique is its low sensitivity and the requirement to prepare large quantities of analytical reagents.
Fluorometry is a popular and attractive detection method because of its high sensitivity in detection
field.21,22 O-Phthaldialdehyde (OPA), usually used in
combination with some reductants including sulfite,23,24
2-mercaptoethanol25,26 and n-acetyl-cysteine,27 has been
widely applied to detect ammonium due to the yield highly fluorescent isoindole derivatives. This fluorometric method is improved by combining with ion chromatography to solve interference problems and enlarge the working
range,28-30 but it requires expensive chromatographic
equipment and a long diffusion time.31
Benzyl chloride (BnCl) is a clear yellowish, volatile liquid that is widely used as an intermediate for the production of benzyl compounds and quaternary ammonium compounds
used in perfumery, dyes and pharmaceuticals.32,33 In
this paper, BnCl was used as a derivatization agent and reacted with ammonium ion under alkaline conditions. Based on the effect of ammonium ion concentration on the fluorescence intensity of this reacted solution, a new fluorometric method has been proposed to detect the trace ammonium nitrogen concentration in aquatic environment. The proposed method is inexpensive, convenient, and provides a practical method working in a large range of ammonium nitrogen concentration with higher selectivity. The analytical conditions for determination of ammonium nitrogen were optimized, and its application to real water was also investigated with satisfactory results.
Experimental
Reagents
An ammonium nitrogen stock solution (100.0 mg L−1
NH4+-N) was prepared by dissolving 0.1911 g of ammonium
chloride with water into a 500 mL volumetric flask and then storing in the dark at 4 °C. Working solutions of 5.0 mg L−1
NH4+-N were freshly prepared by diluting the stock solution
with water before use. A 0.08 mol L−1 BnCl stock solution
was prepared by dissolving 2.30 mL of BnCl in 250 mL of absolute ethanol. Working solutions of 6.4 × 10⁻⁴ mol L−1
BnCl were prepared by diluting 2.00 mL of BnCl stock
solution into a 250 mL volumetric flask with absolute ethanol. Other chemical solutions used in the study include 0.5 mol L−1 sodium bicarbonate (NaHCO
3) and 0.01 mol L−1
hydrochloric acid (HCl), which were prepared by dissolving an appropriate amount of each reagent in water.
Ammonium chloride was of guarantee reagent grade, the other chemicals were of analytical reagent grade, and double-distilled water was used throughout the present study.
Instruments
The fluorescence spectra were measured with an F-4600 fluorescence spectrophotometer (Shanghai Techcomp Instrument Ltd., Shanghai, China). The fluorescence intensity was obtained using a 1 cm quartz cell. A model HH-601 thermostat bath (Jintan Ronghua Instrument Co., Ltd., Jintan, China) was used to keep the temperature of the system constant. A rotary evaporator (Yarong Biochemical Instrument Co., Ltd., Shanghai, China) was used to concentrate the reacted solution. The Fourier transform infrared (FTIR) spectra of BnCl and the corresponding reacted solution were measured using a Nicolet model IR200 FTIR spectrophotometer (ThermoFisher, USA).
Determination procedure
In a 25.0 mL volumetric flask, 8.0 mL of 6.4 × 10⁻⁴ mol L−1 BnCl, 1.5 mL of 0.5 mol L−1 NaHCO
3,
and an appropriate amount of NH4+-N working solution
or water samples were added. The flask was then diluted approximately to the scale with water, and placed in a thermostat water bath at 35 ± 0.2 °C for 4 h, after which
2.0 mL of 0.01 mol L−1 HCl was added and the mixture
was diluted to the mask with water and then shaken until a homogeneous solution was obtained. When the reacted solution cooled to room temperature, the fluorescence intensity F of the sample solution was determined at an excitation wavelength of 258 nm and emission wavelength of 284 nm. The fluorescence value F0 of the blank solution
without ammonium nitrogen was obtained under the same conditions, then the different value was calculated by ∆F= F − F0 and used for quantification.
Mechanism analysis
For identifying the reaction mechanism of the proposed method, 0.4 mg L−1 NH
4+-N solution was reacted according
three times. Thirdly, the organic extract was enriched to a constant volume in a rotary evaporator under the following conditions: room temperature, 0.09 MPa vacuum pressure, and 75 rpm rotating speed. Finally, the concentrated liquid was dried by anhydrous sodium sulfate and analyzed by FTIR spectrophotometer. Furthermore, the IR spectrum of BnCl dissolved in absolute ethanol was also determined.
Results and Discussion
Spectral characteristics
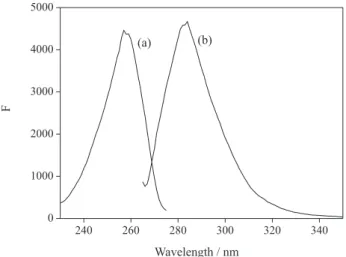
The solution containing BnCl or ammonium cannot emit fluorescence. However, after the two components chemically reacted under certain conditions, the reacted solution could produce a strong fluorescence signal. The fluorescence spectra produced by the interaction of 2.05 × 10⁻⁴ mol L−1 BnCl and 0.40 mg L−1 NH
4+-N
are shown in Figure 1. There was a good mirror-image relationship between the excitation and emission spectra. The fluorescence intensity reached the highest value at 258 nm when the excitation spectrum was scanned between 230 and 275 nm. At the same time, the fluorescence intensity attained the highest value at 284 nm when the emission spectrum was scanned at 265 to 350 nm. Therefore, the optimum excitation and emission wavelength are 258 and 284 nm, respectively.
Effects of experimental variables
To take full advantages of the procedure, the reagent concentrations and reaction conditions must be optimized. Various parameters were investigated in order to obtain an optimized system. Each parameter was optimized by setting all other parameters to be constant and optimizing
the parameter of interest one at a time. The NH4+-N
concentration was kept to 0.40 mg L−1 in all reactions.
Each experimental variable was replicated at least thrice. As a fluorescent derivatization reagent of the reaction, the effect of BnCl concentration was studied in the range from 0.26 × 10⁻⁴ to 2.30 × 10⁻⁴ mol L−1, and the results
are shown in Figure 2. Although containing benzene ring, the BnCl could not launch any fluorescence signal due to the electrophilic group ·Cl group. After the ·Cl group had been removed from the benzyl group through a chemical reaction, the solution began to produce a fluorescence signal. Furthermore, the fluorescence intensity increased with the increase of BnCl concentration, and reached the highest value at 1.79 × 10⁻⁴ mol L−1 BnCl. The graph of
∆F versus BnCl concentration also showed a constant value in the range from 1.79 × 10⁻⁴ to 2.30 × 10⁻⁴ mol L−1. In order
to improve the stability and reduce the cost of determination method, a concentration of 2.05 × 10⁻⁴ mol L−1 BnCl
was selected in the present study, which was realized by adding 8.0 mL of BnCl working solution to a 25 mL flask. Compared with the fluorometric derivatization with OPA,15
in which 4 mmol L−1 OPA was used, this new method saved
derivation reagents.
In alkaline conditions, the C−Cl bond in BnCl may
break and the ·Cl group may be replaced,34 at the same time,
the NH4+ ion is transformed into the form of NH3 which
can easily provide the ·NH2 group. Sodium bicarbonate is
an acid salt and its aqueous solution has a weak alkalinity, which is conducive to promoting the chemical reaction between the ·Cl and the ·NH2 group. Furthermore, carbon
dioxide is a major product of bicarbonate hydrolysis, which might have little influence on the fluorescence spectra. Therefore, sodium bicarbonate was chosen as an accelerant to promote the ·Cl group in BnCl to be replaced
240 260 280 300 320 340
0 1000 2000 3000 4000 5000
(b) (a)
F
Wavelength / nm
Figure 1. Fluorescence spectra of the reaction system. (a) Excitation spectrum; (b) emission spectrum.
0.0 0.4 0.8 1.2 1.6 2.0 2.4
0 1000 2000 3000 4000 5000
BnCl concentration / (10-4mol L-1)
∆
F
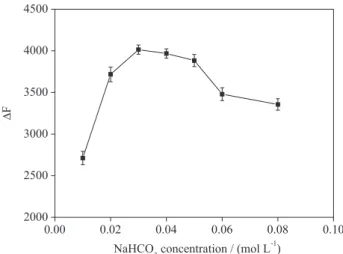
by the ·NH2 group from ammonium. The effect of sodium
bicarbonate concentration was researched in the range from 0.01 to 0.08 mol L−1, and the results are shown in
Figure 3. It was observed that the fluorescence intensity of the reacted solutions increased with increasing sodium bicarbonate concentration, and reached a maximum at 0.03 mol L−1 NaHCO
3. It shows that sodium bicarbonate
in the experiment could promote the chemical reaction, and the fluorescence intensity of the corresponding product increased with the increase of sodium bicarbonate. However, the excess sodium bicarbonate might lead to the pH value of the reacted solution too high, which affected the determination of the fluorescence intensity. When the NaHCO3 concentration was over 0.05 mol L−1,
the fluorescence intensity of reacted solutions began to decline rapidly. Therefore, the optimal sodium bicarbonate concentration in the present study was 0.03 mol L−1, which
was realized by adding 1.5 mL of 0.5 mol L−1 NaHCO
3
solution to a 25 mL flask.
The reaction temperature is an important factor in a chemical reaction. The effect of reaction temperature on the fluorescence intensity of reacted solutions was investigated in the range from 15 to 40 °C, and the results are shown in Figure 4. The ·Cl group was difficult to be replaced by the ·NH2 group when the reaction temperature was below
15 °C, so the fluorescence intensity of the reacted solution was very weak. The fluorescence intensity increased gradually with the increase of reaction temperature from 20 °C, and stabilized at over 30 °C. BnCl is an active agent
and can react with amidocyanogen at low temperature,35
which is conducive to saving energy in the process of determination of ammonium nitrogen. When the reaction temperature was above 45 °C, the fluorescence signal became unstable because some other reactions might occur
under high temperature. Thus, 35 °C was chosen as the optimal reaction temperature in the present study.
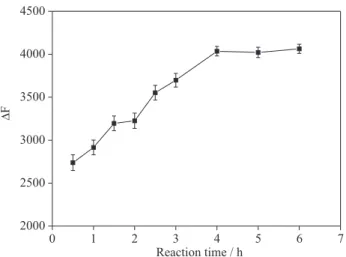
It takes a period of time for the ·NH2 group to replace
the ·Cl group in BnCl. The effect of reaction time (t) was also examined in the present study, and the results are shown in Figure 5. With the extension of reaction time, more and more ·Cl groups were broken from benzyl and the fluorescence intensity of the reacted solution became more and more strong. After reaction time was prolonged to over 4 h, the fluorescence intensity remained stable. Figure 5 also showed that the (∆F − t) curve was linear in the range from 0.5 to 4 h. The linear relationship can be described as follow:
∆F = 2564 + 374.5t (h) (1)
The regression coefficient of equation 1 is 0.9932. Therefore, the appropriate time by which to conduct the experiments in the present study is 4 h. The apparent reaction rate constant is k = ∆F / t = 6.17 min−1.
The pH value of solution is one of the important factors that influence the fluorescence intensity of the fluorescent substances.36 The addition of sodium bicarbonate played
two roles in the system. On the one hand, it promoted the substitution reaction of the ·Cl group under alkaline conditions, on the other hand, high pH value of the reacted solution affected the determination of the fluorescence intensity of reaction products. Therefore, after the completion of the chemical reaction between ·Cl and ·NH2
groups, hydrochloric acid was added to adjust the solution pH, which was good for determination of the fluorescence intensity. The effect of hydrochloric acid concentration on the fluorescence intensity of reacted solutions was investigated in the range from 0 to 1.6 × 10⁻³ mol L−1,
and the results are shown in Figure 6. The acidity and
0.00 0.02 0.04 0.06 0.08 0.10
2000 2500 3000 3500 4000 4500
NaHCO3concentration / (mol L-1)
∆
F
Figure 3. Effect of NaHCO3 concentration on fluorescence intensity of
the reacted solution.
10 15 20 25 30 35 40 45 50 1500
2000 2500 3000 3500 4000 4500
Temperature /oC
∆
F
alkalinity of solutions had a great effect on the fluorescence determination. Either strong acidic solutions or alkaline solutions were not conducive to the determination of the fluorescence intensity in the system. The fluorescence intensity reached a maximum at 0.8 × 10⁻³ mol L−1 HCl.
Therefore, the optimal hydrochloric acid concentration in the present study was 0.8 × 10⁻³ mol L−1, which was
realized by adding 2.0 mL of 0.01 mol L−1 HCl solution
to a 25 mL flask.
The stability of the reacted solution is also an index to evaluate an analysis method. After the completion of chemical reactions, the reacted solution was cooled to room temperature and stored for a long time, and, at the same time, the fluorescence intensity of the same reacted solution was determined at different storage time, respectively. The relationship between the fluorescence intensity and the storage time is shown in Figure 7. After chemical reactions accomplished for 10 min, the fluorescence intensity was
low and unstable, which was because the temperature of the reacted solution could not be stably cooled to room temperature in such a short time. The fluorescence intensity tended to be stable after the reacted solution was stored for half an hour. Even if the solution was stored for 20 h, the fluorescence intensity still reached 3939, which was only 2.1% lower than that stored for 1 h. Therefore, the system of this method was stable, and ammonium nitrogen concentration could be accurately determined using the present method after the solution cooled to room temperature.
Analytical characteristics
Under optimal conditions, the calibration curve for ammonium nitrogen was obtained by plotting the fluorescence signal vs. ammonium nitrogen concentration,
as shown in Figure 8 inset, which gave a linear range from 0.01 to 0.60 mg L−1. The regression equation was:
∆F = 9856.9C + 20.6 (2)
where C represented the NH4+-N concentration (mg L−1),
and the correlation coefficient of equation 2 was 0.9989. The detection limit was 0.008 mg L−1, calculated as the
amount of ammonium nitrogen required to a net peak three times the standard deviation of the blank signal (3σ). The relative standard deviation for eleven repetitive determinations of 0.40 mg L−1 NH
4+-N was 2.6%, showing
a good reproducibility.
Selectivity
To study the selectivity of the proposed method, the effect of a series of foreign substances on the determination
0 1 2 3 4 5 6 7 2000
2500 3000 3500 4000 4500
Reaction time / h
∆
F
Figure 5. Effect of reaction time on fluorescence intensity of the reacted solution.
0 5 10 15 20 25 2500
3000 3500 4000 4500
Storage time / h
∆
F
Figure 7. Effect of storage time on fluorescence intensity of the reacted solution.
0.0 0.2 0.4 0.6 0.8 1.0 1.2 1.4 1.6 1.8 2000
2500 3000 3500 4000 4500
HCl concentration / (10-3mol L-1)
∆
F
of 0.40 mg L−1 NH
4+-N was tested under optimal
conditions. Some substances commonly existing in water, and some other substances that usually interfere with the spectrophotometry method, were chosen for the selectivity test. When the effect of each foreign species on the peak height is less than 10.0%, the species is assumed not to interfere in the determination of ammonium nitrogen with the proposed method. The results of selectivity testing are summarized in Table 1. The proposed method has a good anti-interference capability.
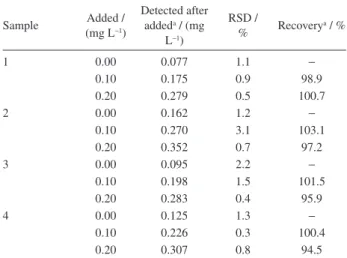
Application
The proposed method was applied to determine NH4+-N
in different water samples, and its accuracy was verified by recovery studies within the range of linearity. Samples 1 and 2 were simulated water samples with different concentrations, which were made from ammonium nitrogen stock solution. Samples 3 and 4 were treated and untreated wastewater obtained from the sewage treatment plant in Changzhou city, respectively. Samples with high concentrations were diluted appropriately with water prior to measurement so that the NH4+-N concentration was in
its linear response range. The analysis results are presented in Table 2. The experimental recoveries of 94.5 to 103.1% indicate that no serious interference was found in the samples. Hence, the proposed method can be satisfactorily used for the determination of ammonium nitrogen in real samples.
Proposed reaction mechanism
Proof of the reaction taking place between BnCl and ammonium ion was provided by the FTIR spectra shown in Figure 9. In the spectrum (Figure 9a), the main peak positions (cm−1) was found at 3031.51, 1495.67, 1454.15,
932.98, 765.40, 696.53 and 558.48, in which the weak
band at 3031.51 corresponded to the =C−H stretching
modes and the strong band at 558.48 corresponded to the
C−Cl stretching mode. The changes in Figure 9b proved
that the ·Cl group in BnCl had reacted with ammonium ion in alkaline solution and been replaced by ·NH2. The N−H
stretching vibration produced a strong band at 3239.66,
which covered the bond at 3031.51 produced by =C−H in
benzene ring. The strong bond at 1634.02 corresponded to the N−H bending vibration. Compared with Figure 9a, a new strong bond was produced at 1108.69, which was attributed to the C−N stretching vibration. Therefore, the proposed method might take place the following reaction (Scheme 1).
Conclusions
A highly sensitive and selective determination of ammonium nitrogen was performed using fluorometric derivatization with BnCl. The new method has been successfully applied to the analysis of trace amounts
270 280 290 300 310 320 330 340 350
0 1000 2000 3000 4000 5000 6000
0.0 0.1 0.2 0.3 0.4 0.5 0.6 0 1000 2000 3000 4000 5000 6000 ∆ F
Wavelength / nm
∆
F
NH4+ -N / (mg L-1
)
Figure 8. Typical fluorescence signals of ammonium nitrogen. Concentrations of samples were 0.01, 0.02, 0.04, 0.08, 0.12, 0.16, 0.20, 0.30, 0.40, 0.50 and 0.60 mg L−1. Inset: plots of fluorescence intensity vs. ammonium nitrogen concentration.
Table 1. Effects of foreign substances on the determination of 0.40 mg L−1
NH4+-N
Foreign substance Maximum tolerable
ratioa
Na+, K+, Ca2+, Mg2+, Zn2+, Cd2+, Cl−, F−, SO
42−,
formaldehyde, ethanol NO3−, acetone
Cu2+, Fe2+
1000 1000 200 100
a1000 is the highest ratio tested.
Table 2. Determination of NH4+-N in different water samples
Sample Added / (mg L−1)
Detected after addeda / (mg
L−1)
RSD /
% Recoverya / %
1 2 3 4 0.00 0.10 0.20 0.00 0.10 0.20 0.00 0.10 0.20 0.00 0.10 0.20 0.077 0.175 0.279 0.162 0.270 0.352 0.095 0.198 0.283 0.125 0.226 0.307 1.1 0.9 0.5 1.2 3.1 0.7 2.2 1.5 0.4 1.3 0.3 0.8 − 98.9 100.7 − 103.1 97.2 − 101.5 95.9 − 100.4 94.5
of ammonium nitrogen in different water samples. The proposed method is simple and inexpensive, thus, easier to popularize.
Acknowledgments
This research was supported by Jiangsu Province Key Laboratory of Environmental Engineering (KF2014010).
References
1. Camargo, J. A.; Alonso, Á.; Environ. Int. 2006, 32, 831.
2. Molins-Legua, C.; Meseguer-Lloret, S.; Moliner-Martinez, Y.; Campins-Falco, P.; Trends Anal. Chem. 2006, 25, 282.
3. Xue, S. H.; Uchiyama, K.; Li, H.; J. Environ. Sci. 2012, 24, 564.
4. Deb, M. K.; Verma, D.; Microchim. Acta2010, 169, 23.
5. Dolgonosov, A. M.; Krachak, A. N.; J. Chromatogr. A1993,
640, 351.
6. Ortiz-Santaliestra, M. E.; Marco, A.; Fernández-Benéitez, M. J.; Lizana, M.; Aquat. Toxicol. 2007, 85, 251.
7. Fukushi, K.; Ito, H.; Kimura, K.; Yokota, K.; Saito, K.; Chayama, K.; Takeda, S.; Wakida, S.; J. Chromatogr. A2006,
1106, 61.
8. Kurama, H.; Poetzschke, J.; Haseneder, R.; Water Res. 2002,
36, 2905.
9. Drolc, A.; Roš, M.; Cotman, M.; Anal. Bioanal. Chem. 2004,
378, 1243.
10. Gaucheron, F.; Graet, Y. L.; J. Chromatogr. A2000, 893, 133.
11. Wu, Y. H.; Fei, J. J.; Dang, X. P.; Hu, S. S.; Wuhan Univ. J. Nat.
Sci. 2004, 9, 366.
12. López-Pasquali, C. E.; Fernández-Hernando, P.; Durand-Alegría, J. S.; Anal. Chim. Acta2007, 600, 177.
13. Caballo-López, A.; Luque-de-Castro, M. D.; Anal. Chem. 2006,
78, 2297.
14. Barsotti, R. J.; J. Pediatr. 2001, 138, 11.
15. Meseguer-Lloret, S.; Molins-Legua, C.; Campins-Falco, P.; Int. J. Environ. Anal. Chem. 2002, 82, 475.
16. Hall, A.; Appl. Geochem. 1993, 8, 101.
17. Stenholm, Å.; Eriksson, E.; Lind, O.; Wigilius, B.; Int. J.
Environ. Anal. Chem. 2008, 88, 165.
18. Aminot, A.; Kirkwood, D. S.; Kérouel, R.; Mar. Chem. 1997,
56, 59.
19. Parham, H.; Mobarakzadeh, M.; J. Anal. Chem. 2003, 58, 514. 20. Qin, W.; Zhang, Z. J.; Li, B. X.; Peng, Y. Y.; Talanta1999, 48,
225.
21. Cao, G. P.; Chen, T.; Zhuang, Y. F.; J. Fluoresc. 2013, 23, 641.
22. Almendral-Parra, M. J.; Alonso-Mateos, Á.; Fuentes-Prieto, M. S.; J. Fluoresc. 2010, 20, 55.
23. Poulin, P.; Pelletier, É.; Talanta2007, 71, 1500.
24. Watson, R. J.; Butler, E. C. V.; Clemintson, L. A.; Berry, K. M.;
J. Environ. Monit.2005, 7, 37.
25. Jacobson, S. C.; Hergenroder, R.; Moore Jr, A. W.; Ramsey, J. M.; Anal. Chem. 1994, 66, 4127.
26. Rapsomanikis, S.; Wake, M.; Kitto, A. M. N.; Harrison, R. M.;
Environ. Sci. Technol. 1988, 22, 948.
27. Lloret, S. M.; Andrés, J. V.; Legua, C. M.; Falcó, P. C.; Talanta
2005, 65, 869.
28. Kuo, C. T.; Wang, P. Y.; Wu, C. H.; J. Chromatogr. A2005,
1085, 91.
29. Mori, M.; Tanala, K.; Helaleh, M. I. H.; Xu, Q.; Ikedo, M.; Ogura, Y.; J. Chromatogr. A 2003, 977, 191.
30. Gibb, S. W.; Mantoura, R. F.; Liss, P. S.; Anal. Chim. Acta 1995,
316, 291.
31. Li, Q. P.; Zhang, J. Z.; Millero, F. J.; Hansell, D. A.; Mar. Chem.
2005, 96, 73.
32. Prieto-Blanco, M. C.; López-Mahía, P.; Prada-Rodríguez, D.;
J. Chromatogr. Sci.2009, 47, 121.
4000 3500 3000 2500 2000 1500 1000 500
20 40 60 80 100
558.48
696.53 765.40 932.98
1454.15 1495.67 3031.51
(a)
Wavenumbers / cm-1
4000 3500 3000 2500 2000 1500 1000 500
0 20 40 60 80 100
534.00 900.64
1108.69 1338.40
1634.02
3239.66
(b)
T
ra
n
sm
it
ta
n
c
e
/
%
T
ra
n
sm
it
ta
n
c
e
/
%
Wavenumbers / cm-1
Figure 9. FTIR spectrum of (a) BnCl and (b) benzylamine produced from the reaction of BnCl and ammonium ion.
CH2Cl + NH4Cl NaHCO3 CH2NH2+ 2HCl
33. Fall, M.; Haddouk, H.; Morin, J. P.; Forster, R.; Mutat. Res., Genet. Toxicol. Environ. Mutagen.2007, 633, 13.
34. Fontanesi, C.; Baraldi, P.; Marcaccio, M.; J. Mol. Struct.: THEOCHEM 2001, 548, 13.
35. Bachari, K.; Cherifi, O.; J. Mol. Catal. A: Chem. 2006, 253, 187.
36. Kargosha, K.; Maleki, M. S.; Azad, J.; J. Fluoresc. 2014, 24, 855.
Submitted: September 5, 2015