Intergenomic Comparisons Highlight
Modularity of the Denitrification Pathway
and Underpin the Importance of
Community Structure for N
2
O Emissions
Daniel R. H. Graf, Christopher M. Jones, Sara Hallin*
Department of Microbiology, Swedish University of Agricultural Sciences, Uppsala, Sweden
Abstract
Nitrous oxide (N2O) is a potent greenhouse gas and the predominant ozone depleting substance. The only enzyme known to reduce N2O is the nitrous oxide reductase, encoded by thenosZgene, which is present among bacteria and archaea capable of either complete denitrification or only N2O reduction to di-nitrogen gas. To determine whether the occurrence ofnosZ, being a proxy for the trait N2O reduction, differed among taxonomic groups, preferred habitats or organisms having either NirK or NirS nitrite reductases encoded by thenirKandnirSgenes, respectively, 652 microbial genomes across 18 phyla were compared. Furthermore, the association of different co-occurrence patterns with enzymes reducing nitric oxide to N2O encoded bynorgenes was examined. We observed that co-occurrence patterns of
denitrification genes were not randomly distributed across taxa, as specific patterns were found to be more dominant or absent than expected within different taxonomic groups. ThenosZgene had a significantly higher frequency of co-occurrence with
nirSthan withnirK andthe presence or absence of anorgene largely explained this pattern, asnirSalmost always co-occurred withnor. This suggests thatnirStype denitrifiers are more likely to be capable of complete denitrification and thus contribute less to N2O emissions thannirKtype denitrifiers under favorable environmental conditions.Comparative phylogenetic analysis indicated a greater degree of shared evolutionary history betweennosZandnirS.However 30% of the organisms with
nosZdid not possess eithernirgene, with several of these also lackingnor, suggesting a potentially important role in N2O reduction. Co-occurrence patterns were also non-randomly distributed amongst preferred habitat categories, with several habitats showing significant differences in the frequencies ofnirSandnirK
type denitrifiers. These results demonstrate that the denitrification pathway is highly modular, thus underpinning the importance of community structure for N2O emissions. OPEN ACCESS
Citation:Graf DRH, Jones CM, Hallin S (2014) Intergenomic Comparisons Highlight Modularity of the Denitrification Pathway and Underpin the Importance of Community Structure for N2O Emissions. PLoS ONE 9(12): e114118. doi:10.1371/journal.pone.0114118
Editor:Valerie de Cre´cy-Lagard, University of Florida, United States of America
Received:August 21, 2014
Accepted:November 5, 2014
Published:December 1, 2014
Copyright:ß2014 Graf et al. This is an open-access article distributed under the terms of the
Creative Commons Attribution License, which permits unrestricted use, distribution, and repro-duction in any medium, provided the original author and source are credited.
Data Availability:The authors confirm that all data underlying the findings are fully available without restriction. All data are available from the NCBI database (www.ncbi.nlm.nih.gov/) as indicated by the taxon ID number and genome project name presented within the paper and its Supporting Information files.
Funding:This work was supported by the Oscar and Lili Lamm foundation (www.stiftelsenlamm.a. se/) through a grant (contract 2010-11-13) to SH, strategic funding from the Faculty of Natural Resources and Agricultural Sciences at the Swedish University of Agricultural Sciences to SH, and a research grant (contract 2011-4421) from the Swedish Research Council (www.vr.se) to SH. The funders had no role in study design, data collection and analysis, decision to publish, or preparation of the manuscript.
Introduction
Managing nitrogen (N) is one of the major environmental challenges for the 21st century [1,2]. Of special concern is the mitigation of nitrous oxide (N2O) due to
its status as a potent greenhouse gas and the predominant ozone depleting compound [3,4]. While there are multiple sources of atmospheric N2O, the
majority is produced by microbial transformations of reactive N in fertilized agricultural soil [5–7].
The only known sink for N2O in Earth’s troposphere is microbial reduction to
di-nitrogen (N2), catalyzed by the N2O reductase encoded by the nosZgene. This
unique enzyme is found among a wide range of bacterial and archaeal taxa capable of complete denitrification, an anaerobic respiratory process in which soluble nitrate (NO32) or nitrite (NO22) is reduced to the gases nitric oxide (NO), N2O
and N2via a series of enzymatic steps. It has been suggested that denitrification is
a modular pathway, in that an organism may not always possess the full set of enzymes and thus perform only a subset of steps within the pathway [8]. Bacteria carryingnosZgenes that reduce N2O to N2yet lack the other denitrification genes
have been described [9–12], and have recently been shown to be potentially
important consumers of N2O produced by denitrification or other N-cycling
processes [13]. On the other hand, denitrifiers can also lack the nosZ gene [14],
and thus produce N2O as a terminal product. It was recently shown that
manipulation of the proportion of denitrifiers with the nosZ gene in soil
microcosms significantly affected the ratio of N2O:N2 production, establishing a
causal link between denitrifier community composition and potential N2O
emissions [15]. Thus, the regulation of N2O emissions ultimately has a genetic
basis.
Whether the genetic potential to produce or reduce N2O is more conserved
among specific microbial taxa or functional groups of denitrifiers implies that the composition of the microbial community is not trivial from an ecosystem perspective, however this is not known. Denitrifiers can be divided into two functional groups based on whether they possess the copper binding dissimilatory nitrite reductase (NirK) or the cytochrome cd1 variant (NirS) that catalyze the
reduction of NO22to NO; the key reaction that defines denitrification [8,16].
While the two enzymes perform the same function in the denitrification pathway, they are non-homologous and were thought to be mutually exclusive in the genomes of denitrifying organisms [14]. Several studies have shown that communities of denitrifiers with NirK respond differently to environmental gradients than those with NirS [17–21], which supports the hypothesis that the two communities occupy different ecological niches [22]. Thus, nosZ co-occurrence patterns in relation to denitrifying organisms with one or the other type of nitrite reductase can provide additional insight on the importance of denitrifier community composition for N2O reduction in different ecosystems.
To understand the ecological implications of whether NO22 reduction is
performed by NirK or NirS denitrifiers, the link to the enzymatic step reducing
of different enzymes that vary in structure and evolutionary relationships, including periplasmic associated flavodiiron, flavorubredoxin, and cytochrome-c type proteins, as well as several variants of the membrane-bound heme-copper oxidases [23]. Whereas the periplasmic enzymes are generally associated with response to nitrosative stress [23,24], respiratory NO reduction to N2O in the
denitrification pathway is performed by two variants of the heme-copper oxidase type NO reductases in bacterial and archaeal denitrifiers, encoded by the cnorBor
qnorB genes [25]. Homologs of the qnorBgene have also been observed in non-denitrifying pathogenic species as well as anaerobic non-denitrifying methanotrophs, and are believed to be involved in detoxification [26] and dismutation of NO to N2and O2[27], respectively. In fungal denitrifiers, NO reduction is performed by
the P450-type nitric oxide reductase (P450nor), however this enzyme is not
considered to be involved in energy conservation [28]. Regardless of the cellular
role of each enzyme, total N2O production from a given ecosystem could be
considered a sum of the activities of each N2O-genic NO reductase, although the
contribution ofqnorB andcnorBlikely outweighs that of other Nor-types due to
their prominent role in anaerobic respiration [24].
The aim of our study was to determine whether patterns of co-occurrence of
nosZ, being a proxy for the trait N2O reduction, differed among nirK andnirS
type denitrifiers, how this relates to taxonomic affiliation, and whether these
patterns could be explained by the presence of a norgene encoding one of the
canonical NO reductases or the p450nor variant for fungal denitrifiers. This was
investigated by examining the distribution of the genesnirK,nirS, norandnosZin 652 publicly available microbial genomes across 18 phyla. The increasing number
of genomes from organisms found in a diverse range of environments [29] also
allowed for an assessment of the modularity of the denitrification pathway in relation to preferred habitat. Furthermore, we examined how conserved the trait of N2O reduction is from an evolutionary perspective.
Materials and Methods
Data acquisition
A local database was constructed by downloading all 4135 draft and completed microbial genome nucleotide sequences available (November 2012) at the
National Center for Biology Information (NCBI, www.ncbi.nlm.nih.gov). To
ensure that homology searches were as comprehensive as possible, a two-step procedure was performed for each gene. First, an initial TBLASTN search [30] of
the online NCBI microbial genomes database (www.ncbi.nlm.nih.gov/sutils/
genom_table.cgi) was performed using translated nirS, nirK, and nosZ gene
sequences from either Paracoccus denitrificans PD1222 or Bradyrhizobium
japonicumUSDA110 as queries. Resulting hits were then translated to amino acid sequences and aligned using SATE´ v2.2.3 [31] with MAFFT [32] as aligner,
MUSCLE as merger and RAxML [33] as the tree estimator. Gene identity of the
relation to characterized homologs, with emphasis on conserved positions crucial for protein functioning and phylogenetic inference (see below). The resulting
amino acid alignments of nirK, nirS andnosZ, with 477, 150 and 282 sequences,
respectively, were then used to create Position Specific Score Matrices (PSSM)
[34] for conducting a more comprehensive PSI-TBLASTN search of the
downloaded database. Truncated sequences and sequences with stop codons were excluded, and redundancy in the data set was reduced by eliminating different strains of the same species with identical nirK, nirSand nosZ amino acid sequences. Strains with identical sequences were kept when a unique
co-occurrence pattern of denitrification genes was observed, or when the sequence of another denitrification gene was not identical, resulting in a dataset of 652 organisms (see Table S1 for species name, NCBI taxon ID, project name). We then searched the final set of genomes for homologues of theqnorBandcnorBvariants of the NO-reductase. This was performed in a similar manner as described for the
nir and nosgenes, with the exception that the PSSM was generated by
downloading the 10 most diverse representative cNorB and qNorB amino acid
sequences from the NCBI conserved domains database (http://www.ncbi.nlm.nih.
gov/Structure/cdd/cdd.shtml) to allow for an equal representation of both variants within the initial PSSM. For the eukaryotic species, the amino acid sequence for the P450nor from Fusarium oxysporum [35] was used as a query for
TBLASTN searches of each fungal genome, and the resulting hits were aligned to the query sequence to both correctly identify P450nor based on previously
described conserved amino acid positions [28], as well as to aid in assembly of exons.
Small subunit (SSU) rRNA gene sequences corresponding to the organisms were retrieved from the local genome database using Infernal [36]. In cases where there was more than one SSU rRNA gene sequence in a genome, the longest sequence was chosen. Taxonomic assignment was based on NCBI classification, which was verified by classification of SSU sequences using the SILVA database [37]. In addition, habitat and isolation source was either downloaded from the
Genomes online database (GOLD, 2012 November 15, www.genomesonline.org/)
[29] or searched for in NCBI using the taxon ID of the respective genome and
looking at connected publications when available.
Phylogenetic tree reconstruction
Preliminary amino acid alignments of full-length gene sequences of nirK, nirS, norB, nosZ, and P450nor were created using the MUSCLE alignment algorithm
[38] in the Geneious bioinformatics software suite (version 5.6.1, Biomatters, Auckland, New Zealand) with default settings. With these alignments as input, the most suitable substitution models were inferred by ProtTest v3.2 [39], those being LG+C for nirK andnosZ, LG+C+F for norBand nirS[40], and WAG+C+F for
P450nor. Subsequently, new alignments were inferred using SATE´, and after
best likelihood topology, followed by bootstrap analysis with 250 replicates. Small
subunit rRNA sequences were aligned using SINA [41]. After manual
improvement of the resulting alignment, the phylogeny was determined using 50 tree searches in RAxML with GTRCAT as the nucleotide substitution model followed by 500 bootstrap replicates. All trees were displayed and annotated using the Interactive Tree of Life (iTOL) online tool [42].
Phylogenetic distribution and conservation of nosZ among
nirK-and nirS denitrifiers
To compare the phylogenetic pattern of N2O reduction between denitrifiers with nirKandnirS, thenosZ gene was used as a proxy for the capacity of an organism
to reduce N2O and mapped onto the corresponding taxa within thenirKandnirS
phylogenies. Quantification of the phylogenetic patterns of nosZ distribution for
both genes was performed using Fritz and Purvis’ [43] measure of phylogenetic
signal strength (D), implemented in the ‘caper’ package within the R statistical programming environment (R foundation for statistical computing, Vienna, Austria). This statistic measures whether a trait is highly clumped (D,0), displays
clumping patterns due to Brownian evolutionary processes (D,0) or random
distribution patterns (D51), or is highly over-dispersed (D.1) across a given phylogeny. In order to also determine the degree to which the ability to reduce N2O is conserved amongst nirK and nirSdenitrifiers, we used the phylogenetic
metric ConsenTRAIT [44] to calculate trait depths (tD) ofnosZas a trait onnirK
andnirSgene trees in the R environment. Trait depth is a measure of the average distance between organisms exhibiting the trait and their last common ancestor, such that increasing values of tD indicate more conserved traits.
Gene co-occurrence patterns in relation to taxa and habitat
The genomic co-occurrence patterns ofnirK,nirS, norandnosZwere investigated in relation to taxonomic affiliation based on the 16S rRNA gene phylogeny at different taxonomic ranks. In order to determine whether the co-occurrence
patterns ofnirandnosgenes were randomly distributed among taxa, contingency
tables of co-occurrence patterns by taxonomic affiliation at the phylum, class, order and family was performed, followed by Chi-squared goodness of fit tests in the R environment. Lower taxonomic ranks were not examined due to low frequencies (,5) in the majority of cells. In addition, the standardized residuals of the resulting cell values were examined to distinguish taxa that differed
significantly from the expected values for each pattern of co-occurrence, and presented as a mosaic plot generated in the R environment using the ‘vcd’
package. For each possible combination of nosZ andnir genes, the fraction
harboring a nor gene was determined.
The co-occurrence patterns of nirK,nirS and nosZ were also correlated with available information on the organism’s lifestyle as determined by habitat
was determined. Information on habitat preference could be retrieved for 626 organisms that were grouped into eight general habitat categories: wastewater treatment plants, extremophilic, marine systems, fresh water systems, soil, plant, animal, and food associated organisms, and those found in multiple habitats. Here, extremophilic represents habitats for thermo-, psychro-, halo-, acido- and alkalophiles as well as oil degrading, radiation resistant and arsenic resistant organisms. The plant and animal associated organisms are specified as being directly associated to a plant or animal host, whereas food associated are those used in food production. Organisms isolated from multiple sources without any specific preferences were lumped into the ‘multiple habitats’ category. The different categories of lifestyle versus the gene occurrence patterns were tested in the same way as for taxa affiliation.
Results
Genomic nirK, nirS, nor and nosZ co-occurrences
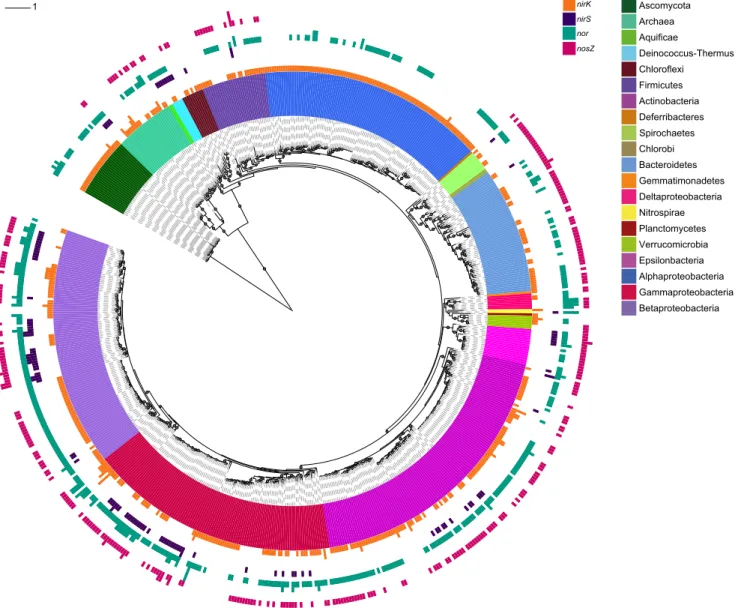
In total, 652 organisms from all three domains of life were found to harbor denitrification genes (Fig. 1; for greater detail see Fig. S1 and Table S1). Of these,
458 and 110 possessed a nirKor nirS homolog, respectively, including ten
genomes that harbored both nirgenes. As stated earlier, we limited our search of
NO-reductases to the cnorBand qnorB variants encoding NorB found in the
canonical denitrification pathway, as well as the p450nor variant for fungal
denitrifiers. This resulted in a total of 431 organisms with anorgene, whereas 314 genomes were found to possess a nosZgene. Interestingly, a large part of thenirK
organisms (35%) had a truncated pathway lacking a canonicalnorand a majority
(70%) did not have nosZ. By contrast, only 3.6% of the nirS-type denitrifiers
lacked norand 20% did not have a nosZ gene. Of all organisms harboring nosZ,
30% did not possess any nirgenes and about 24% did not have nor. In general,
genomes containing both nosZ andnor also had anir gene, whereas organisms
with nosZ that did not have a norgene also lacked a nirgene (Fig. 2a and d). It was recently established that the N2O reductase can be divided into two
phylogenetic clades (I and II; Fig. S5), with clade II being a previously
unaccounted, yet environmentally abundant lineage [45,46]. Of the genomes with
nosZ, 187 and 113 harbored lineages from clade I and II, respectively and 89 and
56% of these also had a norgene. Among those with nor, organisms that also
possessed nirK dominated in clade I, whereas in clade II the co-occurrence
patterns were evenly distributed (Fig. 2b and c, respectively). By contrast,nosZ -harboring genomes lacking nor most often also lacked nirgenes (Fig. 2d–f).
Analysis of denitrification gene phylogeny and nosZ conservation
S2–S5). Similar to previous reports, thenirKphylogeny (Fig. S2) could be divided into two major clusters [47], each consisting of sequences from a highly diverse
range of phyla with no clear correspondence with organismal phylogeny [14].
While the occurrence of organisms with nosZ was dispersed throughout the
overall nirKphylogeny, the Group 1 cluster had a noticeably higher number of
organisms withnosZthan the Group 2 cluster, which was dominated by sequences
from genomes that lack the nosZ gene. Similarly, nirKfrom the eukaryotic
genomes formed a well-supported monophyletic clade that also corresponded
with the lack of nosZ genes. This pattern of a more clumped occurrence ofnosZ
Figure 1. Maximum likelihood phylogeny of full-length 16S/18S rRNA sequences from 652 organisms with denitrification genes.The inner colored ring represents taxonomic affiliation as indicated by the legend. The four outer bar-chart rings show the presence ofnirK(orange),nirS(purple),nor
(turquoise) andnosZ(magenta). Bar height represents the number of copies (#4). Bootstrap values.70% are indicated by grey circles, and the scale bar denotes nucleotide substitution rate (GTR+C). Classification is based on the SILVA database with denomination according to NCBI taxonomy. For NCBI taxon ID number and project name, see Table S1.
across the nirKphylogeny was confirmed by the calculated phylogenetic signal strength (D) of 0.335, which indicates a moderately clumped distribution that was significantly different from both random (p,0.001) and Brownian distributions (p50.002) of phylogenetic trait patterns.
ThenorBphylogeny could be clearly divided into cnorB and qnorBvariants,
with a diverse range of bacterial and archaeal phyla found within each clade (Fig.
S4). However, a greater proportion of organisms with nirSwere found within the
cnorBclade, whereas those withnirKandnosZwere dispersed more equally across both clades.
In contrast tonirKand norB, the nirSand nosZ phylogenies (Figs. S2 and S3) were more congruent to taxonomic affiliation on the phylum level, with some
exceptions observed within each tree. While the few nirSgenomes lacking nosZ
appeared to be randomly distributed throughout the nirSphylogeny, sequences
from genomes lacking nosZ within the phyla Deinococcus-Thermus and
Chloroflexi each formed monophyletic clades within thenirSphylogeny. This was
reflected in the resulting phylogenetic signal strength (D50.431) that was also
significantly non-random (p,0.001) and did not correspond to a Brownian
process (p50.02), yet was slightly less clumped than the pattern of nosZ
distribution observed for the nirK phylogeny. Additional analysis using the
ConsenTRAIT metric (tD), performed usingnosZ occurrence as a proxy for the
trait N2O reduction on both the nirS and nirKphylogenies, indicated a higher
Figure 2. Co-occurrence ofnosZwithnirKornirSin genomes with and withoutnorgenes.Percentage of genomes with onlynosZ(black),nosZandnirK(dark grey) andnosZandnirS(light grey) among organisms a) harboringnosZandnor, b) withinnosZClade I withnor, c) withinnosZClade II withnor, d) harboringnosZ
withoutnor, e) withinnosZClade I withoutnor, and f) withinnosZClade II withoutnor. Six genomes that have bothnirSandnirKin addition tonosZare excluded as well as eight halophilic Archaea that group outside Clade I and II in b) and c).
degree of evolutionary conservation of nosZ withnirS (tD50.089) thannirK
(tD50.043).
Gene co-occurrence patterns in relation to taxa
The SSU tree showing the distribution ofnir, norandnosgenes (Fig. 1) indicated that patterns of gene co-occurrence were not randomly distributed across different taxonomic groups. Chi-squared tests of taxonomy-based contingency tables confirmed that the patterns nirK only (K-type), nirK+nosZ (KZ-type),
nirK+nirS(KS-type), nirK+nirS+nosZ (KSZ-type),nirS only (S-type), nirS+nosZ
(SZ-type) and onlynosZ(Z-type) were indeed not randomly distributed amongst
groupings at either the phylum, class, or order levels (P,0.001; Tables 1, S2 and S3). Calculation of standardized x2 residuals highlighted several taxonomic groups that significantly contributed to the resulting chi-squared values. Within the largest represented phylum, the proteobacteria, nearly half of all organisms
had a complete denitrification pathway including nir, nor andnosZ and the
majority hadnirandnor(Table 1). The K and KZ patterns dominated among the
Alphaproteobacteria, largely due to the overrepresentation of these patterns within the order Rhizobiales (Table S3). However, the negative x2 residual values
Table 1.Frequency table ofnirK(K),nirS(S) andnosZ(Z) co-occurrence types and taxonomic affiliation at phylum level as well as the percentage of organisms within each phylum that also harbor anorgene.
Phylum K %nor KS %nor KSZ %nor KZ %nor S %nor SZ %nor Z %nor
Actinobacteria 102q 42 0 - 0 - 0Q - 0 - 0Q - 0Q
-Aquificae 0 - 0 - 0 - 0 - 0 - 2q 100 0
-Ascomycota 27q 67 0 - 0 - 0Q - 0 - 0 - 0Q
-Bacteroidetes 8Q 100 0 - 1 0 24q 67 0 - 0Q - 24q 17
Chlorobi 0 - 0 - 0 - 0 - 0 - 0 - 2q 0
Chloroflexi 5 0 0 - 0 - 1 0 2q 0 0 - 2 0
Crenarchaeota 0 - 0 - 0 - 0 - 2q 100 2q 100 0
-Deferribacteres 0 - 0 - 0 - 0 - 0 - 0 - 1q 0
Deinococcus-Thermus 0Q - 2q 100 0 - 0 - 3q 100 0 - 0
-Euryarchaeota 5 60 0 - 0 - 4 100 0 - 0 - 5q 0
Firmicutes 16 25 0 - 0 - 4 100 0 - 1 100 8q 12
Gemmatimonadetes 0 - 0 - 0 - 1 0 0 - 0 - 0
Nitrospirae 1 0 0 - 0 - 0 - 1q 100 0 - 0
Planctomycetes 1 0 0 - 0 - 0 - 0 - 0 - 0
Proteobacteria 135Q 66 2 100 5 100 96q 96 12 92 74q 99 47 51
Spirochaetes 2 50 0 - 0 - 3 33 0 - 1 100 3 67
Thaumarchaeota 9q 0 0 - 0 - 0 - 0 - 0 - 0
-Verrucomicrobia 3 67 0 - 0 - 1 0 0 - 0 - 2 0
Residuals are according to Pearson Chi-squared test (P,0.001).
qCombinations with Pearson residuals.2. QCombinations with Pearson residuals,22.
observed for the abundance of K-only patterns indicates that proteobacteria in general are less likely to have a partial pathway, particularly Beta- and
Gammaproteobacteria (Tables 1 and S2). This is further supported by the
abundances of SZ and KZ patterns, which were higher than expected by chance within the proteobacteria, as well as the high percentage of organisms harboring
nor genes for each pattern. The SZ pattern was twice as frequent as the KZ or Z
patterns among the Gammaproteobacteria, which could be attributed to the Pseudomonadales. Within the Betaproteobacteria, the SZ- and KZ-types were equally represented, while Z-types were significantly underrepresented. SZ-type organisms within the Betaproteobacteria were mainly represented by the orders Burkholderiales and Rhodocyclales, whereas the KZ-type Betaproteobacteria were in turn primarily associated with the orders Neisseriales and Burkholderiales. The
K-and Z-type Alpha- and Gammaproteobacteria lacked norB to a significantly
greater extent than those within the Beta- and Deltaproteobacteria.The
Ascomycota and Actinobacteria phyla were exclusively K-type organisms, whereas Z-type and KZ-type organisms were both overrepresented within the
Bacteroidetes phylum (Table 1). A third of all KZ-type Bacteroidetes did not have a norBgene, which can be attributed to the Flavobacteriales (Tables 1 and S3).
The lack of anir gene was particularly notable among species within the
Bacteroidetes (42%), but also within the Deltaproteobacteria (71.4%), Firmicutes (27.5%), and Euryarchaeota (35.7%), with the frequencies of Z-type organisms being significantly higher than expected within these groups (Tables 1and S2). The occurrence of S-type organisms was higher than expected within the
Deinococcus-Thermus phylum. Ten genomes carried both anirKand anirSgene
(Fig. 1; Table S1), including Gammaproteobacterium HdN1, Rhodothermus marinusand four strains of Pseudomonas stutzerithat also possessed anosZ gene.
Interestingly, the Bacteroidete Rhodothermus marinus did not have anor gene
although the other three genes were present.
Gene co-occurrence patterns in relation to habitat preference
When comparing data relating to lifestyle in terms of habitat preference withnir,
nor and nosZ gene co-occurrences, a significantly non-random pattern of
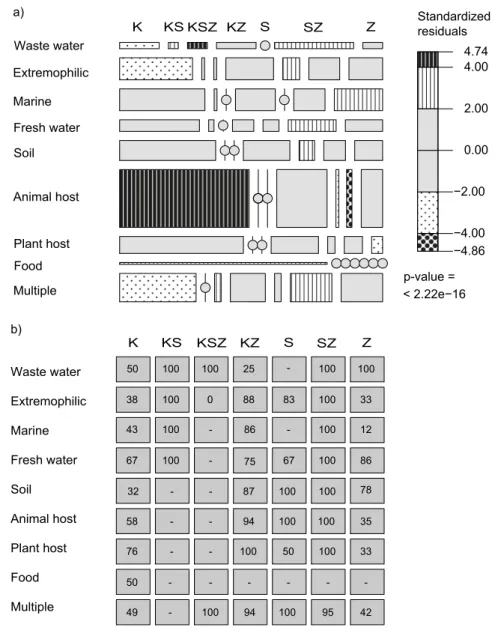
distribution was observed across the different nirand nos categories (x25136,
P,0.001; Fig. 3). Examination of standardized residuals revealed that K-type organisms were significantly overrepresented among animal host associated lifestyles, whereas the frequencies of both S- and SZ-types were significantly lower than expected in this category. By contrast, S-types were overrepresented among soil and extreme habitats, while K-types did not deviate from the expected frequency of occurrence or were underrepresented in each category, respectively. Contrasting patterns of K- and SZ-types were also observed in wastewater and multiple habitat categories, which had higher than expected frequencies of
SZ-type organisms. Less than half (47%) of the K-SZ-type genomes did not have a nor
harbored nor. Interestingly, in wastewater the occurrence of organisms with both
nirgenes (KS) was significantly higher than expected, as well as organisms with a
KSZ pattern. The frequency of organisms with only nosZwas overrepresented in
marine ecosystems, yet lower than expected in the category of plant host-associated lifestyles. The Z-type organisms exhibited a low occurrence of norin marine (12%) and host associated environments, whereas the opposite was observed in fresh water, soil and wastewater.
Figure 3. Gene co-occurrence types and habitat preference.a) Mosaic plot ofnirK(K),nirS(S) andnosZ
(Z) co-occurrence types across different habitat categories where tile size reflects the number of occurrences and patterns indicate significant overrepresentation (.2) or underrepresentation (,22) of co-occurrence patterns, as determined by standardized Pearson residuals fromx2test results (P,0.001). Circles indicate
non-occurring combinations. b) The percentage of organisms harboring anorgene for each combination across the habitat categories. No value indicates non-occurring combinations.
Discussion
The genome data-set analyzed in this study demonstrated that the denitrification pathway is modular with no less than seven different co-occurrence types of the genes coding for the reductases NirK, NirS and NosZ. Interestingly, we found ten
organisms that possess both anirKand anirSgene in the same genome. Although
that is still rare, it contradicts the previous assumption that the two nitrite reductases are mutually exclusive [14]. The presence of homologues for both nir
genes was previously reported in the genome of aMethylomonasstrain [48]. This may be significant in light of recent findings by [49], who demonstrated the co-occurence of both nir genes in co-existing subpopulations affiliated to
Pseudovibrio detected in the metagenome of a marine denitrifying community. Nevertheless, it has not yet been demonstrated if the two types of nitrite reductases are functional when present in the same genome, although it is not unlikely considering that two divergent copies ofnirSin aThauera sp. isolate were expressed under different conditions [50].
ThenosZ gene was used as a proxy for the capacity of an organism to reduce
N2O and we found that this gene occurred much more frequently in the genomes
of organisms with nirS than in those with nirK. This was previously suggested [14], although the limited number of observations at that time did not support a significant pattern. The presence or absence of a nor gene partly explained this pattern, as nirSalmost always co-occurred with nor, although there were
exceptions. The substantial difference in co-occurrence ofnosZ withnirSvs.nirK
in the genome data-set is likely governed by an underlying ecological or
evolutionary mechanism that constrains the loss of norand nosZ in organisms
withnirS. This is also supported by the higher degree of phylogenetic conservation
observed fornosZpresence when mapped onto thenirSphylogeny than onto that
of nirK. Previous studies have shown that loss of the nos regulon may occur
through either short-term adaptive processes, such as phase variation in nirK Azospirillum soil isolates [51], or more long-term gene loss events as observed for
nirK Neisseriaspecies [52]. It is tempting to attribute the higher frequency ofnirS,
nor and nosZ co-occurrence to regulatory mechanisms that may be shared
between the three enzyme complexes, but not with NirK, which is fully functional without accessory proteins. The expression of all three enzymes is controlled by oxygen and NO levels within the cell [11,53] and initiated by the transcription factors NNR, NnrR or DNR [54], however no specific link betweennirS,norand
nosZ expression has been described to date. Based on the gene co-occurrence
patterns, the majority of nirS organisms are more likely to perform complete
denitrification to N2 than the nirKtypes under favorable environmental
conditions and we suggest that the presence ofnorin the genome of an organism
also harboring niror nosZ serve as an indicator of whether the organism is a denitrifier sensu stricto or merely a nitrite or nitrous oxide reducer.
In the context of different co-occurrence patterns withnosZ, it is interesting that a range of studies have shown evidence of niche differentiation betweennirS
found in our genome comparisons are reflected in nature, an ecosystem in which
the denitrifier community is dominated by nirKbearing organisms would be
more likely to emit more N2O than one dominated by denitrifiers withnirSunder
the same environmental conditions. Indeed, the ratio ofnirS/nirKtype denitrifiers was recently demonstrated to have a significant and negative relationship with the capacity of a soil to act as an N2O sink when modeling the relative influence of
abiotic and denitrifier community factors on the potential for soil N2O reduction
[13]. This is also supported by previous findings. Clark et al. [56] reported a
positive correlation betweennirKabundance and N2O emissions from arable and
woodland soils, and based on qPCR measurements estimated that only 10–30% of
nirK type denitrifiers also carry thenosZ gene, depending on soil type. Similarly, Cuhel et al. [57] described a negative relationship between the ratio of N2O
emissions to total denitrification activity (i.e. N2 + N2O) and the relative
abundance of nirS-type denitrifiers in pastureland soils.
A highly truncated version of the denitrification pathway was observed among the substantial fraction of organisms that possessed thenosZgene without having
niror a putatively N2O producingnorgene, and these were predominantly found
within nosZ clade II. Several representatives from this clade, including the host-associated bacteria Wolinella succinogenesand Campylobacter fetus, as well as the thermophile Geobacillus thermodenitrificansand the soil bacterium
Anaeromyxobacter dehalogenans, have been demonstrated to grow with N2O as the
single electron acceptor [10,12,58–60]. An alternative, dissimilatory function for the nitrous oxide reductase has been recently proposed [61], but from an ecosystem perspective this detoxifying instead of energy conserving reaction would still result in N2O reduction. Net negative N2O fluxes in field
measurements have been reported [62,63] and recently it was demonstrated that
both the abundance and phylogenetic diversity of nosZ clade II largely explained the soil N2O sink capacity [13]. The authors also showed that groups that were
identified as significant indicators of N2O reduction were predominant in clade II
communities, especially those associated with nosZ II lineages from organisms
lacking nir. Because clade II has been shown to be both diverse and abundant in different ecosystems [45,46], these organisms in particular can potentially be
significant N2O consumers in the environment.
Although denitrification as a trait is widely distributed across different phyla, the observednir/nosco-occurrence patterns were not randomly distributed across taxa, from phylum down to order level, with significant patterns related to certain taxonomic groups. The data set was too small to detect any patterns at lower taxonomic ranks. Accordingly, closely related organisms do not necessarily share this trait, and even if they do the denitrification genes may be distantly related or they may not have the same set of genes [8,14,64–66]. Organisms harboring a
nosZ gene without possessing any nir gene were mainly found amongst the
Bacteroidetes, and Firmicutes belonging to nosZ clade II, and predominantly
lacked a nor gene. Thus, environments in which these taxa are highly abundant
may have substantially lower N2O emission rates than those dominated by
the Actinobacteria and Ascomycota. This coincides with the results of Philippot et al [67,68],who investigated the abundance of different taxa at high taxonomic ranks, as well as the abundance of different denitrifier genes and potential N2O
production and denitrification rates on a field that was subjected to different cattle grazing regimes. Interestingly, the percentage of N2O to total denitrification
activity (N2+ N2O) was lowest in the region of the field with the highest relative
abundance of Bacteroidetes and lowest abundance of Actinobacteria.
Furthermore, regions of the field in which nirS and nosZ clade I were most
abundant also had the highest relative abundance of Betaproteobacteria,
corresponding to our finding that the co-occurrence of nirS andnosZ is the
predominant pattern of denitrification genes within this class. Thus, general patterns of gene co-occurrences in conjunction with taxonomic information can potentially aid in our interpretation of experimental data and predictions of genetic N2O emission potential.
Comparisons of gene co-occurrence patterns to preferred habitat categories showed differential associations of denitrifier gene combinations with specific habitats or lifestyles. Most notable was the prevalence of K-types over S-types amongst animal host associated organisms, suggesting thatnirKmight be involved to a greater extent during animal host adaptation and pathogenicity. Previous studies examining the relationship between nitrite reduction and pathogenicity of
Neisseria andBrucella species have indicated thatnirK is expressed primarily to help the bacterium cope with low oxygen levels within the host [69,70]. However,
nirS has also been shown to be important for virulence in Pseudomonas
aeruginosa, albeit by regulation of virulence factors through maintaining a steady state of NO within the host [71]. It is known that prokaryotes undergo a process of genome shrinkage and gene loss during adaptation to animal hosts [72]. Since thenirKgene alone is sufficient to encode a functional protein whilenirSrequires several accessory genes [73], it may be more advantageous for host associated organisms to possessnirK rather than nirS. Interestingly, both the KS- and KSZ-types were significantly overrepresented in wastewater. One could speculate that
carrying both types of nirgenes could imply an adaptive advantage in an
environment supporting denitrification activity, provided that both genes are transcribed to functional nitrite reductases under different conditions. The SZ type was more often found among genomes isolated from wastewater and freshwater than expected by chance. In agreement, it has been suggested thatnirS
denitrifiers are better adapted to stable, high water content conditions where oxygen availability is expected to be consistently low, while nirKcommunities tend to dominate under more recurrently changing conditions [74]. Other studies
have also indicated that nirS communities are more frequently detected, more
diverse and more phylogenetically clustered in marine systems than nirK
communities [22], suggesting that nirS denitrifiers dominate in this habitat and
that nirSdenitrifying communities are shaped by habitat filtering more so than
nirK communities. However, our analysis based on habitat data recovered from
In conclusion, our results show that the co-occurrences of denitrification genes
are not randomly distributed among taxonomic groups, preferred habitats ornirK
and nirS denitrifiers. Although N2O emissions are subject to environmental
factors and inherent cellular regulatory mechanisms, the ultimate control over whether N2O is emitted during denitrification is the presence of nosZ in the
genomes of organisms that comprise the denitrifying community. Thus, the substantial difference between taxa as well as nirS,nirK and norco-occurrence with nosZlikely plays a significant role in determining the genetic N2O emission
potential from a given ecosystem, thereby underpinning the significance of
microbial community structure for N2O emissions. Further research examining
the underlying physiological or evolutionary mechanisms that result in the non-random patterns of nir/nor/nos gene occurrence observed here may provide additional predictive value for future N2O mitigation strategies.
Supporting Information
Figure S1. Maximum likelihood phylogeny of full-length 16S and 18S rRNA sequences from 652 organisms harboring denitrification genes. The inner colored ring represents taxonomic affiliation as indicated by the legend. The four outer bar-chart rings show the presence of nirK (orange), nirS(purple), nor
(turquoise) andnosZ(magenta). Bar height represents the number of copies (#4). Bootstrap values .70% are indicated by grey circles, and the scale bar denotes nucleotide substitution rate (GTR+C).
doi:10.1371/journal.pone.0114118.s001 (EPS)
Figure S2. Maximum likelihood phylogeny of 458 full-length nirKamino acid
sequences, rooted at midpoint.Co-occurrences ofnirS,norandnosZgenes in the genomes are indicated with purple, turquoise and magenta bars, respectively. Bar height depicts the number of co-occurring gene copies (#3) and the scale bar denotes nucleotide substitution rate (LG+C). Strain names are colored to indicate
taxonomic affiliation according to the legend, and bootstrap values .70% are
designated by circles.
doi:10.1371/journal.pone.0114118.s002 (EPS)
Figure S3. Maximum likelihood phylogeny of 110 full-length nirS amino acid
sequences, rooted at midpoint. Co-occurrences of nirK,nor and nosZ genes in the genomes are indicated with orange, turquoise and magenta bars, respectively. Bar height depicts the number of co-occurring gene copies (#2) and the scale bar denotes nucleotide substitution rate (LG+C+F). Strain names are colored to
indicate taxonomic affiliation according to the legend, and bootstrap values
.70% are designated by circles.
doi:10.1371/journal.pone.0114118.s003 (EPS)
Figure S4. Maximum likelihood phylogenies of 413 prokaryotic and 18 fungal (inserted graph) full-length noramino acid sequences. Both phylogenies are
are indicated with orange, purple and magenta bars, respectively. Bar height
depicts the number of co-occurring gene copies (#4) and the scale bar denotes
nucleotide substitution rate (LG+C+F and WAG+C+F respectively). cnorB
sequences are shaded in orange and qnorB sequences in green. Strain names are
colored to indicate taxonomic affiliation according to the legend, and bootstrap values .70% are designated by circles.
doi:10.1371/journal.pone.0114118.s004 (EPS)
Figure S5. Maximum likelihood phylogeny of 314 full-length nosZ amino acid
sequences, rooted at midpoint.Co-occurrences ofnirK,nirSandnorgenes in the genomes are indicated with orange, purple and turquoise bars, respectively. Bar height depicts the number of co-occurring gene copies (#4) and the scale bar denotes nucleotide substitution rate (LG+C). Clade I is shaded in orange, clade II
in blue and the halophilic Archaea in turquoise. Strain names are colored to indicate taxonomic affiliation according to the legend, and bootstrap values
.70% are designated by circles.
doi:10.1371/journal.pone.0114118.s005 (EPS)
Table S1. Taxon identification number and project name according to NCBI of 652 organisms harboring denitrification genes. Copy numbers of nirK, nirS, nor andnosZ are indicated.
doi:10.1371/journal.pone.0114118.s006 (PDF)
Table S2. Frequency table of gene co-occurrence patterns and taxonomic affiliation at class level.ThenirK(K),nirS(S) andnosZ (Z) co-occurrence types
and percentage of organisms within each class that also harbor a nor gene are
indicated.
doi:10.1371/journal.pone.0114118.s007 (PDF)
Table S3. Frequency table of gene co-occurrence patterns and taxonomic affiliation at order level.ThenirK(K),nirS(S) andnosZ(Z) co-occurrence types
and percentage of organisms within each order that also harbor a norgene are
indicated.
doi:10.1371/journal.pone.0114118.s008 (PDF)
Author Contributions
Conceived and designed the experiments: SH CMJ. Performed the experiments: DRHG CMJ. Analyzed the data: DRHG CMJ. Contributed reagents/materials/ analysis tools: CMJ. Wrote the paper: SH CMJ DRHG.
References
1. Rockstro¨m J, Steffen W, Noone K, Persson A˚ , Chapin FSIII, et al.(2009) Planetary Boundaries: Exploring the Safe Operating Space for Humanity. Ecol Soc 4: 32.
3. Climate Change 2013: The Physical Science Basis. Contribution of Working Group I to the Fifth Assessment Report of the Intergovernmental Panel on Climate Change. Stocker TF, D. Qin G-K, Plattner M, Tignor SK, Allen J, et al., editors. Cambridge: Cambridge University Press. 1535 p.
4. Ravishankara AR, Daniel JS, Portmann RW(2009) Nitrous oxide (N2O): the dominant ozone-depleting
substance emitted in the 21st century. Science 326: 123–125. doi:10.1126/science.1176985.
5. Firestone MK, Firestone RB, Tiedje JM (1980) Nitrous Oxide from Soil Denitrification: Factors Controlling its Biological Production. Am Assoc Adv Sci 208: 749–751. doi:10.1126/
science.208.4445.749.
6. Conrad R(1996) Soil microorganisms as controllers of atmospheric trace gases (H2, CO, CH4, OCS,
N2O, and NO). Microbiol Rev 60: 609–640.
7. Kool DM, Dolfing J, Wrage N, Van Groenigen JW (2011) Nitrifier denitrification as a distinct and significant source of nitrous oxide from soil. Soil Biol Biochem 43: 174–178. doi:10.1016/
j.soilbio.2010.09.030.
8. Zumft WG(1997) Cell biology and molecular basis of denitrification. Microbiol Mol Biol Rev 61: 533–616.
9. Sanford RA, Cole JR, Tiedje JM (2002) Characterization and Description of Anaeromyxobacter dehalogenansgen. nov., sp. nov., an Aryl-Halorespiring Facultative Anaerobic Myxobacterium. Appl Environ Microbiol 68: 893–900. doi:10.1128/AEM.68.2.893.
10. Simon J, Einsle O, Kroneck PMH, Zumft WG(2004) The unprecedentednosgene cluster ofWolinella succinogenesencodes a novel respiratory electron transfer pathway to cytochrome c nitrous oxide reductase. FEBS Lett 569: 7–12. doi:10.1016/j.febslet.2004.05.060.
11. Zumft WG, Kroneck PMH (2007) Respiratory transformation of nitrous oxide (N2O) to dinitrogen by
Bacteria and Archaea. Adv Microb Physiol 52: 107–227. doi:10.1016/S0065-2911(06)52003-X.
12. Sanford R, Wagner DD, Wu Q, Chee-Sanford JC, Thomas SH, et al.(2012) Unexpected nondenitrifier nitrous oxide reductase gene diversity and abundance in soils. Proc Natl Acad Sci U S A 109: 19709– 19714. doi:10.1073/pnas.1211238109.
13. Jones CM, Spor A, Brennan FP, Breuil M, Bru D, et al. (2014) Recently identified microbial guild mediates soil N2O sink capacity. Nat Clim Change 4: 801–805. doi:10.1038/nclimate2301.
14. Jones CM, Stres B, Rosenquist M, Hallin S(2008) Phylogenetic analysis of nitrite, nitric oxide, and nitrous oxide respiratory enzymes reveal a complex evolutionary history for denitrification. Mol Biol Evol 25: 1955–1966. doi:10.1093/molbev/msn146.
15. Philippot L, Andert J, Jones CM, Bru D, Hallin S(2011) Importance of denitrifiers lacking the genes encoding the nitrous oxide reductase for N2O emissions from soil. Glob Change Biol 17: 1497–1504.
doi:10.1111/j.1365-2486.2010.02334.x.
16. Shapleigh JP (2006).The Denitrifying Prokaryotes. In: The Prokaryotes. Dworkin M, Falkow S, Rosenberg E, Schleifer K-H, Stackebrandt E, editors. New York: Springer New York. pp. 769–792. doi:10.1007/0-387-30742-7.
17. Santoro AE, Boehm AB, Francis CA(2006) Denitrifier community composition along a nitrate and salinity gradient in a coastal aquifer. Appl Environ Microbiol 72: 2102–2109. doi:10.1128/AEM.72.3.2102.
18. Desnues C, Michotey VD, Wieland A, Zhizang C, Fourc¸ans A, et al. (2007) Seasonal and diel distributions of denitrifying and bacterial communities in a hypersaline microbial mat (Camargue, France). Water Res 41: 3407–3419. doi:10.1016/j.watres.2007.04.018.
19. Smith JM, Ogram A(2008) Genetic and functional variation in denitrifier populations along a short-term restoration chronosequence. Appl Environ Microbiol 74: 5615–5620. doi:10.1128/AEM.00349-08.
20. Enwall K, Throba¨ck IN, Stenberg M, So¨derstro¨m M, Hallin S(2010) Soil resources influence spatial patterns of denitrifying communities at scales compatible with land management. Appl Environ Microbiol 76: 2243–2250. doi:10.1128/AEM.02197-09.
21. Yuan Q, Liu P, Lu Y(2012) Differential responses ofnirK- andnirS-carrying bacteria to denitrifying conditions in the anoxic rice field soil. Environ Microbiol Rep 4: 113–122.
doi:10.1111/j.1758-2229.2011.00311.x.
23. Simon J, Klotz MG(2013) Diversity and evolution of bioenergetic systems involved in microbial nitrogen compound transformations. Biochim Biophys Acta 1827: 114–135. doi:10.1016/j.bbabio.2012.07.005.
24. Stein LY, Klotz MG(2011) Nitrifying and denitrifying pathways of methanotrophic bacteria. Biochem Soc Trans 39: 1826–1831. doi:10.1042/BST20110712.
25. Zumft WG(2005) Nitric oxide reductases of prokaryotes with emphasis on the respiratory, heme-copper oxidase type. J Inorg Biochem 99: 194–215. doi:10.1016/j.jinorgbio.2004.09.024.
26. Philippot L(2005) Denitrification in pathogenic bacteria: for better or worst? Trends Microbiol 13: 191– 192. doi:10.1016/j.tim.2005.03.001.
27. Ettwig KF, Butler MK, Le Paslier D, Pelletier E, Mangenot S, et al.(2010) Nitrite-driven anaerobic methane oxidation by oxygenic bacteria. Nature 464: 543–548. doi:10.1038/nature08883.
28. Daiber A, Shoun H, Ullrich V (2005) Nitric oxide reductase (P450nor) from Fusarium oxysporum. J Inorg Biochem 99: 185–193. doi:10.1016/j.jinorgbio.2004.09.018.
29. Pagani I, Liolios K, Jansson J, Chen I-M a, Smirnova T, et al.(2011) The Genomes OnLine Database (GOLD) v.4: status of genomic and metagenomic projects and their associated metadata. Nucleic Acids Res 40: D571–D579. doi:10.1093/nar/gkr1100.
30. Altschul SF, Gish W(1990) Basic Local Alignment Search Tool. J Mol Biol 215: 403–410. doi:10.1016/ S0022-2836(05)80360-2.
31. Liu K, Warnow TJ, Holder MT, Nelesen SM, Yu J, et al. (2012) SATe-II: very fast and accurate simultaneous estimation of multiple sequence alignments and phylogenetic trees. Syst Biol 61: 90–106. doi:10.1093/sysbio/syr095.
32. Katoh K, Misawa K, Kuma K, Miyata T(2002) MAFFT: a novel method for rapid multiple sequence alignment based on fast Fourier transform. Nucleic Acids Res 30: 3059–3066. doi:10.1093/nar/gkf436.
33. Stamatakis A (2006) RAxML-VI-HPC: maximum likelihood-based phylogenetic analyses with thousands of taxa and mixed models. Bioinformatics 22: 2688–2690. doi:10.1093/bioinformatics/btl446.
34. Altschul SF, Madden TL, Scha¨ffer AA, Zhang J, Zhang Z, et al. (1997) Gapped BLAST and PSI-BLAST: a new generation of protein database search programs. Nucleic Acids Res 25: 3389–3402. doi:10.1093/nar/25.17.3389.
35. Kizawa H, Tomura D, Oda M, Fukamizu a, Hoshino T, et al.(1991) Nucleotide sequence of the unique nitrate/nitrite-inducible cytochrome P-450 cDNA from Fusarium oxysporum. J Biol Chem 266: 10632– 10637.
36. Nawrocki EP, Kolbe DL, Eddy SR(2009) Infernal 1.0: inference of RNA alignments. Bioinformatics 25: 1335–1337. doi:10.1093/bioinformatics/btp157.
37. Quast C, Pruesse E, Yilmaz P, Gerken J, Schweer T, et al.(2013) The SILVA ribosomal RNA gene database project: improved data processing and web-based tools. Nucleic Acids Res 41: D590–D596. doi:10.1093/nar/gks1219.
38. Edgar RC, Drive RM, Valley M(2004) MUSCLE: multiple sequence alignment with high accuracy and high throughput. Nucleic Acids Res 32: 1792–1797. doi:10.1093/nar/gkh340.
39. Abascal F, Zardoya R, Posada D (2005) ProtTest: selection of best-fit models of protein evolution. Bioinformatics 21: 2104–2105. doi:10.1093/bioinformatics/bti263.
40. Le SQ, Gascuel O(2008) An improved general amino acid replacement matrix. Mol Biol Evol 25: 1307– 1320. doi:10.1093/molbev/msn067.
41. Pruesse E, Peplies J, Glo¨ckner FO (2012) SINA: accurate high-throughput multiple sequence alignment of ribosomal RNA genes. Bioinformatics 28: 1823–1829. doi:10.1093/bioinformatics/bts252.
42. Letunic I, Bork P(2007) Interactive Tree Of Life (iTOL): an online tool for phylogenetic tree display and annotation. Bioinformatics 23: 127–128. doi:10.1093/bioinformatics/btl529.
43. Fritz SA, Purvis A(2010) Selectivity in mammalian extinction risk and threat types: a new measure of phylogenetic signal strength in binary traits. Conserv Biol 24: 1042–1051.
doi:10.1111/j.1523-1739.2010.01455.x.
45. Jones CM, Graf DR, Bru D, Philippot L, Hallin S(2013) The unaccounted yet abundant nitrous oxide-reducing microbial community: a potential nitrous oxide sink. ISME J 7: 417–426. doi:10.1038/ ismej.2012.125.
46. Orellana LH, Rodriguez-R LM, Higgins S, Chee-Sanford JC, Sanford R a, et al.(2014) Detecting nitrous oxide reductase (NosZ) genes in soil metagenomes: method development and implications for the nitrogen cycle. mBio 5: e01193–14. doi:10.1128/mBio.01193-14.
47. Bartossek R, Nicol GW, Lanzen A, Klenk H-P, Schleper C(2010) Homologues of nitrite reductases in ammonia-oxidizing archaea: diversity and genomic context. Environ Microbiol 12: 1075–1088. doi:10.1111/j.1462-2920.2010.02153.x.
48. Campbell M, Nyerges G, Kozlowski J, Poret-Peterson AT, Stein LY, et al. (2011) Model of the molecular basis for hydroxylamine oxidation and nitrous oxide production in methanotrophic bacteria. FEMS Microbiol Lett 322: 82–89. doi:10.1111/j.1574-6968.2011.02340.x.
49. Kraft B, Tegetmeyer HE, Meier D, Geelhoed JS, Strous M (2014) Rapid succession of uncultured marine bacterial and archaeal populations in a denitrifying continuous culture. Environ Microbiol 16: 3275–3286. doi:10.1111/1462-2920.12552.
50. Etchebehere C, Tiedje J(2005) Presence of Two Different Active nirS Nitrite Reductase Genes in a Denitrifying Thauera sp. from a High-Nitrate-Removal-Rate Reactor. Appl Environ Microbiol 71: 5642. doi:10.1128/AEM.71.9.5642.
51. Vial L, Lavire C, Mavingui P, Blaha D, Haurat J, et al.(2006) Phase variation and genomic architecture changes in Azospirillum. J Bacteriol 188: 5364–5373. doi:10.1128/JB.00521-06.
52. Barth KR, Isabella VM, Clark VL (2009) Biochemical and genomic analysis of the denitrification pathway within the genus Neisseria. Microbiology 155: 4093–4103. doi:10.1099/mic.0.032961-0.
53. Ko¨rner H, Sofia HJ, Zumft WG(2003) Phylogeny of the bacterial superfamily of Crp-Fnr transcription regulators: exploiting the metabolic spectrum by controlling alternative gene programs. FEMS Microbiol Rev 27: 559–592. doi:10.1016/S0168-6445(03)00066-4.
54. Spiro S (2012) Nitrous oxide production and consumption: regulation of gene expression by gas-sensitive transcription factors. Philos Trans R Soc Lond B Biol Sci 367: 1213–1225. doi:10.1098/ rstb.2011.0309.
55. Ban˜eras L, Ruiz-Rueda O, Lo´pez-Flores R, Quintana XD, Hallin S(2012) The role of plant type and salinity in the selection for the denitrifying community structure in the rhizosphere of wetland vegetation. Int Microbiol 15: 89–99. doi:10.2436/20.1501.01.162.
56. Clark IM, Buchkina N, Jhurreea D, Goulding KWT, Hirsch PR(2012) Impacts of nitrogen application rates on the activity and diversity of denitrifying bacteria in the Broadbalk Wheat Experiment. Philos Trans R Soc Lond B Biol Sci 367: 1235–1244. doi:10.1098/rstb.2011.0314.
57. Cuhel J, Simek M, Laughlin RJ, Bru D, Che`neby D, et al.(2010) Insights into the effect of soil pH on N2O and N2emissions and denitrifier community size and activity. Appl Environ Microbiol 76: 1870–
1878. doi:10.1128/AEM.02484-09.
58. Payne WJ, Grant M a, Shapleigh J, Hoffman P (1982) Nitrogen oxide reduction in Wolinella succinogenesandCampylobacterspecies. J Bacteriol 152: 915–918.
59. Liu X, Gao C, Zhang A, Jin P, Wang L, et al.(2008) Thenosgene cluster from gram-positive bacterium
Geobacillus thermodenitrificansNG80-2 and functional characterization of the recombinant NosZ. FEMS Microbiol Lett 289: 46–52. doi:10.1111/j.1574-6968.2008.01362.x.
60. Kern M, Simon J(2009) Electron transport chains and bioenergetics of respiratory nitrogen metabolism inWolinella succinogenesand other Epsilonproteobacteria. Biochim Biophys Acta 1787: 646–656. doi:10.1016/j.bbabio.2008.12.010.
61. Sullivan MJ, Gates AJ, Appia-Ayme C, Rowley G, Richardson DJ(2013) Copper control of bacterial nitrous oxide emission and its impact on vitamin B12-dependent metabolism. Proc Natl Acad Sci U S A 110: 19926–19931. doi:10.1073/pnas.1314529110.
62. Chapuis-Lardy L, Wrage N, Metay A, Chotte J-L, Bernoux M(2007) Soils, a sink for N2O? A review.
Glob Chang Biol 13: 1–17. doi:10.1111/j.1365-2486.2006.01280.x.
63. Wu D, Dong W, Oenema O, Wang Y, Trebs I, et al.(2013) N2O consumption by low-nitrogen soil and its
64. Philippot L(2002) Denitrifying genes in bacterial and Archaeal genomes. Biochim Biophys Acta 1577: 355–376. doi:10.1016/S0167-4781(02)00420-7.
65. Jones CM, Welsh A, Throba¨ck IN, Do¨rsch P, Bakken LR, et al.(2011) Phenotypic and genotypic heterogeneity among closely related soil-borne N2- and N2O-producingBacillusisolates harboring the
nosZgene. FEMS Microbiol Ecol 76: 541–552. doi:10.1111/j.1574-6941.2011.01071.x.
66. Liu B, Mao Y, Bergaust L, Bakken LR, Frostega˚rd A˚ (2013) Strains in the genusThaueraexhibit remarkably different denitrification regulatory phenotypes. Environ Microbiol 15: 2816–2828. doi:10.1111/ 1462-2920.12142.
67. Philippot L, Cuhel J, Saby NP a, Che`neby D, Chrona´kova´ A, et al.(2009) Mapping field-scale spatial patterns of size and activity of the denitrifier community. Environ Microbiol 11: 1518–1526. doi:10.1111/ j.1462-2920.2009.01879.x.
68. Philippot L, Bru D, Saby NP a, Cuhel J, Arrouays D, et al.(2009) Spatial patterns of bacterial taxa in nature reflect ecological traits of deep branches of the 16S rRNA bacterial tree. Environ Microbiol 11: 3096–3104. doi:10.1111/j.1462-2920.2009.02014.x.
69. Baek S, Rajashekara G, Splitter GA, Shapleigh JP (2004) Denitrification genes regulate Brucella
virulence in mice. J Bacteriol 186: 6025–6031. doi:10.1128/JB.186.18.6025.
70. Roop RM, Gaines JM, Anderson ES, Caswell CC, Martin DW (2009) Survival of the fittest: how
Brucellastrains adapt to their intracellular niche in the host. Med Microbiol Immunol 198: 221–238. doi:10.1007/s00430-009-0123-8.
71. Van Alst NE, Wellington M, Clark VL, Haidaris CG, Iglewski BH(2009) Nitrite reductase NirS is required for type III secretion system expression and virulence in the human monocyte cell line THP-1 by Pseudomonas aeruginosa. Infect Immun 77: 4446–4454. doi:10.1128/IAI.00822-09.
72. Toft C, Andersson SGE(2010) Evolutionary microbial genomics: insights into bacterial host adaptation. Nat Rev Genet 11: 465–475. doi:10.1038/nrg2798.
73. Philippot L, Piutti S, Martin-laurent F, Hallet S, Germon JC(2002) Molecular Analysis of the nitrate-reducing community from unplanted and maize-planted soils. Appl Env Microbiol 68: 6121–6128. doi:10.1128/AEM.68.12.6121.