ACPD
10, 21439–21474, 2010Anthropogenic imprints on nitrogen and oxygen isotopic
composition
Y. T. Fang et al.
Title Page
Abstract Introduction
Conclusions References
Tables Figures
◭ ◮
◭ ◮
Back Close
Full Screen / Esc
Printer-friendly Version Interactive Discussion
Discussion
P
a
per
|
Dis
cussion
P
a
per
|
Discussion
P
a
per
|
Discussio
n
P
a
per
|
Atmos. Chem. Phys. Discuss., 10, 21439–21474, 2010 www.atmos-chem-phys-discuss.net/10/21439/2010/ doi:10.5194/acpd-10-21439-2010
© Author(s) 2010. CC Attribution 3.0 License.
Atmospheric Chemistry and Physics Discussions
This discussion paper is/has been under review for the journal Atmospheric Chemistry and Physics (ACP). Please refer to the corresponding final paper in ACP if available.
Anthropogenic imprints on nitrogen and
oxygen isotopic composition of
precipitation nitrate in a nitrogen-polluted
city in southern China
Y. T. Fang1,2, K. Koba2, X. M.Wang3, D. Z. Wen1, J. Li1, Y. Takebayashi2, X. Y. Liu2, and M. Yoh2
1
South China Botanical Garden, Chinese Academy of Sciences, Guangzhou 510650, China 2
Tokyo University of Agriculture and Technology, Tokyo 183 8509, Japan 3
School of Environmental Sciences and Engineering, Sun Yat-Sen University, Guangzhou 501275, China
Received: 4 September 2010 – Accepted: 6 September 2010 – Published: 8 September 2010
Correspondence to: Y. T. Fang ([email protected])
ACPD
10, 21439–21474, 2010Anthropogenic imprints on nitrogen and oxygen isotopic
composition
Y. T. Fang et al.
Title Page
Abstract Introduction
Conclusions References
Tables Figures
◭ ◮
◭ ◮
Back Close
Full Screen / Esc
Printer-friendly Version Interactive Discussion
Discussion
P
a
per
|
Dis
cussion
P
a
per
|
Discussion
P
a
per
|
Discussio
n
P
a
per
|
Abstract
Nitric acid (HNO3) or nitrate (NO−
3) is the dominant sink for reactive nitrogen oxides
(NOx=NO + NO2) in the atmosphere. In many Chinese cities, HNO3 is becoming a significant contributor to acid deposition. In the present study, we used the deni-trifier method to measure nitrogen (N) and oxygen (O) isotopic composition of NO− 3 5
in 113 precipitation samples collected from Guangzhou City in southern China over a two-year period (2008 and 2009). We attempted to better understand the spatial and seasonal variability of atmospheric NOx sources and the NO−
3 formation pathways in
this N-polluted city in the Pearl River Delta region. Theδ15N values of NO−
3 (versus air
N2) ranged from−4.9 to+10.1‰, and averaged+3.9‰ in 2008 and+3.3‰ in 2009.
10
Positiveδ15N values were observed throughout the year, indicating the anthropogenic contribution of NOx emissions, particularly from coal combustion. Different seasonal patterns of δ15N-NO−
3 were observed between 2008 and 2009, which might reflect
different human activities associated with the global financial crisis and the intensive preparations for the 16th Asian Games. Nitrateδ18O values (versus Vienna Standard
15
Mean Ocean Water) varied from+33.4 to +86.5‰ (average +65.0‰ and+67.0‰ in 2008 and 2009, respectively), a range being lower than those reported for high alti-tude and polar areas. Severalδ18O values were observed lower than the expected minimum of 50‰ at our study site. This was likely caused by the reaction of NO with peroxy radicals; peroxy radicals can compete with O3to convert NO to NO2, thereby
20
donate O atoms with much lowerδ18O value than that of O3to atmospheric NO− 3. Our
ACPD
10, 21439–21474, 2010Anthropogenic imprints on nitrogen and oxygen isotopic
composition
Y. T. Fang et al.
Title Page
Abstract Introduction
Conclusions References
Tables Figures
◭ ◮
◭ ◮
Back Close
Full Screen / Esc
Printer-friendly Version Interactive Discussion
Discussion
P
a
per
|
Dis
cussion
P
a
per
|
Discussion
P
a
per
|
Discussio
n
P
a
per
|
1 Introduction
Global atmospheric emissions of nitrogen oxides (NOx, the sum of NO and NO2) have increased dramatically during the past 150 years (Galloway et al., 2004, 2008). Current global NOx emissions are dominated by fossil fuel combustion (63%) and far exceed natural NOxsources, such as lightning, biogenic soil processes, and wildfires (Ehhalt et
5
al., 2001). NOxcontribute to the formation of ozone (O3) and particulate matter (Ehhalt et al., 2001) and are thus an important factor affecting regional air quality and radia-tive balance (Morin et al., 2008). Once emitted to the atmosphere, NOx are oxidized via several pathways to form highly soluble nitric acid (HNO3), which is then dissolved in precipitation or collected on aerosols and subsequently scavenged from the
atmo-10
sphere as wet or dry deposition (Ehhalt et al., 2001; Elliott et al., 2009). The elevated atmospheric deposition of NO−3 associated with increased NOx emissions also poses many ecological and environmental threats, including the acidification of soil and sur-face water, the eutrophication of lakes, rivers, and estuaries, the loss of biodiversity, and the alteration of global carbon budget (Vitousek et al., 1997; Aber et al., 1998;
15
Gundersen et al., 1998; Fang et al., 2008; Galloway et al., 2008).
The growth in NOx emissions is expected to have shifted from North America and Europe to Asia (Ehhalt et al., 2001). In China, HNO3 is becoming a significant con-tributor to acid rain due to the increased vehicle population and power plants (Zhang et al., 2009; Wang et al., 2010), and to the control on SO2 emissions (Zhao et al.,
20
2009) in many cities. For example, in Guangzhou City in southern China, the molar ratios of sulfate (SO24−) to NO−3 in precipitation have decreased continuously from 4.6 in 1986–1990 to 2.8 in the 1990s and to 1.5 in the 2000s (Fig. 1). Thus, it is impor-tant to recognize and control the anthropogenic production of NOx(and therefore NO−3) from natural processes (e.g., soil emissions, biomass burning, and lightning) in order to
25
ACPD
10, 21439–21474, 2010Anthropogenic imprints on nitrogen and oxygen isotopic
composition
Y. T. Fang et al.
Title Page
Abstract Introduction
Conclusions References
Tables Figures
◭ ◮
◭ ◮
Back Close
Full Screen / Esc
Printer-friendly Version Interactive Discussion
Discussion
P
a
per
|
Dis
cussion
P
a
per
|
Discussion
P
a
per
|
Discussio
n
P
a
per
|
air and water quality (Elliott et al., 2007, 2009).
Once released to the atmosphere, NOx are converted to atmospheric NO−
3 through
a number of chemical pathways (Calvert et al., 1985; Heaton et al., 2004; also see Hastings et al., 2003, 2004; Elliott et al., 2007, 2009; Kendall et al., 2007; Morin et al., 2008, 2009). Most tropospheric NOx are emitted as NO, which photochemically
5
equilibrates with NO2within a few minutes (Reactions R1 and R2); this NO2 is further oxidized via several major chemical reaction pathways. During the day, the photolytic production of hydroxyl (OH) radical results in the oxidation of NO2 to HNO3(g) via the OH radical (reaction R3). This pathway is also most prevalent in summer when the concentrations of photochemically produced OH radicals are the highest (Calvert et
10
al., 1985); this is termed the OH pathway hereafter. At nighttime, NO2 is oxidized by O3 to produce NO3 radical (NO3) (reaction R4), which subsequently combines with NO2to form dinitrogen pentoxide (N2O5) (Reaction R5). The hydrolysis of N2O5yields HNO3(g) (Reaction R6). This pathway is most prevalent during winter as N2O5 is thermally unstable (Calvert et al., 1985), and is termed the N2O5pathway hereafter.
15
NO+O3→NO2+O2 (R1)
NO2+hv→NO+O (R2)
NO2+OH→HNO3 (R3)
NO2+O3→NO3+O2 (R4)
NO3+NO2→N2O5 (R5)
20
N2O5+H2O(surface)→2HNO3 (R6)
ACPD
10, 21439–21474, 2010Anthropogenic imprints on nitrogen and oxygen isotopic
composition
Y. T. Fang et al.
Title Page
Abstract Introduction
Conclusions References
Tables Figures
◭ ◮
◭ ◮
Back Close
Full Screen / Esc
Printer-friendly Version Interactive Discussion
Discussion
P
a
per
|
Dis
cussion
P
a
per
|
Discussion
P
a
per
|
Discussio
n
P
a
per
|
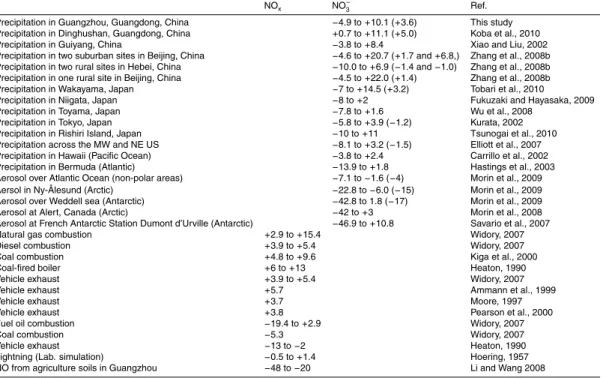
values of anthropogenic and natural NOx sources vary over a large range. The δ15N values of NOx from coal-fired power plants range from +5 to +13‰ (Heaton, 1990; Kiga et al., 2000), whereas vehicular NOx emissions from tailpipe exhaust, roadside denuders, and roadside vegetation have relatively lowδ15N values (+3.7, +5.7, and
+3.8‰, respectively) (Moore, 1977; Ammann et al., 1999; Pearson et al., 2000). One
5
study also reported negative δ15N values of NOx for vehicle exhaust (e.g., −13 to
−2‰, Heaton, 1990). Theδ15N values of natural NOxsources, including lightning, bio-genic NOxemissions, and biomass burning, have not yet been well quantified. Hoering (1957) reported that theδ15N values of NOxproduced during electrical discharge used to simulate lightning range from−0.5 to +1.4‰. The δ15N values are −48 to −20‰
10
for NO emitted by fertilized soil (Li and Wang, 2008). Lowδ15N values were found at pristine sites relative to polluted sites (Moore, 1977; Pearson et al., 2000), and during spring and summer relative to other seasons (Freyer, 1991; Russell et al., 1998).
On the other hand, δ18O of atmospheric NO−
3 is considered to be mostly related to
oxidation pathways in the atmosphere, involving such atmospheric oxidants as O3, OH
15
radicals, peroxy radicals, and halogen oxides (Hastings et al., 2003, 2004; Michalski et al., 2003; Morin et al., 2008, 2009; Alexander et al., 2009). The oxidation reactions are influenced by many factors, including temperature, humidity, solar radiation, and the availability of reactive aerosol surfaces (Wankel et al., 2010). Theδ18O values of atmospheric NO−
3 are mostly controlled by the seasonality of the chemical oxidation 20
pathways (Reactions R1–R6) due to the highδ18O values contributed by O3 (+90 to
+120%) during NO−3 formation (Hastings et al., 2003; Michalski et al., 2003). The O isotopic composition of HNO3 formed by the OH pathway reflects the contribution of 2/3 O3 and 1/3 OH, whereas the O isotopic composition of HNO3 formed by the N2O5pathway reflects the contribution of 5/6 O3and 1/6 H2O. Thus, atmospheric NO−3
25
ACPD
10, 21439–21474, 2010Anthropogenic imprints on nitrogen and oxygen isotopic
composition
Y. T. Fang et al.
Title Page
Abstract Introduction
Conclusions References
Tables Figures
◭ ◮
◭ ◮
Back Close
Full Screen / Esc
Printer-friendly Version Interactive Discussion
Discussion
P
a
per
|
Dis
cussion
P
a
per
|
Discussion
P
a
per
|
Discussio
n
P
a
per
|
NO−3 in winter than in summer in the previous studies (Hastings et al., 2003, 2004; Elliott et al., 2007, 2009; Morin et al., 2008, 2009; Wankel et al., 2010).
The dual isotopes of atmospheric NO−
3 have been intensively analyzed in middle
and high latitude regions in an effort to constrain NOxsources and formation pathways (Hastings et al., 2003; Elliott et al., 2007; Morin et al., 2008, 2009). For instance,
El-5
liott et al. (2007) demonstrated a strong correlation between wet depositionδ15N-NO− 3
and stationary source (e.g., power plant facilities) NOx emissions in the northeastern US, with higher δ15N values (up to +3.2‰) found in areas affected by higher NOx emissions, suggesting that the dual nitrate isotope is a promising tool to constrain NOx sources to a given location. To date, little work has been done to characterize the dual
10
isotopic composition of atmospheric N deposition in low latitude regions (Morin et al., 2009; Wankel et al., 2010), particularly in a location with complex air pollution under warm and humid conditions, such as the city we studied.
In this study, we measured the N and O isotopic composition of NO−3 in 113 precipita-tion samples collected from Guangzhou City in southern China over a two-year period
15
(2008 and 2009). Guangzhou City is located in the center of the Pearl River Delta. It is highly populated and is one of the major economic centers in China. In the last three decades, rapid economic development has led to complex and regional air pollution problems, such as acid rain, photochemical smog, and haze, over this region (Wang et al., 2003, 2007, 2010; Zhang et al., 2008a; Zheng et al., 2009). We attempted to
20
better understand the spatial and seasonal variability of atmospheric NOx sources in this N-polluted city and the NO−
3 formation pathways in combination with air mass back
trajectory analysis, which would help us evaluate the impact of urban development and industrialization on the N input to the study region.
Our hypotheses were that in the study city, 1) there would be a distinct seasonal
25
pattern ofδ15N-NO−
3 in precipitation with lower values in the warm season due to the
emis-ACPD
10, 21439–21474, 2010Anthropogenic imprints on nitrogen and oxygen isotopic
composition
Y. T. Fang et al.
Title Page
Abstract Introduction
Conclusions References
Tables Figures
◭ ◮
◭ ◮
Back Close
Full Screen / Esc
Printer-friendly Version Interactive Discussion
Discussion
P
a
per
|
Dis
cussion
P
a
per
|
Discussion
P
a
per
|
Discussio
n
P
a
per
|
sions, δ15N-NO−
3 values would be higher than those of other remote areas; 3)δ 18
O-NO−3 would be lower in the warm season than in the cool season due to the longer daytime in the warm season, as previously reported (Hastings et al., 2003, 2007; Elliott et al., 2007, 2009), but the seasonal variation would be small compared to those of high latitude and polar areas; and 4)δ18O-NO−
3 would be lower than those of high lat-5
itude and polar areas due to the relative longer daytime and the more abundant water vapor, as our study site is close to the equator (humid tropical climate). However, we also expected that the seasonal N and O isotopic patterns might have been affected by the energy consumption pattern associated with certain events, such as the global financial crisis in 2008 and the intensive construction activities preparing for the 16th
10
Asian Games in 2009.
2 Methods
2.1 Sampling
From 2008 to 2009, bulk precipitation was collected in the Southern China Botanical Garden (23.2◦N, 113.3◦E) of Guangzhou City on a daily basis. In some months, no 15
precipitation could be sampled owing to the small volume and the prolonged drought, which resulted in an underestimation of the annual precipitation N input. Precipitation was collected with an open funnel (23 cm in diameter) that was connected to a 5 L sampling bottle with a black polypropylene tube. The collector was washed with distilled water immediately after each collection. Samples were filtered within 24 h of collection
20
ACPD
10, 21439–21474, 2010Anthropogenic imprints on nitrogen and oxygen isotopic
composition
Y. T. Fang et al.
Title Page
Abstract Introduction
Conclusions References
Tables Figures
◭ ◮
◭ ◮
Back Close
Full Screen / Esc
Printer-friendly Version Interactive Discussion
Discussion
P
a
per
|
Dis
cussion
P
a
per
|
Discussion
P
a
per
|
Discussio
n
P
a
per
|
2.2 Chemical and isotope analyses
The concentrations of major ions, including NH+4, NO−2, and NO−3, in all precipitation samples were determined by ion chromatography (Dionex DX-120, Osaka, Japan). Theδ15N (versus air N2) andδ18O (versus Vienna Standard Mean Ocean Water) val-ues of NO−3 in precipitation were measured using the denitrifier method (Sigman et
5
al., 2001; Casciotti et al., 2002), with an isotope-ratio mass spectrometer (Delta XP; Thermo Fisher Scientific K.K., Yokohama, Japan) coupled with a gas chromatograph (HP6890; Hewlett Packard Co., Palo Alto, CA, USA) equipped with a PoraPLOT col-umn (25 m×0.32 mm) and GC interface III (Thermo Fisher Scientific K.K., Yokohama,
Japan). The denitrifying bacterium,Pseudomonas aureofaciens, was used to convert
10
25 nmoles of NO−3 into gaseous N2O in 20 mL vials prior to isotope analysis. We ran several standards (USGS32, 34, and 35, and IAEA NO−3) to obtain the calibration curve to correct for drift, oxygen isotope exchange, and blank. The average standard devia-tions for replicate analysis of an individual sample were±0.2‰ for δ15N of NO−
3 and
±0.5‰ forδ18O.
15
Because atmospheric NO−
3 likely contains a large mass-independent 17
O anomaly (Michalski et al., 2003, 2004), use of the denitrifier method for δ15N measurements requires correction for the contribution of the mass-independent14N-14N-17O (the m/z 45 signal) to the analyte N2O (see Hastings et al., 2003, 2004). In this paper, we report the uncorrected results; the mass independence of 17O relative to the m/z 45
20
signal of N2O generated from NO−
3 deposition was reported to result in a mean lowing
of theδ15N values by approximately−1.5‰ (Elliott et al., 2009; Wankel et al., 2010). As denitrifying bacteria convert both NO−
3 and NO−2 to N2O, the δ15N values reported
here represent the combined pools of NO−
2 and NO −
3. The presence of NO −
2 interferes
with the analyses ofδ18O-NO−
3 and may result in some errors (Casciotti et al., 2002; 25
Casciotti et al., 2007). In a similar study of the dual isotopes of aerosol NO−3, Wankel et al. (2010) found average corrections for NO−
ACPD
10, 21439–21474, 2010Anthropogenic imprints on nitrogen and oxygen isotopic
composition
Y. T. Fang et al.
Title Page
Abstract Introduction
Conclusions References
Tables Figures
◭ ◮
◭ ◮
Back Close
Full Screen / Esc
Printer-friendly Version Interactive Discussion
Discussion
P
a
per
|
Dis
cussion
P
a
per
|
Discussion
P
a
per
|
Discussio
n
P
a
per
|
which NO−2 concentrations were 3% of total NO−3 plus NO−2. In our study, four rainwater samples contained more than 5 µmol L−1NO−2, but NO−2 made up on average 1.6% of total NO−
3 plus NO−2 for all the samples over the study period. Thus, we expect a minor
analytical artifact resulting from the presence of NO−
2 in this study.
2.3 Backward trajectories
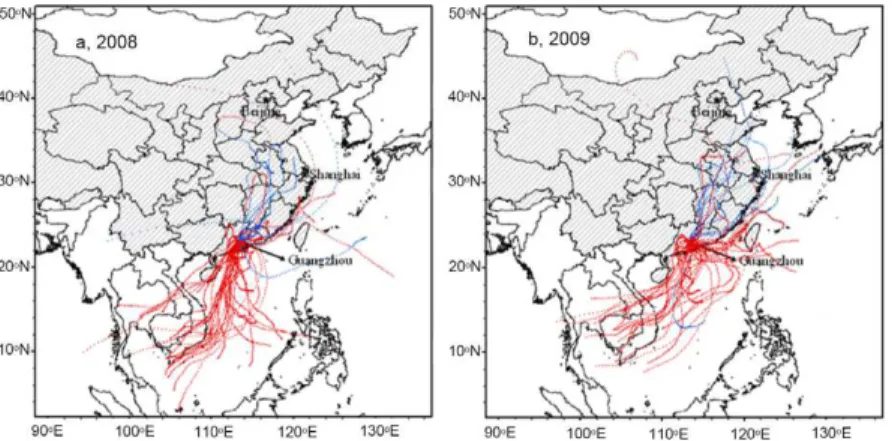
5
To analyze the impact of air mass transportation, 72-h backward trajectories were com-puted for all sample days using NOAA’s Hybrid Single-Particle Lagrangian Integrated Trajectory (HYSPLIT) (http://ready.arl.noaa.gov/HYSPLIT traj.php) (Draxler and Rolph, 2010) at an altitude of 500 m above ground level. This time frame was chosen since the lifetime of NOx in the boundary layer is generally less than 2 days, with a longer
10
lifetime expected in the winter (1.2 days) than in the summer (0.27 days), and since HNO3 generally has a similar atmospheric lifetime of 1–2 days (Liang et al., 1998). The air mass sectors were categorized to be of continental origin (i.e., the mainland of China) or marine origin (e.g., from the South China Sea or the Philippine Sea), accord-ing to the startaccord-ing point of air mass transportation (72 h before arrival at Guangzhou).
15
The air masses starting over southern Asian countries like Thailand and Vietnam were considered to be of marine origin in this study for they passed through the South China Sea.
2.4 Calculations and statistical analysis
Annual precipitation N is the sum of the product of concentration and water amount
20
for each sampling period. One-way ANOVA was performed for concentration, δ15N, and δ18O of precipitation NO−
3 in order to identify the differences between seasons
and between air mass sources for each year. Two-way ANOVA was used to identify the significance between years, seasons, and air mass sources for the investigated variables across the study period. Correlation analysis with the two-tail significance
25
ACPD
10, 21439–21474, 2010Anthropogenic imprints on nitrogen and oxygen isotopic
composition
Y. T. Fang et al.
Title Page
Abstract Introduction
Conclusions References
Tables Figures
◭ ◮
◭ ◮
Back Close
Full Screen / Esc
Printer-friendly Version Interactive Discussion
Discussion
P
a
per
|
Dis
cussion
P
a
per
|
Discussion
P
a
per
|
Discussio
n
P
a
per
|
or in the individual year. All analyses were conducted using PASW Statistics 18.0 for Windows. Statistically significant differences were set at P values <0.05 unless otherwise stated.
3 Results
3.1 Precipitation NO−
3 input
5
For the 113 precipitation samples collected in Guangzhou City, NO−
3 concentration
ranged from 6 to 256 µmol L−1, except for one rain event on 17 September 2008 that had an unusually high concentration (404 µmol L−1) (Fig. 2b). As the isotope results
for this sample were not anomalous (Fig. 2c, d), we considered that there was no contamination and the data were included in the data analysis. Two-way ANOVA using
10
year and season as main factors showed that NO−
3 concentration was not significantly
different between years (Table 1). Mean NO−3 concentration was higher during the cool season (October to March) than during the warm season (April to September) in 2008, but the reverse was true in 2009 (Table 2).
The amounts of precipitation were 2162 mm in 2008 and 1931 mm in 2009, with 77%
15
and 79% fallen during the warm season (Figs. 2a, 3; Table 2). The annual NO− 3 input
in precipitation was 16.0 and 18.5 kg N ha−1in the two study years, with 74% and 80% fallen in the warm season (Table 2). Continental precipitation accounted for 38% and 31% of the annual precipitation amount in 2008 and 2009, respectively (Fig. 3), but brought proportionally more NO−
3 input (52% and 41% of annual NO −
3 input) due to the 20
higher NO−3 concentration (Table 3).
3.2 N isotopes of NO−
3
Our measurements ofδ15N of precipitation NO−
3 over the study period varied between
ACPD
10, 21439–21474, 2010Anthropogenic imprints on nitrogen and oxygen isotopic
composition
Y. T. Fang et al.
Title Page
Abstract Introduction
Conclusions References
Tables Figures
◭ ◮
◭ ◮
Back Close
Full Screen / Esc
Printer-friendly Version Interactive Discussion
Discussion
P
a
per
|
Dis
cussion
P
a
per
|
Discussion
P
a
per
|
Discussio
n
P
a
per
|
respectively (Fig. 2, Table 1). Positiveδ15N values were observed throughout 2008, but some negative values or near zero values were observed in the summer (Fig. 2c). However, the seasonal difference between the warm and cool seasons was not sig-nificant in that year (Table 2). There was also no sigsig-nificant difference inδ15N values between continental and marine sources (Table 3). In 2009,δ15N of NO−
3 in the warm 5
season was significantly higher than that in the cool season (Table 2).
3.3 O isotopes of NO−3
Theδ18O values of NO−
3 ranged from +33.4 to +86.2‰ (Fig. 2d), with annual mean
values of +65.0‰ and +67.7‰ in 2008 and 2009, respectively (Table 1). The NO−3 -flux-weightedδ15N values were+71.8‰ in 2008 and+70.6‰ in 2009 (Table 1). The
10
seasonal pattern ofδ18O of NO−
3 was clear, with values reaching a minimum in July
or August. As a result, theδ18O values of NO−
3 were significantly higher in the cool
season than in the warm season for both study years (Fig. 2d, Table 2). The continental source precipitation had higherδ18O of NO−
3 than the marine source precipitation; the
continental source precipitation mainly occurred in the cool season that had shorter
15
daytime (Fig. 3).
4 Discussion
4.1 Nitrogen deposition
At our study site, NH+4 contributed an additional 14.9 kg N ha−1yr−1in 2008 and 21.8
kg N ha−1 yr−1in 2009 to N deposition in precipitation, respectively (data not shown).
20
ACPD
10, 21439–21474, 2010Anthropogenic imprints on nitrogen and oxygen isotopic
composition
Y. T. Fang et al.
Title Page
Abstract Introduction
Conclusions References
Tables Figures
◭ ◮
◭ ◮
Back Close
Full Screen / Esc
Printer-friendly Version Interactive Discussion
Discussion
P
a
per
|
Dis
cussion
P
a
per
|
Discussion
P
a
per
|
Discussio
n
P
a
per
|
Hawaii (Carrillo et al., 2002), we suggest that such high bulk N deposition at the study site can be an important N input to terrestrial and aquatic ecosystems therein and that elevated N deposition is mainly caused by increased human activities associated with industrialization and urbanization.
4.2 Seasonal pattern of N isotopes of NO−3
5
Our measurements ofδ15N of precipitation NO−
3 over the study period varied between
−4.9‰ and +10.1‰, with a total mean of +3.6‰ (Fig. 2, Table 1). These observed
values fall well within the wide range of previously reported values for atmospheric NO−
3 (Russell et al., 1998; Hastings et al., 2003; Heaton et al., 2004; Elliott et al.,
2007, 2009; Kendall et al., 2007; Savarino et al., 2007; Morin et al., 2009) and are
10
comparable to the results for urban or suburban sites in China (Table 4). Our results are higher than those in precipitation or particulate NO−
3 in two rural sites in Hebei in
northern China, most sites in Japan, over the Atlantic Ocean and the Pacific Ocean, and in polar regions (Table 4), where most values are negative. Our measured values ofδ15N of precipitation NO−
3 were generally higher than the reports for wet deposition 15
in the US (Elliott et al., 2007, 2009; Goodale et al., 2009 and references therein). For example, across 33 sites in the midwestern and northeastern US, δ15N of wet NO−
3
deposition ranged from −8.1 to +3.2‰, with a mean of −1.5‰ (Elliott et al., 2007, Table 4). A wider range ofδ15N of atmospheric NO−
3 was observed in Europe (Freyer,
1978, 1991; Yeatman et al., 2001; Widory, 2007).
20
Seasonality has been commonly reported for isotopic composition of atmospheric NO−
3 (Hastings et al., 2003; Elliott et al., 2007, 2009; Morin et al., 2008; Wankel et
al., 2010). The seasonal pattern ofδ15N seems to vary from site to site. In a study performed in the Arctic, temperature was found to be a major determinant ofδ15N-NO− 3
values in all seasons except spring when snowpack emissions are maximal (Morin et
25
al., 2008). Temperature was also found to influence significantly δ15N-NO−
3 in both
ACPD
10, 21439–21474, 2010Anthropogenic imprints on nitrogen and oxygen isotopic
composition
Y. T. Fang et al.
Title Page
Abstract Introduction
Conclusions References
Tables Figures
◭ ◮
◭ ◮
Back Close
Full Screen / Esc
Printer-friendly Version Interactive Discussion
Discussion
P
a
per
|
Dis
cussion
P
a
per
|
Discussion
P
a
per
|
Discussio
n
P
a
per
|
US, with lower values in summer months than in winter months (Elliott et al., 2009). By contrast, in Bermuda in the North Atlantic Ocean (Hastings et al., 2003) and in Eilat, Israel (Wankel et al., 2010), δ15N of atmospheric NO−
3 was significantly higher
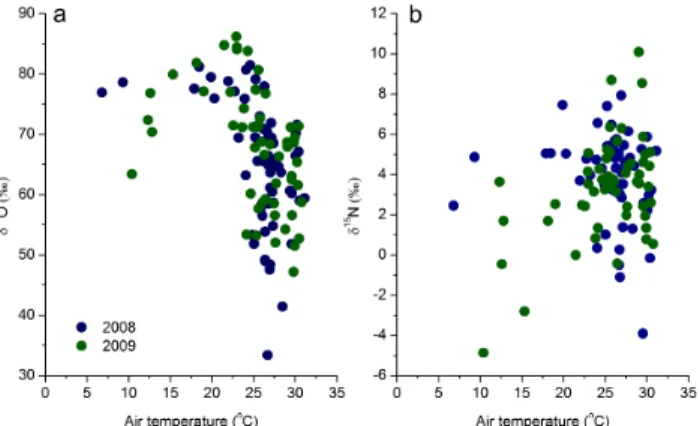
in the warmer season. The difference in pattern is likely to be a result of the shift in NOx sources for those studies. In the present study, δ15N-NO−
3 was correlated with 5
temperature only in 2009 (Fig. 5b). The highδ15N-NO−
3 values in coincidence with the
high temperatures observed in 2009 (Table 2) might be caused by the high demand for fossil fuel because of the intense preparations for the 16th Asian Games (see below).
The δ15N values of atmospheric NO−
3 were −7.1 to -1.6‰ (average −4‰) in the
low latitude regions of the Atlantic Ocean (between 45◦S and 45◦N) (Morin et al.,
10
2009). Baker et al. (2007) reported thatδ15N of atmospheric NO−
3 from those areas
ranged from −11 to +2.8‰ and averaged −3‰. A similar range (−14 to+1.8‰, av-erage−2.1‰ in the warm season and−5.9‰ in the cool season) was observed for
δ15N of rain NO−
3 in Bermuda in the North Atlantic Ocean (Hastings et al., 2003). The
δ15N values of precipitation NO−
3 in two Hawaiian islands in the Pacific Ocean were 15
reported to range narrowly from −3.8 to +2.4‰ (average, −0.03‰ and −2.9‰,
re-spectively) (Carrillo et al., 2002). In the present study, we initially expected that the precipitation samples collected from the sea would have similarδ15N values of NO−
3 to
those reported above.
We did observe a few negative values during storms in the summer of 2008, but most
20
values were positive during the study period (Fig. 2). Furthermore, we found that the averagedδ15N values were lower for precipitation from the continent than for that from the sea, particularly in 2009 (Table 3). Over the two study years,δ15N was+4.1‰ in precipitation from the sea, and was significantly (P =0.017) higher than +3.1‰ from the continent. The mean NO−3 concentration in the marine source precipitation (on
25
average 44 and 73 µmol L−1 in 2008 and 2009, respectively, Table 3) was far higher than the annual means (0.5 to 2 µmol L−1) in Hawaii (Carrillo et al., 2002). The high
δ15N values and concentrations of NO−
ACPD
10, 21439–21474, 2010Anthropogenic imprints on nitrogen and oxygen isotopic
composition
Y. T. Fang et al.
Title Page
Abstract Introduction
Conclusions References
Tables Figures
◭ ◮
◭ ◮
Back Close
Full Screen / Esc
Printer-friendly Version Interactive Discussion
Discussion
P
a
per
|
Dis
cussion
P
a
per
|
Discussion
P
a
per
|
Discussio
n
P
a
per
|
indicate the influence of anthropogenic NOxemissions (with15N/14N ratio) locally and from neighboring large cities to the south of Guangzhou (e.g., Hong Kong, Shenzhen, Dongguan, and Zhongshan) on the temporal pattern ofδ15N of NO−
3.
Theδ15N values of precipitation NO−
3 were obviously higher in the summer than in
other seasons in 2009, and the pattern was different from that in 2008. This difference
5
in seasonal pattern between 2008 and 2009 may have resulted from two factors. One is the different precipitation regime; there was a larger amount of precipitation in 2008 than in 2009, and precipitation was concentrated in May and June, which might have blown N-bearing pollutants over the study city away and replaced the atmosphere with relatively clean air masses. This is supported by the lower N input in precipitation in
10
2008 than in 2009 (Table 2) and the clear seasonal fluctuation of precipitation NO−3 in 2008. The other is human activity. In 2008, many manufacturers in Guangzhou and the Pearl River Delta were severely affected by the global financial crisis starting from 2007. Nevertheless, the economy recovered and was stimulated by the intensive preparations for the 16th Asian Games. The gross domestic product of Guangzhou
15
City is 11.5% higher in 2009 than in 2008 (http://www.gemc.gov.cn/). In the present study, we observed strong correlations between δ15N of NO−
3 and concentrations of
NO−3 (Fig. 6) and SO24− (data not shown) in 2009, indicating the importance of air pollution in controllingδ15N of precipitation NO−
3. Such strong correlations have also
been noted for precipitation across 33 sites in midwestern and northeastern US (Elliott
20
et al., 2007).
4.3 Partition of NOxsources using N isotopes of NO−3
Theδ15N values of NOxfrom anthropogenic sources (e.g., fossil fuel combustion) have been reported to be much more positive than those from natural sources, although a few studies showed negative values (Table 4). Furthermore, NOx from coal power
25
ACPD
10, 21439–21474, 2010Anthropogenic imprints on nitrogen and oxygen isotopic
composition
Y. T. Fang et al.
Title Page
Abstract Introduction
Conclusions References
Tables Figures
◭ ◮
◭ ◮
Back Close
Full Screen / Esc
Printer-friendly Version Interactive Discussion
Discussion
P
a
per
|
Dis
cussion
P
a
per
|
Discussion
P
a
per
|
Discussio
n
P
a
per
|
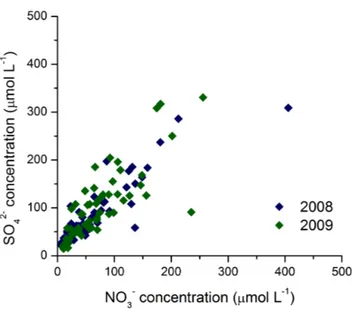
that the source of NOxis predominantly fossil fuel combustion in Guangzhou City, par-ticularly coal combustion, because coal is commonly used to generate electricity in this economically developing zone. This speculation is further supported by a strong cor-relation of NO−3 concentration with SO24− concentration in precipitation (Fig. 4), which suggests that NOx and SO2 may be produced simultaneously through S-containing
5
coal combustion as vehicles emit negligible SO2 relative to coal combustion sources. A bottom-up inventory revealed that in China, more than 70% of the total NOxemission was from coal combustion (Tian et al., 2001).
If we assume that the precipitation NO−3 at our study site has only two sources, an-thropogenic (NOx emissions principally from fossil fuel combustion) and natural (e.g.,
10
lightning and biogenic emissions), and thatδ15Nanthropogenic is+10.1‰ (the maximum value of the study period) andδ15Nnatural is −4.9‰ (the minimum value), we can at-tempt to separate the relative contribution of each source to the total NO−
3 deposition
for each sampling event and each year using the simple two-end-member model. Cal-culations show that 59% and 55% of precipitation NO−3 in 2008 and 2009, respectively,
15
were from an anthropogenic source. However, this estimate is tentative; atmospheric NO−
3 originates from the oxidation of NO and variations in theδ
15N values of NO− 3 may
reflect the variation ofδ15N of source NOx, but the variation of δ15N of NO−
3 are also
influenced by the15N partition within NOxand/or the isotopic fractionation arising from the conversion of NO2to NO−
3 or the transport of atmospheric NO −
3 itself (Morin et al., 20
2009). It is difficult to assess these uncertainties with the present data. However, such an estimate can provide an insight into the change in the contribution of anthropogenic emissions with time (Hastings et al., 2003).
The anthropogenic contribution to total NO−3 deposition discussed above is likely underestimated because such a high NO−3 deposition in the study city must directly
25
ACPD
10, 21439–21474, 2010Anthropogenic imprints on nitrogen and oxygen isotopic
composition
Y. T. Fang et al.
Title Page
Abstract Introduction
Conclusions References
Tables Figures
◭ ◮
◭ ◮
Back Close
Full Screen / Esc
Printer-friendly Version Interactive Discussion
Discussion
P
a
per
|
Dis
cussion
P
a
per
|
Discussion
P
a
per
|
Discussio
n
P
a
per
|
from fuel combustion (both coal combustion and vehicle exhaust) also have negative values (Table 4). Meanwhile, theδ15Nnaturalvalue used in the estimation may be higher than the actual value, although it is very similar to the lowest record of−3.8‰ in rain NO−3 in Hawaii (Carrillo et al., 2002). A bottom-up inventory conducted in the Pearl River Delta showed that 46% and 41% of the total NOx emissions in 2006 were from
5
power plant and mobile sources, respectively, and that the industry was responsible for an additional 12% (Zheng et al., 2009). In that inventory, however, the contributions of biogenic sources and lightning were not included (Zheng et al., 2009). A top-down inventory constructed using an inversion approach with a global 3-D chemical transport model (GEOS-Chem) showed that fossil fuel and biofuel combustion accounted for
10
77% and 12% of the total NOx emissions over east China, respectively, and the rest (11%) was accounted for by biomass burning, microbial sources, and lightning (Wang et al., 2007).
4.4 Oxygen isotopes of NO−3
In this study,δ18O of precipitation NO−
3 ranged from+33.4 to+86.2‰, with an average 15
of +66.3‰ (Table 1). Relatively low values were reported for δ18O of atmospheric NO−3 using the AgNO−3 method (non-denitrifier) compared to those using the denitrifier method (for more details, see Kendall et al., 2007). The values obtained in the present study lie within the broad range of previously reported values obtained with the same method as what we used (Hastings et al., 2003, 2007; Elliott et al., 2007, 2009; Kendall
20
et al., 2007; Morin et al., 2008, 2009; Tsunogai et al., 2010). However, the annual mean values ofδ18O were lower than those of previous studies performed in high latitude and polar regions and our data fell in the low end of the reported range of the world.
The δ18O values of atmospheric NO−
3 varied from +59.6 to +114.4‰ in coastal
Antarctica (66◦40′S, 140◦01′E), with averages of
+63.2‰ in January to March,
25
ACPD
10, 21439–21474, 2010Anthropogenic imprints on nitrogen and oxygen isotopic
composition
Y. T. Fang et al.
Title Page
Abstract Introduction
Conclusions References
Tables Figures
◭ ◮
◭ ◮
Back Close
Full Screen / Esc
Printer-friendly Version Interactive Discussion
Discussion
P
a
per
|
Dis
cussion
P
a
per
|
Discussion
P
a
per
|
Discussio
n
P
a
per
|
in the island of Rishiri, northern Japan (45.2◦N, Tsunogai et al., 2010). Our results are slightly lower than those reported for Bermuda, which has a low latitude (32.27◦N, 64.87◦W), where theδ18O values of NO−
3 ranged from +60.3 to +86.5‰, averaging
68.6‰ in the warm season and +76.9‰ in the cool season (Hastings et al., 2003), and across the region of Ohio, New York, and Pennsylvania in the U.S. where theδ18O
5
values of NO−3 ranged from+45.2 to+94.0‰ with mean values of+77.4‰ for HNO3 vapor and+75.2‰ for particulate NO−
3 (Elliott et al., 2009). The relatively low δ 18
O values in our study suggest the importance of the OH radical pathway in forming at-mospheric NO−3 (through which O3donates less O atoms to NO−3 than that through the N2O5 pathway; see Introduction), due in part to the long summer time and maybe the
10
strong solar radiation. This speculation is consistent with the results obtained based on a global model of∆17O of atmospheric NO−3; NO−3 production via the OH pathway pre-dominates (up to 87%) in the tropics where OH concentration is the highest (Alexander et al., 2009).
The seasonality of these NO−3 formation pathways is a function of both temperature
15
(N2O5 is thermally decomposed) and solar radiation (OH is photolytically produced). This chemical fingerprint of δ18O of NO−
3 by O3 has been used to characterize the
predominance of multiple chemical pathways (Savarino et al., 2007; Jarvis et al., 2008; Morin et al., 2008). In the present study, the warm season averages of+63.5‰ and
+66.4‰ in 2008 and 2009, respectively, were significantly higher than the cool season
20
averages of 73.2‰ and 73.0‰ (Table 2). As expected, temperature well controlsδ18O of NO−
3 (Fig. 5a). When air temperature was below 23◦C,δ 18
O of NO−
3 was higher than
70‰. However, a large variation was noted when the temperature was above 23◦C. We found no relationship between δ18O and solar radiation (data not shown). We initially expected that the seasonal fluctuation would be small due to the relatively equal
25
ACPD
10, 21439–21474, 2010Anthropogenic imprints on nitrogen and oxygen isotopic
composition
Y. T. Fang et al.
Title Page
Abstract Introduction
Conclusions References
Tables Figures
◭ ◮
◭ ◮
Back Close
Full Screen / Esc
Printer-friendly Version Interactive Discussion
Discussion
P
a
per
|
Dis
cussion
P
a
per
|
Discussion
P
a
per
|
Discussio
n
P
a
per
|
in coastal Antarctica (Savarino et al., 2007) and greater than those in middle and high latitude areas (Hastings et al., 2003; Elliott et al., 2009; Tsunogai et al., 2010). The reasons remain unclear and further research is required.
Using the minimum and maximum of δ18O reported for O3 (+90 to +122‰) and OH (−30 to +2‰), one can expect that the δ18O value of atmospheric NO−
3 will fall 5
between+50‰ (assuming 2/3 oxygen atoms from O3 and 1/3 from OH) and+102‰ (assuming 5/6 oxygen atoms from O3and 1/6 from OH) (see Hastings et al., 2003). In this study, we observed a fewδ18O values that were lower than+50‰, with the lowest being+33‰ (Fig. 1d). This, so far, is among the lowest ever reported in the world.
As stated previously, the OH pathway and the N2O5pathway are the main channels
10
for atmospheric NO−
3 formation. Globally, 76% and 18% of annual inorganic NO − 3 are
formed via the OH pathway and the N2O5 pathway, respectively, based on a global model of ∆17O of atmospheric NO−
3. At night, NO3 can also react with
dimethylsul-fide (DMS) or hydrocarbons (HC), termed the DMS/HC pathway here. This pathway accounts for 4% of the annual inorganic NO−3 on the global scale. Atmospheric NO−3
15
induced via the DMS/HC pathway will probably have higher δ18O values than those induced via the OH pathway and the N2O5pathway. In addition, NOxcan interact with halogen oxides, such as bromine oxide (BrO), to form bromine nitrate (BrONO2) and this in turn can be hydrolyzed to NO3(Morin et al., 2008; Alexander et al., 2009). This pathway is particularly important in polar areas in spring when photochemically driven
20
emissions of reactive N from the snowpack into the atmosphere make the local oxida-tion of NOx by bromine oxide the major contributor to the NO−
3 budget (Morin et al.,
2008; Alexander et al., 2009). The atmospheric NO−
3 induced by this pathway will have
aδ18O value similar to that of O3, for BrO is expected to have a largeδ18O value due to the involvement of O3in BrO formation. Thus, the last two pathways cannot explain
25
theδ18O values of NO−
3 below+50‰ in our study.
One possible explanation for the lowδ18O values of NO−
3 is the reaction of NO with
ACPD
10, 21439–21474, 2010Anthropogenic imprints on nitrogen and oxygen isotopic
composition
Y. T. Fang et al.
Title Page
Abstract Introduction
Conclusions References
Tables Figures
◭ ◮
◭ ◮
Back Close
Full Screen / Esc
Printer-friendly Version Interactive Discussion
Discussion
P
a
per
|
Dis
cussion
P
a
per
|
Discussion
P
a
per
|
Discussio
n
P
a
per
|
convert NO into NO2(Reactions R7 and R8).
OH+CO+O2→CO2+HO2 (R7)
HO2+NO→NO2+OH (R8)
Peroxy radicals are important intermediates in atmospheric photo-oxidant formation. They arise from the oxidation of carbon monoxide (CO) and volatile organic compounds
5
(VOC) by OH radicals, NO3 radicals, halogen atoms, and O3. The δ18O of peroxy radicals is expected to be much lower than that of O3 as the O atoms should come from atmospheric O2 (δ18O= +23.5‰, see Hastings et al., 2003). This phenomenon very likely occurs in our study city that has complex air pollution, because CO is also a major air pollutant (Hua et al., 2008; Liu et al., 2008; Zhang et al., 2008a; Shao et al.,
10
2009).
5 Conclusions
We demonstrated the seasonal variations of N and O isotopic composition of precip-itation NO−
3 in Guangzhou, a severely N-polluted city in China, in an effort to better
understand the spatial and seasonal variability of atmospheric NOx sources and the
15
formation pathways in this city. We can draw several conclusions from our observa-tions. (1) Positive nitrateδ15N values were observed throughout the year, indicating the importance of NOx emissions from coal combustion. Different seasonal patterns ofδ15N-NO−
3 were observed between 2008 and 2009, which reflected different human
activities associated with the global financial crisis and the intensive preparations for
20
the 16th Asian Games. (2) The anthropogenic NOx source accounted for 59% and 55% of the total precipitation NO−3 input in 2008 and 2009, respectively, based on an isotope model. Nevertheless, this may be an underestimation. (3) The observed range ofδ18O-NO−
3 values from+33.4‰ to+86.5‰ was lower than those reported for high
altitude and polar areas, underscoring the importance of OH radicals in the formation
ACPD
10, 21439–21474, 2010Anthropogenic imprints on nitrogen and oxygen isotopic
composition
Y. T. Fang et al.
Title Page
Abstract Introduction
Conclusions References
Tables Figures
◭ ◮
◭ ◮
Back Close
Full Screen / Esc
Printer-friendly Version Interactive Discussion
Discussion
P
a
per
|
Dis
cussion
P
a
per
|
Discussion
P
a
per
|
Discussio
n
P
a
per
|
of atmospheric NO−
3 due to the relative long summer. Several δ
18O values that were
lower than the expected minimum of +50‰ at our study site likely resulted from the reaction of NO with peroxy radicals; peroxy radicals can compete with O3 to convert NO to NO2, thereby donate O atoms with much lower δ18O values than that of O3 to atmospheric NO−3.
5
Acknowledgements. This work was supported by the National Natural Science Foundation of China (Nos. 30725006, 40703030, 30972365, U0833001, and 40875076), Guangdong Natural Science Foundation of China (No. 8151065005000016), a grant-in-aid for scientific research from Japan Society for Promotion of Science (JSPS) (No. 21310008), Grant for Projects for the Protection, Preservation & Restoration of Cultural Properties in Japan by The Sumitomo
10
Foundation, Grants-in-Aid for Creative Scientific Research (Nos. 18380093 and 20780113), the Program to Create an Independent Research Environment for Young Researchers from the Ministry of Education, Culture, Sports, Science and Technology, Japan, and the National Program on Key Basic Research Project of China (No. 2010CB428504). Y. T. Fang was sup-ported by the JSPS with a Postdoctoral Fellowship for Foreign Researchers and a grant-in-aid
15
for JSPS Fellows (No. 20-08421). We acknowledge Qiaojun Chen for drawing the backward air mass trajectories.
References
Aber, J. D., McDowell, W., Nadelhoffer, K., Magill, A., Berntson, G., Kamakea, M., McNulty, S., Currie, W., Rustad, L., and Fernandez, I.: Nitrogen saturation in temperate forest ecosystems
20
– hypothesis revisited, BioScience, 48, 921–934, 1998.
Alexander, B., Hastings, M. G., Allman, D. J., Dachs J., Thornton J. A., and Kunasek, S. A.: Quantifying atmospheric nitrate formation pathways based on a global model of the oxygen isotopic composition (∆17O) of atmospheric nitrate, Atmos. Chem. Phys., 9, 5043–5056, doi:10.5194/acp-9-5043-2009, 2009.
25
ACPD
10, 21439–21474, 2010Anthropogenic imprints on nitrogen and oxygen isotopic
composition
Y. T. Fang et al.
Title Page
Abstract Introduction
Conclusions References
Tables Figures
◭ ◮
◭ ◮
Back Close
Full Screen / Esc
Printer-friendly Version Interactive Discussion
Discussion
P
a
per
|
Dis
cussion
P
a
per
|
Discussion
P
a
per
|
Discussio
n
P
a
per
|
Baker, A. R., Westin, K., Kelly, S. D., Voss, M., Streu, P., and Cape, J. N.: Dry and wet deposition of nutrients from the tropical Atlantic atmosphere: Links to primary productivity and nitrogen fixation, Deep Sea Res., Part I, 54, 1704–1720, 2007.
Calvert, J. G., Lazrus, A., Kok, G. L., Heikes, B. G., Walega, J. G., Lind, J., and Cantrell, C. A.: Chemical mechanisms of acid generation in the troposphere, Nature, 317, 27–35, 1985.
5
Cao, Y. Z., Wang, S. Y., Zhang, G.,Luo, J. Y., and Lu, S. Y.: Chemical characteristic and source assessment of wet precipitation at Mountain Baiyun, Guangzhou, (in Chinese with English abstract), The Administ. Tech. Environ. Monit., 21(6), 20–23, 2009.
Carrillo, J. H., Hastings, M. G., Sigman, D. M., and Huebert, B. J.: Atmospheric deposition of inorganic and organic nitrogen and base cations in Hawaii, Global Biogeochem. Cy., 16(4),
10
1076, doi:10.1029/2002GB001892, 2002.
Casciotti, K. L., B ¨ohlke, J. K., McIlvin, M. R., Mroczkowski, S. J., and Hannon, J. E.: Oxygen isotopes in nitrite: Analysis, calibration, and equilibration, Anal. Chem., 79(6), 2427–2436, 2007.
Casciotti, K. L., Sigman, D. M., Hastings M. G., B ¨ohlke, J. K., and Hilkert, A.: Measurement
15
of the oxygen isotopic composition of nitrate in seawater and freshwater using the denitrifier method, Anal. Chem., 74(19), 4905–4912, doi:10.1021/ac020113w, 2002.
Draxler, R. R. and Rolph, G. D.: HYSPLIT (HYbrid Single-Particle Lagrangian Integrated Tra-jectory) Model access via NOAA ARL READY Website (http://ready.arl.noaa.gov/HYSPLIT. php), NOAA Air Resources Laboratory, Silver Spring, MD, USA, 2010.
20
Ehhalt, D., Prather, M., Dentener, F., Derwent, R., Dlugokencky, E., Holland, E., Isaksen, I., Katima, J., Kirchhoff, V., Matson, P., Midgley, P., and Wang, M.: Atmospheric chemistry and greenhouse gases. In Climate Change 2001: The Scientific Basis. Contribution of Working Group I to the Third Assessment Report of the Intergovernmental Panel on Climate Change, edited by: Houghton, J. T., Ding, Y., Griggs, D. J., Noguer, M., van der Linden, P. J., Dai, K.,
25
Maskell, K., Johnson, C. A., Cambridge University Press, New York, USA, 2001.
Elliott, E. M., Kendall, C., Boyer, E. W., Burns, D. A., Lear, G. G., Golden, H. E., Harlin, K., Bytnerowicz, A., Butler, T. J., and Glatz, R.: Dual nitrate isotopes in dry deposition: Utility for partitioning NOxsource contributions to landscape nitrogen deposition, J. Geophys. Res., 114, G04020, doi:10.1029/2008JG000889, 2009.
30
Tech-ACPD
10, 21439–21474, 2010Anthropogenic imprints on nitrogen and oxygen isotopic
composition
Y. T. Fang et al.
Title Page
Abstract Introduction
Conclusions References
Tables Figures
◭ ◮
◭ ◮
Back Close
Full Screen / Esc
Printer-friendly Version Interactive Discussion
Discussion
P
a
per
|
Dis
cussion
P
a
per
|
Discussion
P
a
per
|
Discussio
n
P
a
per
|
nol., 41(22), 7661–7667, 2007.
Fang, Y. T., Gundersen, P., Zhu, W. X., Mo, J. M.: Input and output of dissolved organic and inor-ganic nitrogen in subtropical forests of South China under high air pollution, Biogeosciences, 5, 339–352, doi:10.5194/bg-5-339-2008, 2008.
Freyer, H. D.: Seasonal variation of15N/14N ratios in atmospheric nitrate species, Tellus, Ser.
5
B, 43, 30–44, 1991.
Freyer, H.: Seasonal trend of NH+4 and NO−
3 nitrogen isotope composition in rain collected at Julich, Germany, Tellus, 30(1), 83–92, 1978.
Fukuzaki, N. and Hayasaka, H.: Seasonal variations of nitrogen isotopic ratios of ammonium and nitrate in precipitations collected in the Yahiko–Kakuda mountain area in Niigata
Prefec-10
ture, Japan, Water Air Soil Pollut., 203, 391–397, 2009.
Galloway, J. N., Dentener, F. J., Capone, D. G., Boyer, E. W., Howarth, R. W., Seitzinger, S. P., Asner, G. P., Cleveland, C. C., Green, P. A., Holland, E. A., Karl, D. M., Michaels, A. F., Porter, J. H., Townsend, A. R., and Vorosmarty, C. J.: Nitrogen cycles: Past, present, and future, Biogeochemistry, 70, 153–226, doi:10.5194/bg-70-153-2004, 2004.
15
Galloway, J. N., Townsend, A. R., Erisman, J. W., Bekunda, M., Cai, Z., Freney, J. R., Martinelli, L. A., Seitzinger, S. P., and Sutton, M. A.: Transformation of the nitrogen cycle: recent trends, questions, and potential solutions, Science, 320, 889–892, 2008.
Goodale, C. L., Thomas, S. A., Fredriksen, G., Elliott, E. M., Flinn, K. M., Butler, T. J., and Walter, M. T.: Unusual seasonal patterns and inferred processes of nitrogen retention
20
in forested headwaters of the Upper Susquehanna River, Biogeochemistry, 93, 197–218, doi:10.5194/bg-93-197-2009, 2009.
Gundersen, P., Emmett, A., Kjønaas, O. J., Koopmans, C. J., and Tietema, A.: Impact of nitrogen deposition on nitrogen cycling in forest: a synthesis of NITREX data, For. Ecol. Manag. 101, 37–55, 1998.
25
Hastings, M. G., Sigman, D. M., and Lipschultz, F.: Isotopic evidence for source changes of nitrate in rain at Bermuda, J. Geophys. Res., 108(D24), 4790, doi:10.1029/2003JD003789, 2003.
Hastings, M. G., Steig, E. J., and Sigman, D. M.: Seasonal variations in N and O isotopes of nitrate in snow at Summit, Greenland: Implications for the study of nitrate in snow and ice
30
cores, J. Geophys. Res., 109, D20306, doi:10.1029/2004JD004991, 2004.
ACPD
10, 21439–21474, 2010Anthropogenic imprints on nitrogen and oxygen isotopic
composition
Y. T. Fang et al.
Title Page
Abstract Introduction
Conclusions References
Tables Figures
◭ ◮
◭ ◮
Back Close
Full Screen / Esc
Printer-friendly Version Interactive Discussion
Discussion
P
a
per
|
Dis
cussion
P
a
per
|
Discussion
P
a
per
|
Discussio
n
P
a
per
|
Heaton, T. H. E.: 15N/14N ratios of NOx from vehicle engines and coal-fired power stations, Tellus, Ser. B, 42, 304–307, 1990.
Hoering, T.: The isotopic composition of the ammonia and the nitrate ion in rain, Geochim. Cosmochim. Acta, 12(1–2), 97–102, 1957.
Hua, W., Chen, Z. M., Jie, C. Y., Kondo, Y., Hofzumahaus, A., Takegawa, N., Chang, C. C.,
5
Lu, K. D., Miyazaki, Y., Kita, K., Wang, H. L., Zhang, Y. H., and Hu, M.: Atmospheric hy-drogen peroxide and organic hydroperoxides during PRIDE-PRD’06, China: their concentra-tion, formation mechanism and contribution to secondary aerosols, Atmos. Chem. Phys., 8, 6755–6773, doi:10.5194/acp-8-6755-2008, 2008.
Huang, D. Y., Xu, Y. G., Peng, P. A., Zhang, H. H., and Lan, J. B.: Chemical composition
10
and seasonal variation of acid deposition in Guangzhou, South China: Comparison with precipitation in other major Chinese cities, Environ. Pollut., 157, 35–41, 2009.
Jarvis, J. C., Steig, E. J., Hastings, M. G., and Kunasek, S. A.: Influence of local pho-tochemistry on isotopes of nitrate in Greenland snow, Geophys. Res. Lett., 35, L21804, doi:10.1029/2008GL035551, 2008.
15
Kendall, C., Elliott, E. M., and Wankel, S. D.: Tracing anthropogenic inputs of nitrogen to ecosys-tem, in: Stable Isotopes in Ecology and Environmental Science, edited by: Lajtha, K. and Michener, R. H., 2nd edition, Wiley-Blackwell Scientific Publication 375–449, 2007.
Kiga, T., Yoshikawa K., Tsunogai, U., Okitsu, S., and Narukawa, K.: Evaluation of NOxformation in pulverized coal firing by use of nitrogen isotope ratios, paper presented at International
20
Joint Power Generation Conference, Am. Soc. Mech. Eng., Miami Beach, FL, USA, 23–26 July, 2000.
Koba, K., Fang, Y. T., Mo, J.M., Zhang, W., Lu, X. K., Liu, L., Zhang, T., Takebayashi, Y., Toyoda, S., and Yoshida, N.:15N natural abundance in a nitrogen-saturated subtropical forest in southern China: Does a nitrogen-saturated forest lose14N preferentially? Ecosystems,
25
under review, 2010.
Kurata, H.: Nitrogen isotope composition in atmospheric deposition – annual, seasonal and regional variation. Master’s thesis, Tokyo University of Agriculture and Technology, Fuchu, Tokyo, 2002.
Li, D. J. and Wang, X. X.: Nitrogen isotopic signature of soil-released nitric oxide (NO) after
30
fertilizer application, Atmos. Environ., 42, 4747–4754, 2008.
ACPD
10, 21439–21474, 2010Anthropogenic imprints on nitrogen and oxygen isotopic
composition
Y. T. Fang et al.
Title Page
Abstract Introduction
Conclusions References
Tables Figures
◭ ◮
◭ ◮
Back Close
Full Screen / Esc
Printer-friendly Version Interactive Discussion
Discussion
P
a
per
|
Dis
cussion
P
a
per
|
Discussion
P
a
per
|
Discussio
n
P
a
per
|
United States, and export fluxes to the global atmosphere, J. Geophys. Res., 103(D11), 13435–13450, doi:10.1029/97JD03126, 1998.
Liu, J. F., Song, Z. G., and Xu, T.: Study on ionic composition of rainwater at Guangzhou and the primary factors of rainwater acidity, Environ. Sci., 27(10), 1998–2002, 2006.
Liu, J. Q., Keene, W. C., and Wu, G. P.: Study of precipitation background value in Lijiang,
5
China, China Environ. Sci. 13, 246–251, 1993.
Liu, Y., Shao, M., Lu, S. H., Chang, C. C., Wang, J. L., and Chen, G.: Volatile organic compound (VOC) measurements in the Pearl River Delta (PRD) region, China, Atmos. Chem. Phys., 8, 1531–1545, doi:10.5194/acp-8-1531-2008, 2008.
Michalski, G., Scott, Z., Kabiling, M., and Thiemens, M. H.: First measurements
10
and modeling of ∆17O in atmospheric nitrate, Geophys. Res. Lett., 30(16), 1870, doi:10.1029/2003GL017015, 2003.
Moore, H.: The isotopic composition of ammonia, nitrogen dioxide, and nitrate in the atmo-sphere, Atmos. Environ., 11, 1239–1243, 1977.
Morin, S., Savarino, J., Frey, M. M., Domine, F., Jacobi, H. W., Kaleschke, L., and Martins, J. M.
15
F.: Comprehensive isotopic composition of atmospheric nitrate in the Atlantic Ocean bound-ary layer from 65◦S to 79◦N, J. Geophys. Res., 114, D05303, doi:10.1029/2008JD010696, 2009.
Morin, S., Savarino, J., Frey, M. M., Yan, N., Bekki, S., Bottenheim, J. W., and Martins, J. M. F.: Tracing the origin and fate of NOx in the arctic atmosphere using stable isotopes in nitrate,
20
Science, 322(5902), 730–732, 2008.
Pearson, J., Wells, D. M., Seller, K. J., Bennett, A., Soares, A., Woodall, J., and Ingrouille, M. J.: Traffic exposure increases natural15N and heavy metal concentrations in mosses, New Phytol., 147, 317–326, 2000.
Quan, W. Z., Feng, S. Y., and Lu, X. A.: Current status and tendency of acid rain in Guangzhou
25
City, Shanghai, (in Chinese), Environ. Sci., 11(1), 20–23, 1992.
Russell, K. M., Galloway, J. N., Macko, S. A., Moody, J. L., and Scudlark, J. R.; Sources of nitrogen in wet deposition to the Chesapeake Bay region, Atmos. Environ., 32, 2453–2465, 1998.
Savarino, J., Kaiser, J., Morin, S., Sigman, D. M., and Thiemens, M. H.: Nitrogen and oxygen
30
isotopic constraints on the origin of atmospheric nitrate in coastal Antarctica, Atmos. Chem. Phys., 7(8), 1925–1945, doi:10.5194/acp-7-1925-2007, 2007.
ACPD
10, 21439–21474, 2010Anthropogenic imprints on nitrogen and oxygen isotopic
composition
Y. T. Fang et al.
Title Page
Abstract Introduction
Conclusions References
Tables Figures
◭ ◮
◭ ◮
Back Close
Full Screen / Esc
Printer-friendly Version Interactive Discussion
Discussion
P
a
per
|
Dis
cussion
P
a
per
|
Discussion
P
a
per
|
Discussio
n
P
a
per
|
Ground-level ozone in the Pearl River Delta and the roles of VOC and NOxin its production, J. Environ. Manag., 90(1), 512–518, 2009.
Sigman, D. M., Casciotti, K. L., Andreani, M., Barford, C., Galanter, M., and B ¨ohlke, J. K.: A bacterial method for the nitrogen isotopic analysis of nitrate in seawater and freshwater, Anal. Chem., 73(17), 4145–4153, 2001.
5
Tian, H. Z., Hao, J. M., Lu, Y. Q., and Zhu, T. L.: Inventories and distribution characteristics of NOx emissions in China, (in Chinese with English abstract), China Environ. Sci., 21(6), 493-497, 2001.
Tobari, Y., Koba, K., Fukushima, K., Tokuchi, N., Ohte, N., Tateno, R., Toyoda, S., Yoshioka, T., and Yoshida, N.: Contribution of atmospheric nitrate to stream-water nitrate in Japanese
10
coniferous forests revealed by oxygen isotope ratio of nitrate, Rapid Commun. Mass. Spec-trom. 24, 91281–1286, 2010.
Tsunogai, U., Komatsu, D. D., Daita, S., Kazemi, G. A., Nakagawa, F., Noguchi, I., and Zhang, J.: Tracing the fate of atmospheric nitrate deposited onto a forest ecosystem in Eastern Asia using∆17O. Atmos. Chem. Phys. 10, 1809–1820, 2010.
15
Vitousek, P. M., Aber, J. D., Howarth, R. W., Likens, G. E., Matson, P. A., Schindler, D. W., Schlesinger, W. H., and Tilman, D. G.: Human alteration of the global nitrogen cycle: Sources and consequences, Ecol. Appl., 7, 737–750, 1997.
Wang, H. K., Fu, L. X., Zhou, Y., Du, X., and Ge, W. H.: Trends in vehicular emissions in China’s mega cities from 1995 to 2005, Environ. Pollut., 158, 394–400, 2010.
20
Wang, T., Poon, C. N., Kwok, Y. H., and Li, Y. S.: Characterizing the temporal variability and emission patterns of polluting plumes in the Pearl River Delta of China, Atmos. Environ. 37, 3539–3550, 2003.
Wang, Y., McElroy, M. B., Martin, R. V., Streets, D. G., Zhang, Q., and Fu, T. M.: Sea-sonal variability of NOx emissions over east China constrained by satellite
observa-25
tions: Implications for combustion and microbial sources, J. Geophys. Res., 112, D06301, doi:10.1029/2006JD007538, 2007.
Wankel, S. D., Chen, Y., Kendall, C., Post, A. F., and Paytan, A.: Sources of aerosol nitrate to the Gulf of Aqaba: Evidence fromδ15N andδ18O of nitrate and trace metal chemistry, Mar. Chem., 120(1–4), 90–99, 2010.
30
Widory, D.: Nitrogen isotopes: Tracers of origin and processes affecting PM10 in the atmo-sphere of Paris. Atmos. Environ., 41, 2382–2390, 2007.