NHESSD
3, 4315–4352, 2015Evaluation of coastal vulnerability to
flooding in Emilia-Romagna, Italy
L. Perini et al.
Title Page
Abstract Introduction
Conclusions References
Tables Figures
◭ ◮
◭ ◮
Back Close
Full Screen / Esc
Printer-friendly Version
Interactive Discussion
Discussion
P
a
per
|
Discussion
P
a
per
|
Discussion
P
a
per
|
Discussion
P
a
per
|
Nat. Hazards Earth Syst. Sci. Discuss., 3, 4315–4352, 2015 www.nat-hazards-earth-syst-sci-discuss.net/3/4315/2015/ doi:10.5194/nhessd-3-4315-2015
© Author(s) 2015. CC Attribution 3.0 License.
This discussion paper is/has been under review for the journal Natural Hazards and Earth System Sciences (NHESS). Please refer to the corresponding final paper in NHESS if available.
Evaluation of coastal vulnerability to
flooding: comparison of two di
ff
erent
methodologies adopted by the
Emilia-Romagna Region (Italy)
L. Perini1, L. Calabrese1, G. Salerno1, P. Ciavola2, and C. Armaroli2
1
Geological, Seismic and Soil Service of the Emilia-Romagna Region, viale della Fiera 8, 40127 Bologna, Italy
2
Department of Physics and Earth Sciences, University of Ferrara, via Saragat 1, 44122 Ferrara, Italy
Received: 14 March 2015 – Accepted: 02 June 2015 – Published: 07 July 2015 Correspondence to: C. Armaroli ([email protected])
NHESSD
3, 4315–4352, 2015Evaluation of coastal vulnerability to
flooding in Emilia-Romagna, Italy
L. Perini et al.
Title Page
Abstract Introduction
Conclusions References
Tables Figures
◭ ◮
◭ ◮
Back Close
Full Screen / Esc
Printer-friendly Version
Interactive Discussion
Discussion
P
a
per
|
Discussion
P
a
per
|
Discussion
P
a
per
|
Discussion
P
a
per
Abstract
This paper aims at presenting and comparing two methodologies adopted by the Emilia-Romagna Region, northern Italy, to evaluate coastal vulnerability and to produce hazard and risk maps for coastal floods, in the framework of the EU Floods Directive. The first approach was adopted before the Directive had been issued. Three scenarios
5
of damage were designed (1, 10, 100-year return periods), produced by the concurrent happening of a storm, high surge levels and high water spring tidal levels. Wave heights were used to calculate run-up values along 187 equally spaced profiles and these were added to the tidal and atmospheric water level contributions. The result is a list of ten vulnerability typologies. To satisfy the requests of the Directive, the Geological,
10
Seismic and Soil Service (SGSS) recently implement a different methodology that considers three scenarios (10, 100 and >100-year return periods) in terms of set-up (not including run-set-up) plus the contribution of surge levels as well as the High Water Springs. The flooded area extension is determined by a series of computations that are part of a model built into ArcGIS®. The model uses as input a high resolution Lidar
15
DEM that is then processed using the Cost-Distance tool of ArcGIS®. Inundation maps are then overlapped to land use maps to produce risk maps. The qualitative validation and the comparison between the two methods are also presented, showing a positive agreement.
1 Introduction
20
Climate change, sea level rise and their impact on humans and the environment is a key issue that was, and is still, addressed at European level by many EU funded projects within the 7th European Union Research Framework (Quevauviller, 2011). Likewise, in the newly born H2020 EU research framework a large investment will be made on improving the understanding of the risk posed to the EU population and economy
25
NHESSD
3, 4315–4352, 2015Evaluation of coastal vulnerability to
flooding in Emilia-Romagna, Italy
L. Perini et al.
Title Page
Abstract Introduction
Conclusions References
Tables Figures
◭ ◮
◭ ◮
Back Close
Full Screen / Esc
Printer-friendly Version
Interactive Discussion
Discussion
P
a
per
|
Discussion
P
a
per
|
Discussion
P
a
per
|
Discussion
P
a
per
|
approach (Source–Pathway–Receptor–Consequence, Jimenez et al., 2008; Zanuttigh, 2011) is frequently used to evaluate flood issues. The storm component (source) is put in relation with the receptor (the coastal area) through numerical modelling able to evaluate the extent of flooding (Barredo et al., 2008; Zanuttigh et al., 2011; Wadey et al., 2012; Villatoro et al., 2013). This includes the evaluation of defence failure and
5
breaching (Wadey et al., 2012; Villatoro et al., 2013), the impact of the overflow of freshwater canals (Villatoro et al., 2013), the importance of flow through underground pipes (Sto. Domingo et al., 2010). The main challenge when actually drawing flood hazard maps is how to couple information on the total water level components (i.e. waves, run-up, surge, tide, sea level rise) with the terrain characteristics of the coastal
10
area and hinterland zones. The need for high resolution digital elevation models (DEMs), when available, is agreed among experts worldwide and also included into official guidelines of different countries at EU and non-EU level (e.g. EXCIMAP, 2007; LAWA – German Working Group on Water Issues of the Federal States and the Federal Government, 2010; CREW – Centre of Expertise for Waters, 2012; NOAA,
15
2012). DEMs are used to define which areas are flood-prone, as they give detailed information on terrain elevations and location of different structures and infrastructures. A main challenge for researchers and practitioners is also to design reliable storm conditions, through an analysis of measured time series of waves and water levels, in order to generate maximum water level scenarios (among others: Salecker et al.,
20
2011; Corbella and Strecth, 2012; Villatoro et al., 2013), with different return periods, that are representative of what might occur in the future. As measured time series are often limited in temporal extension and only available for recent decades, longer-term assessment can be made using hindcasting from global re-analysis databases (Harley et al., 2010).
25
NHESSD
3, 4315–4352, 2015Evaluation of coastal vulnerability to
flooding in Emilia-Romagna, Italy
L. Perini et al.
Title Page
Abstract Introduction
Conclusions References
Tables Figures
◭ ◮
◭ ◮
Back Close
Full Screen / Esc
Printer-friendly Version
Interactive Discussion
Discussion
P
a
per
|
Discussion
P
a
per
|
Discussion
P
a
per
|
Discussion
P
a
per
ADCIRC (Colle et al., 2008; Lin et al., 2010), ANUGA (Van Drie et al., 2010), to evaluate how far the marine water will flow landward, water-depths and flow velocities. Nevertheless, to lower the computational demand and to apply models to larger coastal stretches, low resolution DEMs are often used or, alternatively, the resolution of available DEMs is lowered. This leads to a reduction of accuracy of flood maps,
5
especially where the coast is characterised by a large number of vulnerable features concentrated into a limited portion of territory and, consequently, when a detailed analysis is required. In fact, the confidence in the identification of vulnerable land is much improved when the assessment is derived from higher resolution DEMs (Gesch, 2009).
10
If larger coastal stretches have to be analysed (spatial scale of hundreds kilometres), a methodology commonly adopted is the so-called bath-tub method. The method consists in comparing water levels to terrain elevations and, where the terrain elevation is lower or equal to the computed water level, the area is identified as being flood-prone. The methodology has proved to be inaccurate because it over-predicts the
15
extension of flooded areas and does not take into account the hydrological connectivity between different areas (Poulter and Halpin, 2008; Gesch, 2009; Murdukhayeva et al., 2013). Poulter and Halpin (2008) found that DEM horizontal resolution and hydrological connectivity have a significant influence on the extent and duration of flooding. Indeed, the authors used a methodology that incorporates into the bath-tub method the
20
hydrological connectivity between grid cells: only cells that have a connection with the open sea and with inundated nearby cells are considered flood-prone.
The Directive 2007/60/EC was issued at the end of 2007. It is normally identified as the Floods Directive and includes regulations to evaluate and manage flood risks both from rivers and along EU coastlines. To satisfy the requests of the Floods Directive,
25
NHESSD
3, 4315–4352, 2015Evaluation of coastal vulnerability to
flooding in Emilia-Romagna, Italy
L. Perini et al.
Title Page
Abstract Introduction
Conclusions References
Tables Figures
◭ ◮
◭ ◮
Back Close
Full Screen / Esc
Printer-friendly Version
Interactive Discussion
Discussion
P
a
per
|
Discussion
P
a
per
|
Discussion
P
a
per
|
Discussion
P
a
per
|
The Emilia-Romagna coastline, Italy, facing the North Adriatic Sea, is affected by storms that cause extensive damages. The coast of the Region has large portions of the territory below mean sea level and is highly urbanised. Consequently an evaluation of the vulnerability of the coastal area is an urgent matter.
The current paper aims at presenting in detail the methodology adopted at
5
regional level in Emilia-Romagna to satisfy the requests of the Floods Directive. The Directive was implemented into the Italian legislation through the Legislative Decree 49/2010. The hazard maps are presented here in comparison with another approach which produced vulnerability maps along profile lines (hereafter referred to as “VaPL”), that was adopted locally before the Directive had been issued. The
10
VaPL approach has already been presented in several refereed papers and conference proceedings (Ciavola et al., 2008; Armaroli et al., 2009a, b, 2012a, b, 2013; Armaroli and Perini, 2012). Thus, only a brief summary is outlined in the current paper in the method and result sections. The Geological, Seismic and Soil Service (SGSS) has produced a very large database on storm characteristics, location of flooding
15
and damages, their costs, etc. (up to 2010, Perini et al., 2011; up to present, online storm catalogue “in_Storm”, http://ambiente.regione.emilia-romagna.it/geologia/ archivio_pdf/pubblicazioni/in_storm.pdf). Both methodologies were qualitatively tested using data collected after major storms and the validation is also described hereafter. Finally, the results of the two approaches are compared.
20
2 Field site description
The coast of the Emilia-Romagna region is composed of 130 km long sandy beaches, facing the north Adriatic Sea. The area is characterised by low elevations above mean sea level (m.s.l.) and high-level of human occupation. If the coastal topography and altimetry are taken into account, the coastline can be divided into two sectors
25
NHESSD
3, 4315–4352, 2015Evaluation of coastal vulnerability to
flooding in Emilia-Romagna, Italy
L. Perini et al.
Title Page
Abstract Introduction
Conclusions References
Tables Figures
◭ ◮
◭ ◮
Back Close
Full Screen / Esc
Printer-friendly Version
Interactive Discussion
Discussion
P
a
per
|
Discussion
P
a
per
|
Discussion
P
a
per
|
Discussion
P
a
per
plains, composed of cultivated fields, wetlands and marshes, most of them reclaimed, that show elevations that are generally below m.s.l. and can reach minimum values of−2/−3 m. The low elevated areas are separated from the sea by dune ridges, both old and active, that protect the hinterland from flooding. The northern part of the coast includes the only remaining dune fields of the region, that represent almost 40 % of this
5
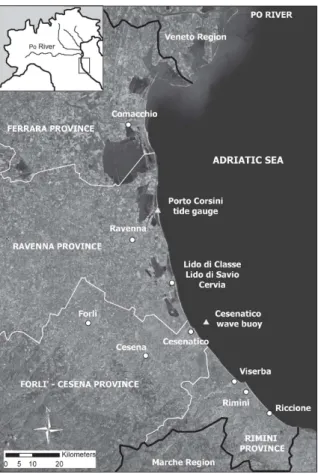
sector. (ii) The southern portion includes the Forlì-Cesena and Rimini provinces (Fig. 1) and is characterised by a narrow coastal corridor where active and semi-stabilised dunes disappeared and the old dune ridges occupy a narrow and short strip of the hinterland. Elevations are generally above m.s.l. (mean values are between 2 and 3 m). The index of occupation, defined as the length of urbanised coast divided by the length
10
of the coast, equals to 1.
The coastal zone experienced an intensive exploitation that started after World War II and had its peak around the 1970s, when urban settlements grew and tourist activities became one of the most important economic activities of the region. The consequence of this development was the destruction of coastal dunes, mainly by using sand for
15
concrete production. Buildings, roads and other facilities replaced dunes and natural environments. Furthermore, the increase in population and industrial activities along the coast enhanced groundwater extraction, with the consequence of increasing land subsidence. Where this was coincident with subsidence caused by gas extraction, it locally reached peaks of 2 cm year−1 (at the coast near Ravenna, Teatini et al.,
20
2005). Protected beaches currently represent almost the 60 % of the coastline (groins, breakwaters, submerged barriers, artificial embankments, dikes and rubble mound slopes). Starting from the end of 1990s large nourishment projects were carried out using sediments obtained from offshore sand deposits, quarries and alongshore deposits. The latter are generated by the presence of groins, jetties and ports that
25
interrupt the alongshore sediment transport at many points along the coast.
NHESSD
3, 4315–4352, 2015Evaluation of coastal vulnerability to
flooding in Emilia-Romagna, Italy
L. Perini et al.
Title Page
Abstract Introduction
Conclusions References
Tables Figures
◭ ◮
◭ ◮
Back Close
Full Screen / Esc
Printer-friendly Version
Interactive Discussion
Discussion
P
a
per
|
Discussion
P
a
per
|
Discussion
P
a
per
|
Discussion
P
a
per
|
wind) and SE (Sciroccowind). Surge levels are an important element controlling total water levels measured during storms (Masina and Ciavola, 2011). The highest surge levels are generated by south-easterly winds that favour water piling in the northern Adriatic Sea. When the famousacqua alta(high water) occurs in Venice, that is located around 150 km to the north of the study area, the Emilia-Romagna coast suffers from
5
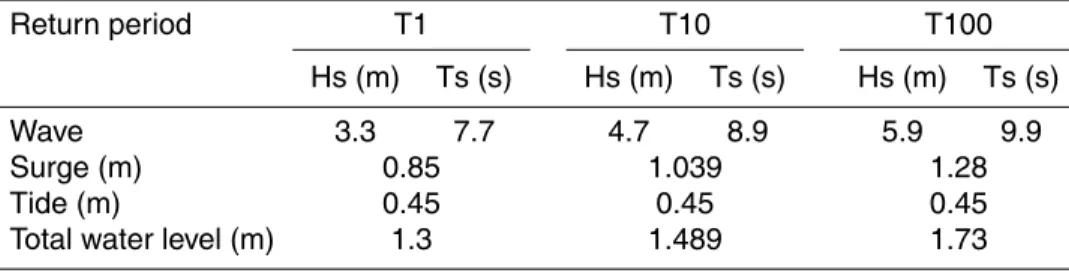
the same phenomenon, that can cause extensive erosion and inundation if associated to storm waves (Armaroli et al., 2012a). Masina and Ciavola (2011) found that the 1-in-10-year return period surge is close to 1 m, thus it can double the tidal range. Storms can be energetic (Table 1) with the maximum-recorded wave event having a significant wave height of 5.65 m (Ciavola et al., 2007). Armaroli et al. (2012a) identified critical
10
storm thresholds that can generate floods, damage to structures and beach erosion along built up coastal stretches: Hs=1.5 m and water level (surge level+tide)=0.85 m. Wave and tide data are registered by the wave gauge of ARPA-SIMC (Regional Hydro-Meteorological Service) located near Cesenatico and the tide gauge of the ISPRA RMN (National Institute for Research and Environment Protection – National Tide Gauging
15
Network) network located in Porto Corsini, near Ravenna (Fig. 1).
3 Methods
The following methodological section is divided into two sub-sections. At first the methodology that considers coastal vulnerability along profile lines is summarised shortly. Hazard and risk maps issued by the Region are, on the other hand, presented
20
in detail in the second part.
3.1 Vulnerability maps along profile lines
The SGSS of the Emilia Romagna Region started in 2006 an analysis of the probable impact of marine storms along the coastline. The adopted methodology was designed to calculate maximum water levels along equally spaced cross-shore transects (almost
NHESSD
3, 4315–4352, 2015Evaluation of coastal vulnerability to
flooding in Emilia-Romagna, Italy
L. Perini et al.
Title Page
Abstract Introduction
Conclusions References
Tables Figures
◭ ◮
◭ ◮
Back Close
Full Screen / Esc
Printer-friendly Version
Interactive Discussion
Discussion
P
a
per
|
Discussion
P
a
per
|
Discussion
P
a
per
|
Discussion
P
a
per
500 m) extracted from a DTM and DSM (Digital Terrain and Surface models) produced using a 2004 Lidar flight. The profiles extended from the intertidal area up to the rear beach, including the rear dune area, along natural coastal stretches, and including the first line of structures located on/close to the beach along urbanised zones. The profiles are cross-shore transects that are part of a network monitored by the Regional
5
Environment Agency since the early 1990s. The maximum water levels were computed for three return period storms (1-in-1, 1-in-10 and 1-in-100 year) as the sum of run-up, surge and high mean spring tide, in order to consider a worst-case scenario (Table 1). The variability of natural and developed coastal environments located along the coastline was taken into account. Along areas characterised by the presence of
10
dunes, a specific indicator was designed (Dune Stability Factor; Armaroli et al., 2012a; Ciavola et al., 2014); where the coast is protected by semi-submerged and emerged shore-parallel breakwaters, the wave transmission coefficient was calculated to obtain a representative wave height in very shallow water (Armaroli et al., 2009b); coastal tracts protected by rubble mound slopes were studied using appropriate
run-15
up formulas (Armaroli and Perini, 2012). The general computational protocol was structured as:
1. Extraction of profile lines along the whole regional coastline, from the Lidar dataset (DSM and DTM).
2. Selection of wave characteristics, surge and tide elevations from the literature, for
20
the three considered return periods (Table 1, Idroser, 1996; Yu et al., 1998).
3. Computation of beach slope values along each profile line;
4. Computation of run-up levels using the Holman (1986) formula, modified by Komar (1998) to include set-up.
5. Sum of the different components to calculate the maximum water levels.
25
NHESSD
3, 4315–4352, 2015Evaluation of coastal vulnerability to
flooding in Emilia-Romagna, Italy
L. Perini et al.
Title Page
Abstract Introduction
Conclusions References
Tables Figures
◭ ◮
◭ ◮
Back Close
Full Screen / Esc
Printer-friendly Version
Interactive Discussion
Discussion
P
a
per
|
Discussion
P
a
per
|
Discussion
P
a
per
|
Discussion
P
a
per
|
7. Design of ten typologies of impact to create vulnerability maps.
The maps were validated through the comparison between the vulnerability typologies identified along the coastline and the observed impacts of significant storms. In the result section of the current paper, the comparison with a recent storm (10 March 2010) is presented as validation exercise. A second validation was carried out after a strong
5
event occurred during the night of 31 October–1 November 2012, locally known as the “Halloween Storm” (Harley et al., 2015).
3.2 Hazard and risk maps
To produce hazard and risk maps at a regional scale, the SGSS of the Emilia-Romagna Region implemented a methodology that was calibrated with the information available
10
in the catalogue of historical storm (Perini et al., 2011; “In_Storm” online catalogue) and also with the terrain characteristics of the coastal stretch. The methodology is based on five steps:
1. Selection of storm information and computation of total water levels for three return period events (1-in-10, 1-in-100 and>1-in-100 year).
15
2. Compilation of a model into ArcGIS®(Model Builder Tool) to elaborate input data and produce hazard maps; critical evaluation and refinement of the outputs.
3. Overlap of the hazard maps with land use maps to create risk maps.
4. Identification of low-lying locations (hereafter referred to as “passages”) that act as pathways for the water, leading to the inundation of rear areas.
20
5. Qualitative comparison of the obtained hazard maps with the extension of inundated areas measured after recent storms.
NHESSD
3, 4315–4352, 2015Evaluation of coastal vulnerability to
flooding in Emilia-Romagna, Italy
L. Perini et al.
Title Page
Abstract Introduction
Conclusions References
Tables Figures
◭ ◮
◭ ◮
Back Close
Full Screen / Esc
Printer-friendly Version
Interactive Discussion
Discussion
P
a
per
|
Discussion
P
a
per
|
Discussion
P
a
per
|
Discussion
P
a
per
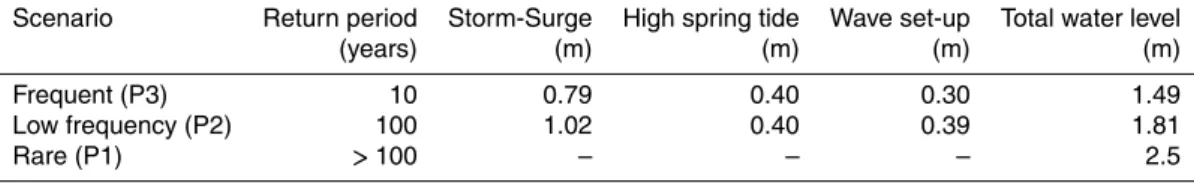
Italian Ministry for the Environment (http://www.pcn.minambiente.it/GN/en/projects/ not-ordinary-plan-of-remote-sensing). The DTM resolution was not reduced, because a very accurate analysis of the terrain’s characteristics was needed. The total water level (TWL, Table 2) was computed as the sum of different variables extracted from the literature, to design three worst-case scenarios: surge levels (Masina and Ciavola,
5
2011), wave set up elevations (Decouttere et al., 1998) and the mean astronomical high spring tidal level (Idroser, 1996). The TWL return period value exceeding 100 years (Table 2) was chosen based on analyses of historical storms (1966 flooding, Perini et al., 2011) and extreme events included into the first coastal plan issued by the Emilia-Romagna Region (Idroser, 1982). Furthermore, the 2.5 m elevation is locally
10
used by practitioners to design coastal protection structures along the Emilia-Romagna coastline.
The methodology does not include run-up levels, the effect of land subsidence and the presence of temporary flood protections built on beaches during the winter season (the so called “winter dunes”, Harley and Ciavola, 2013). The elements
15
listed above were not considered in the analysis because the Region wanted to implement a simple and quickly replicable methodology, while the inclusion of the above mentioned variables and features would have led to more complex and time consuming procedures (Sekovski et al., 2015).
Once TWLs were computed, they were compared to the elevation values of the
20
2008 high resolution DTM, using the bath-tub method. Overall the procedure seemed to overestimate the extension of flooded areas, as the elevation of the backshore is low, especially in the northern part of the region. Thus, an attenuation artifice was introduced as a proxy to bed friction and infiltration over a distance from the shoreline, projecting the water surface inland over a sloping plane which inclination corresponded
25
NHESSD
3, 4315–4352, 2015Evaluation of coastal vulnerability to
flooding in Emilia-Romagna, Italy
L. Perini et al.
Title Page
Abstract Introduction
Conclusions References
Tables Figures
◭ ◮
◭ ◮
Back Close
Full Screen / Esc
Printer-friendly Version
Interactive Discussion
Discussion
P
a
per
|
Discussion
P
a
per
|
Discussion
P
a
per
|
Discussion
P
a
per
|
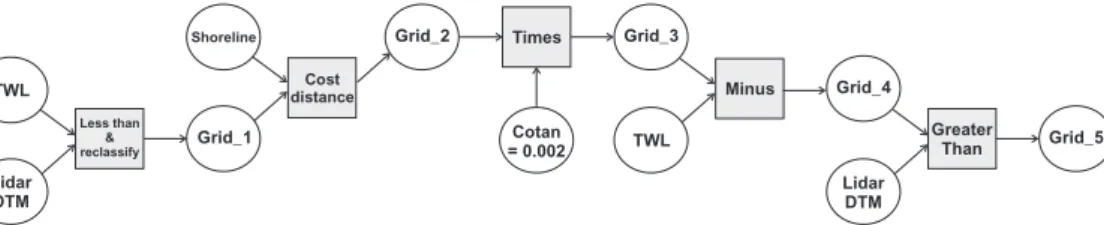
com/en/arcgisdesktop/10.0/help/index.html#//009z00000018000000.htm) and a new model was built into ArcGIS®to re-elaborate the data (Fig. 2).
The DTM was clipped at a landward boundary that corresponded to the flooding extension resulting once the attenuation artifice was applied, to be sure that all the potentially flood-prone zones were included. First, the high-resolution DTM elevations
5
were compared to the TWL of each scenario, one at a time, to exclude zones that have an elevation higher that the potentially maximum water level. The output was then a re-classified grid (Grid_1 in Fig. 2) where zones with an elevation>TWL were assigned an arbitrary value of 999 and the others (elevation≤TWL) were assigned a value of 1. These fictitious values were necessary to exclude from the successive steps areas
10
that, given their elevation above TWL, are not flood prone. Then, the Cost Distance tool was applied to assign to each cell of the new grid a value that indicates its least horizontal distance from the 0.0 m a.m.s.l. contour line extracted from the 2008 Lidar grid (the origin), in terms of “paths” (i.e. paths that avoid or favour the water movement landward) and not in terms of Euclidean distance (Sekovski et al., 2015). The distance
15
value of each cell of the grid was weighted through the arbitrary values (999 and 1) given to Grid_1 (Fig. 2), thus cells=1 were assigned a value that equalled the distance computed with the tool, cells=999 were assigned a very large value. The output was a second grid (Grid_2 in Fig. 2). The next step multiplies the distance values of each cell of Grid_2 by the attenuation angle described above (cotangent=0.002) to convert
20
distance values into elevations. The output was a third grid (Grid_3 in Fig. 2) which cells’ elevations represented the minimum water level needed to produce flooding. The successive step takes as input one TWL at a time that is subtracted to Grid_3 elevations. The output is a grid (Grid_4 in Fig. 2) where every cell has assigned an elevation that is positive, negative or zero. Positive and zero values correspond
25
NHESSD
3, 4315–4352, 2015Evaluation of coastal vulnerability to
flooding in Emilia-Romagna, Italy
L. Perini et al.
Title Page
Abstract Introduction
Conclusions References
Tables Figures
◭ ◮
◭ ◮
Back Close
Full Screen / Esc
Printer-friendly Version
Interactive Discussion
Discussion
P
a
per
|
Discussion
P
a
per
|
Discussion
P
a
per
|
Discussion
P
a
per
then the area is flood prone. The final output was a grid (Grid_5) that represented the extent of flood prone areas for each scenario. Finally, there were other steps completed outside the model: (i) the conversion of Grid_5 into a polygon feature, (ii) the deletion of non-flood prone polygons, (iii) the deletion of isolated areas not connected with the shoreline. The final output was a polygon feature that represented the extent of
flood-5
prone zones, for each scenario. The polygon features corresponding to each analysed return period (RP) were named, according to article 6 of the Floods Directive, as P1=“rare” (RP>100 years), P2=“not frequent” (RP=100 years) and P3=“frequent” (RP=10 years) (Table 2, Sekovski et al., 2015).
At regional and national level, it was decided to produce risk maps based on land
10
use maps developed by the Regional authorities. The location of sensitive elements such as hospitals, key infrastructures, schools, number of inhabitants, etc. was also taken into account. As depth-damage curves for the Italian territory are not available for marine floods, the vulnerability of each type of land use was classified using a unit scale from 1 to 4 according to its degree of damage to flooding (i.e. from D1=low
15
vulnerable to D4=very vulnerable). The damage classification was prepared by the SGSS, to take into account specific characteristics and different uses of the territory located close to coast. The regional and national authorities decided to consider as highly damageable the areas occupied by settlements, sensitive constructions and human activities (tertiary activities, agriculture, etc.), because human-related direct and
20
indirect losses are considered the most critical issue. For this reason, goods such as urban areas, industrial zones, ports, water supply and electricity networks, were given the maximum value (D4), while the beach, active dunes, etc (i.e. areas without human occupation) were considered less damageable and given a D1 value. A matrix that combines the three designed scenarios and the damage values was built and risk
25
classes, from R4 (high risk) to R1 (low risk), were derived from the linkage between the two inputs (Table 3).
NHESSD
3, 4315–4352, 2015Evaluation of coastal vulnerability to
flooding in Emilia-Romagna, Italy
L. Perini et al.
Title Page
Abstract Introduction
Conclusions References
Tables Figures
◭ ◮
◭ ◮
Back Close
Full Screen / Esc
Printer-friendly Version
Interactive Discussion
Discussion
P
a
per
|
Discussion
P
a
per
|
Discussion
P
a
per
|
Discussion
P
a
per
|
(ii) consultation with local experts having a long-term experience on coastal issues to collect their suggestions and opinions on the reliability of the obtained maps. In the result sections, only the first validation procedure is presented. Finally, a comparison was made between the results of the hazard maps and the typologies of impact derived from the vulnerability cartography along profile lines. The compared results of both
5
methodologies are those designed for the 1-in-10 and 1-in-100-year return period events.
4 Results
The results section is split into two sub-paragraphs, as for the method section. The comparison between the results of the two methodologies and the qualitative validation
10
of the maps is presented.
4.1 Vulnerability maps along profile lines
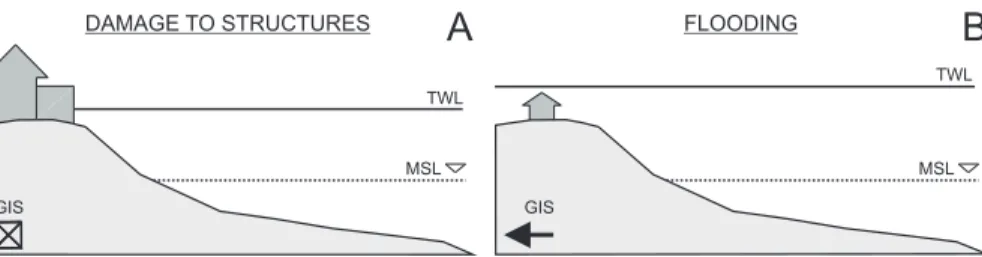
The comparison between the obtained TWLs, along each profile line and for each scenario, and the location of artificial structures or dunes located along the same profiles, lead to the definition of nine typologies of impact with one typology that defines
15
a safe-from-inundation/damage condition (Ciavola et al., 2008; Armaroli et al., 2012a; Fig. 3). A symbol was assigned to each typology in order to visualise the results in a GIS based programme.
As a summary it is important to outline that the coast is vulnerable to storms with a high probability of occurrence (1-in-1-year return period event) because almost 60 %
20
of the analysed transects falls under one of the nine typologies of impact. If we take into account the 1-in-10-year return period scenario, the amount of vulnerable profiles increases to 80 %.
A first comparison between the vulnerability maps and the impact of storms was carried out taking into account a major event that occurred on 10 March 2010. The
NHESSD
3, 4315–4352, 2015Evaluation of coastal vulnerability to
flooding in Emilia-Romagna, Italy
L. Perini et al.
Title Page
Abstract Introduction
Conclusions References
Tables Figures
◭ ◮
◭ ◮
Back Close
Full Screen / Esc
Printer-friendly Version
Interactive Discussion
Discussion
P
a
per
|
Discussion
P
a
per
|
Discussion
P
a
per
|
Discussion
P
a
per
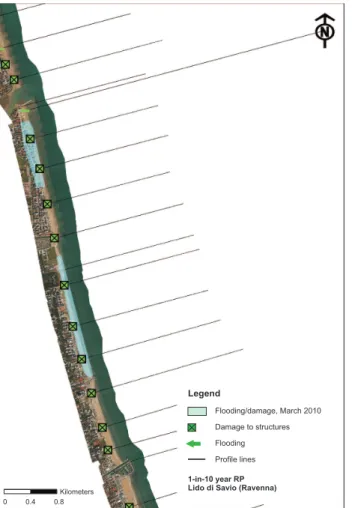
storm was close to a 1-in-5-year return period event and characterised by high surge levels (0.93 m a.m.s.l.), a wave height (Hs max) of 3.91 m and an associated Tp of 10 s. The direction of Hs max was 59◦ north. After the storm, the SGSS and local Technical Services collected information on the location of damages and flooding along the whole regional coastline. Seven areas were affected by the event (located
5
in Ravenna, Forlì-Cesena and Rimini provinces, Fig. 1). In Fig. 4 the Lido di Classe – Lido di Savio (Ravenna) example is presented in comparison to the 1-in-10-year return period vulnerability map along profile lines (Fig. 3).
The site is characterised by a significant human occupation, coastal protection structures (detached shore-parallel breakwaters) and a river mouth (the Savio River).
10
The blue areas in Fig. 4 represent the location and alongshore length (but not the landward extension) of storm consequences that are visualised in ArcGIS®by means of polygon features. The vulnerability maps show that the profile lines that cross the damaged/flooded areas are associated to a well-defined typology of impact (Fig. 3). The same correspondence occurs along the remaining six areas identified all over the
15
regional coast (Armaroli et al., 2012b).
4.2 Hazard and risk maps
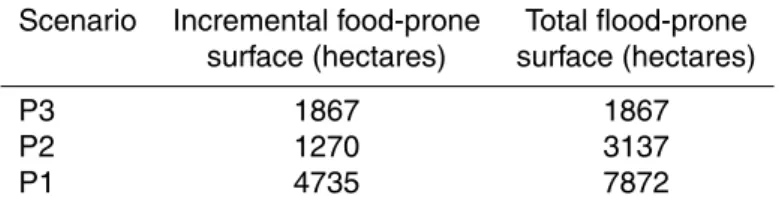
The extension of flood prone areas along the regional coastline is presented in Table 4. The values are given in terms of incremental extension of flood-prone areas (additional flood-prone surface of each scenario with respect to the previous one(s)) and of the
20
total flood-prone surface (i.e. the sum of each scenario with the previous one(s)). The most frequent event designed for the 1-in-10-year return period storm is able to inundate more than 1800 ha of the coastline. The 1-in-100 event almost doubles the flood-prone zone and the>1-in-100 event is 2.5 times the extension of flooded areas with respect to the P3+P2 scenarios. The majority of P3 extension includes the beach
25
NHESSD
3, 4315–4352, 2015Evaluation of coastal vulnerability to
flooding in Emilia-Romagna, Italy
L. Perini et al.
Title Page
Abstract Introduction
Conclusions References
Tables Figures
◭ ◮
◭ ◮
Back Close
Full Screen / Esc
Printer-friendly Version
Interactive Discussion
Discussion
P
a
per
|
Discussion
P
a
per
|
Discussion
P
a
per
|
Discussion
P
a
per
|
4.2.1 Viserba site
An example of the hazard mapping is presented in Fig. 5c for the Viserba site (Rimini province, Fig. 5a). The site was chosen because it presents the best example of “passage” (yellow cross in Fig. 5c and d) that favours the water ingression. The given example is a road with an underpass below the railway track that is running alongshore.
5
Thirteen passages were identified along the whole coastline, corresponding to weak points that deserve to be given special attention. In Fig. 5b land use typologies and sensitive structures, such as hospitals and health care structures, schools, water, electricity and gas networks and the railway, are presented. To notice that the area is mostly occupied by urban buildings, while the beach is protected by shore-parallel
10
breakwaters (Fig. 5a). Risk maps were visualised through a GIS based programme (Fig. 5d). The beach area is mapped as low risk (R1), as well as the fields located in the hinterland, while structures and human-related activities are considered at R3 and R4 risks, thus the highest levels. R3 corresponds to areas occupied by buildings and infrastructures (land-use typologies: “bathing establishment facilities” and
15
“urbanisation”) that resulted flood-prone under medium frequency conditions (P2); R4 is assigned to the same type of land use, but that is flood-prone under high frequency conditions (P3). It is important to notice how sensitive structures, such as schools and hospitals/health care structures are not affected by flooding in this area.
The comparison between the hazard maps and the vulnerability maps along profile
20
lines is presented in Fig. 5c. The typologies of vulnerability are “flooding” and “damage to structures” (Fig. 3). The symbols in the figure refer to the 10 and 100-year return period scenarios. In fact, for both scenarios the area shows the same vulnerability (the legend is named accordingly). The comparison between the P3 hazard scenario (10-year return period) and the VaPL mapping shows that along the northern profile there is
25
(100-NHESSD
3, 4315–4352, 2015Evaluation of coastal vulnerability to
flooding in Emilia-Romagna, Italy
L. Perini et al.
Title Page
Abstract Introduction
Conclusions References
Tables Figures
◭ ◮
◭ ◮
Back Close
Full Screen / Esc
Printer-friendly Version
Interactive Discussion
Discussion
P
a
per
|
Discussion
P
a
per
|
Discussion
P
a
per
|
Discussion
P
a
per
year return period) with the VaPL mapping, there is complete agreement along both profiles.
4.2.2 Lido di Classe – Lido di Savio – Cervia sites
The hazard maps were qualitatively validated through the comparison with floods and damages measured after the 31 October–1 November 2012 storm (Harley et al., 2015)
5
that was characterised by very high surge levels (1.15 m a.m.s.l., measured at Porto Corsini tide gauge, Ravenna, Fig. 1), between a 1-in-20 and a 1-in-50-year return period event and a significant wave height of 2.41 m (measured at the Cesenatico buoy, Fig. 1), slightly lower than the 1-in-1-year return period event. After the storm, the SGSS surveyed the location of flooded areas along the whole coastline and collected
10
information on damages, beach erosion, inundation, damage to protection structures and river flooding as reported by local Technical Services. The surveys were carried out with an RTK-DGPS (vertical accuracy of±0.05 m; horizontal accuracy of±0.5 m). The qualitative comparison is shown in Fig. 6a for the area of Lido di Classe – Lido di Savio and Cervia, Ravenna province, together with the vulnerability typologies along profile
15
lines. The typologies, as occurred for the Viserba site, are identical between the 10 and 100-year return periods. In Fig. 6b the corresponding risk map is also presented. In the northern area, the Technical Services reported flooding (green star in Fig. 6a), while, in the southern part, damage to bathing establishments was observed (red cross in Fig. 6a).
20
The VaPL prediction is consistent with the reported consequences of the storm. For example, the area close to the Savio River mouth (located in the northern section of the area) experienced flooding and indeed the vulnerability typology is consistent with the observed damage. Furthermore, the field survey shows that the first line of structures located on or close to the beach experienced damage and inundation. Again, the
25
NHESSD
3, 4315–4352, 2015Evaluation of coastal vulnerability to
flooding in Emilia-Romagna, Italy
L. Perini et al.
Title Page
Abstract Introduction
Conclusions References
Tables Figures
◭ ◮
◭ ◮
Back Close
Full Screen / Esc
Printer-friendly Version
Interactive Discussion
Discussion
P
a
per
|
Discussion
P
a
per
|
Discussion
P
a
per
|
Discussion
P
a
per
|
The hazard maps issued for the Floods Directive are therefore quite consistent with the reported damages and with the post-storm survey, even if the extension of flooding is over-estimated in the central part and under-estimated along a limited portion of the southern zone (Fig. 6a). The comparison between the hazard maps and the VaPL mapping shows quite a good agreement, especially for the P3 scenario. The P2
5
scenario incorporates larger portions of the hinterland, while the vulnerability symbols indicate again “damage to structures”. The risk map (Fig. 6b) gives results that are similar to the Viserba ones and the majority of the area is categorised at R3 and R4 risk.
5 Discussion
10
The methods used to produce the vulnerability maps along profile lines were adopted by the regional authorities one year before the issuing of the Floods Directive, because the coastal vulnerability to storms was already considered a priority by regional managers, due to its impact on goods and population and its associated costs. The result is a clear and replicable methodology that includes diverse environments with
15
a wide range of different characteristics. The produced maps have the potential of detecting hot spots of vulnerability along the coastline. The run-up component is important to calculate a reliable total water level for each scenario and, as pointed out by Armaroli et al. (2009b) if not included in the computation, the resulting maps are significantly different from what may actually occur.
20
The comparison between the VaPL cartography and the location of damages to structures and flooding along the coastline, collected after the March 2010 storm, reveals that the vulnerability typologies correctly identify where the coastline is exposed to such hazards. The comparison outlines that the mapping along profiles is reliable, but, on the other hand, uncovers the fact that not all the profiles categorised as
25
NHESSD
3, 4315–4352, 2015Evaluation of coastal vulnerability to
flooding in Emilia-Romagna, Italy
L. Perini et al.
Title Page
Abstract Introduction
Conclusions References
Tables Figures
◭ ◮
◭ ◮
Back Close
Full Screen / Esc
Printer-friendly Version
Interactive Discussion
Discussion
P
a
per
|
Discussion
P
a
per
|
Discussion
P
a
per
|
Discussion
P
a
per
the comparison. Furthermore, if the designed TWL intersects the structure located along the profile, the “damage to structure” vulnerability typology is assigned (Fig. 3). However, in real conditions the water can flow around buildings and along alleys, leading to inundation of rear areas.
The hazard maps describe the areal extension of flood-prone areas along the
5
whole coastline, thus including the alongshore and landward components. The method developed for this study does not include information on soil roughness and permeability, which control flow velocity, water discharge and, ultimately, the extent of inundation. Nevertheless, the least-path calculations can be considered as a proxy of both the variables mentioned above, because the longer is the path the less probable is
10
the inundation, since increasingly higher water levels are needed to allow the flooding (Sekovski et al., 2015). Furthermore, a proper 2d hydraulic model would be needed to compute flow velocities and water-depths (Barredo et al., 2008; Wadey et al., 2012) and to consider soil roughness (Barredo et al., 2008; Zhang et al., 2008; Wadey et al., 2012; Villatoro et al., 2013). Wadey et al. (2012) found that overtopping and
15
breaching processes (i.e. defence failure) are very important to evaluate flood hazards but unfortunately this is a process that is rarely taken into account when flood mapping is done. Moreover, Villatoro et al. (2013) demonstrated the importance of overflow of fresh water canals and overtopping and breaching of banks (inland defences) when dealing with coastal flooding. For example, this is a process with relevance to the
20
Comacchio municipality, in the Ferrara province (Fig. 1) and in that case should be accounted for, if detailed flood risk mapping had to be done.
Poulter and Halpin (2008) improved the bath-tub method through the inclusion of the hydrological connectivity among adjacent cells. In the procedure presented in our paper, a sort of hydrological connectivity method is used to remove isolated areas from
25
NHESSD
3, 4315–4352, 2015Evaluation of coastal vulnerability to
flooding in Emilia-Romagna, Italy
L. Perini et al.
Title Page
Abstract Introduction
Conclusions References
Tables Figures
◭ ◮
◭ ◮
Back Close
Full Screen / Esc
Printer-friendly Version
Interactive Discussion
Discussion
P
a
per
|
Discussion
P
a
per
|
Discussion
P
a
per
|
Discussion
P
a
per
|
without the need to lower the resolution, as would occur if a hydraulic model was to be applied. Gallien et al. (2011) found that for protected urban areas, hydraulic models outperform equilibrium flood mapping methodologies, which ignore hydraulic connectivity and are strongly biased towards over-prediction of flood extent. However, infrastructure geometry data including flood defences, street and parcel elevations
5
are crucial to accurate flood prediction. Through comparison between model grids based on GPS-RTK surveys (1 cm vertical accuracy) and an aerial LIDAR (accuracy 15 cm), the authors found that the latter was not accurate enough when used for an hydraulic model, which required high details of elevation for flood protection structures. Considering the computational requirements that even a 2d hydraulic model has,
10
and the impossibility of implementing it for long stretch of coastlines at a meaningful resolution, the methodology we propose is a good trade-offbetween the hydraulic and bath-tub approach.
Similar to other simplified methods and numerical models, the described method does not take into account beach and dune erosion even if they are important
15
morphological processes during a storm. This issue has been extensively discussed by Ciavola et al. (2014) for the applicability of numerical tools (XBeach) within Early Warning Systems for predicting storm impacts. For operational tools, the current state-of-the-art highly recommends numerical models. For a strategic flood mapping exercise the assumptions presented here may be enough for a rough estimation of dune
20
overtopping. However, it is recommended that more detailed numerical approaches should be undertaken (e.g. Harley et al., 2011) to assess if the sediment reservoir within the dune provides enough protection during the storm.
Finally, the over/under estimation of flood’s extension could be due to the exclusion of run-up values and to the difference between the scenarios used for the evaluation
25
NHESSD
3, 4315–4352, 2015Evaluation of coastal vulnerability to
flooding in Emilia-Romagna, Italy
L. Perini et al.
Title Page
Abstract Introduction
Conclusions References
Tables Figures
◭ ◮
◭ ◮
Back Close
Full Screen / Esc
Printer-friendly Version
Interactive Discussion
Discussion
P
a
per
|
Discussion
P
a
per
|
Discussion
P
a
per
|
Discussion
P
a
per
of water levels after a major surge (Spencer et al., 2014). Breilh et al. (2013) re-analysed the forcing components and surge levels generated by the Xynthia storm coupling the SELFE model (Zhang and Baptista, 2008) and the WaveWatch III model (Tolman, 2009) following the methodology presented in Bertin et al. (2012). The authors found that the difference of surge levels along the coastal area of the Atlantic Coast of
5
France, northward of the Gironde Estuary, was up to 1 m (from 4 m NGF – Nivellement Général de la France, in the southern part of the study area to almost 5 m NGF in the northern one). Nevertheless, the results presented in this paper are promising, as the comparison demonstrates the good agreement between the observed impact and the predicted ones. Regional managers and decision makers are aware that the maps
10
need to be improved; this is the reason why a re-computation of run-up values with more recent topographic datasets is planned for the future.
The results of marine flood hazard mapping, based on different numerical and/or more simplified approaches, are generally not tested against information surveyed after a storm or reported damages. Bertin et al. (2014) present a comparison, along
15
a large tract of the central Bay of Biscay on the Atlantic coast of France, between the measured flooding extension after the 2010 Xynthia storm and the modeled inundation. The overall agreement between the predicted vs. modeled flooded areas is reasonable, but the model over-predicts the flooding extension on large marshes, while it fails to represent the inundation of small marshes located along the coastline. The
20
overestimation is explained by the low spatial resolution of the used grid to properly represent small topographic features, while the non-prediction of flooding is explained by the exclusion of infragravity waves and run-up levels into the modeling system. The authors state that increasing the grid resolution to include small scale features would increase the size of the grid and the subsequent computational time significantly. In
25
NHESSD
3, 4315–4352, 2015Evaluation of coastal vulnerability to
flooding in Emilia-Romagna, Italy
L. Perini et al.
Title Page
Abstract Introduction
Conclusions References
Tables Figures
◭ ◮
◭ ◮
Back Close
Full Screen / Esc
Printer-friendly Version
Interactive Discussion
Discussion
P
a
per
|
Discussion
P
a
per
|
Discussion
P
a
per
|
Discussion
P
a
per
|
methodologies, albeit there is a difference in the approach (vulnerability along profiles vs. hazard and risk) and the designed scenarios, underlines that the procedure adopted by the Emilia-Romagna Region to assess the location of vulnerable spots is consistent with the results obtained to fulfil the Directive requirements and is a valuable tool to understand coastal dynamics in the framework of flood impacts. The robustness
5
of both approaches derives from the rigorous evaluation of the information collected on past and recent storms and their consequences, from the large amount of data collected on coastline characteristics and from the close link between the central Regional Authorities with their peripheral offices, who have the task to carry out event assessments. The qualitative comparison between the obtained maps and
post-10
storm surveys is being updated after every significant storm and the SGSS continues to undertake post-storm surveys and to collect information from peripheral services on storms impact. The recording of post-storm data is a fundamental activity, in order to improve the methodology and to identify if, where and why the issued maps fail/are able to represent a true risky condition.
15
6 Conclusions
The evaluation of coastal flooding has become in Europe a high priority since the implementation of the Flood Directive is required to all member states. The Directive entered into force in 2007 and by the end of 2011 The Preliminary Flood Risk Assessment had to be produced for all coastal areas in the European Union. Most
20
countries had no experience of coastal flood mapping and in some cases there was scarcity of the data required (e.g. high resolution topography, characterization of wave and tide forcing, probabilistic analyses of events). Practitioners were asked to produce within a limited time limit the flood maps and required simple methods, available in data rich sites as well in sites where only a rough assessment could be made.
25
NHESSD
3, 4315–4352, 2015Evaluation of coastal vulnerability to
flooding in Emilia-Romagna, Italy
L. Perini et al.
Title Page
Abstract Introduction
Conclusions References
Tables Figures
◭ ◮
◭ ◮
Back Close
Full Screen / Esc
Printer-friendly Version
Interactive Discussion
Discussion
P
a
per
|
Discussion
P
a
per
|
Discussion
P
a
per
|
Discussion
P
a
per
Mediterranean. The fact that the methods were qualitatively validated through the analysis of real cases provides robustness compared to purely theoretical approaches, based only on probabilistic considerations. The most important source of information to assess the reliability of the evaluations was an in-depth knowledge of the coastal territory which has been developed by the leading end-user (SGSS) in the region.
5
A good knowledge of historical and more recent landscape evolution, as well as the availability of a database of historical information on extreme events and their consequences has provided test data for the flooding assessments. Thus, the large number of datasets used to implement and test both methodologies described in the current paper confirm that they are robust and provide reliable results.
10
Both approaches used in this paper are strictly dependant on the quality of the marine forcing parameters used for the evaluation. Return periods were obtained from literature sources which need updating and the wave and surge components were treated separately while a joint probability may occur. The SGSS will improve the methodology developed so far by updating the analysed return periods with more
15
recent datasets and evaluating the combined probability of occurrence of storms and surge levels. However, this was not feasible within the time-scale set by the EU directive.
One of the most important outcomes of the present work is related to the resolution and accuracy of Digital Elevation Models in controlling the quality of flooding
20
assessments. A high-resolution analysis is fundamental to take into account micro topographic variations and the presence of human structures, especially in highly developed areas like urban ones. The positions of passages that favour landward flows were detected only because a high resolution Digital Elevation Model was used. They are considered as weak points along the coastline that have to be given special
25
NHESSD
3, 4315–4352, 2015Evaluation of coastal vulnerability to
flooding in Emilia-Romagna, Italy
L. Perini et al.
Title Page
Abstract Introduction
Conclusions References
Tables Figures
◭ ◮
◭ ◮
Back Close
Full Screen / Esc
Printer-friendly Version
Interactive Discussion
Discussion
P
a
per
|
Discussion
P
a
per
|
Discussion
P
a
per
|
Discussion
P
a
per
|
The risk maps developed with the cost-distance method identified that where flood defence structures are located along the coastline (artificial embankment, dykes, rubble mound slopes), e.g. in the Ferrara littoral, these areas are more resilient, compared to others where the only defence are wave dissipating structures (e.g. breakwaters). However, in the evaluation carried out through the VaPL method, only overtopping was
5
considered in the case of dyke and rubble-mound slopes, but not structural failures. These aspects deserve further investigation, as well as the computation of overtopping discharge as this will control the quantity of water flowing landward.
The two methods used for this study have provided critical strategic information that could be used in the future to design effective integrated strategies and to
10
improve future coastal planning. The coastal area of Emilia-Romagna is indeed under considerable pressure from urban development. Ideally, the methods could be used for developing set-back criteria for decreasing risk (Nordstrom et al., 2015), coupling the analysis with a full cost-benefit economic evaluation of adaptation measures. Finally, the method can be applied to any other area exposed to risk from marine flooding
15
because of its simplicity and low demand for computational resources. The only limit remains the availability of good topographical and hydraulic information.
Author contributions. L. Perini and L. Calabrese designed, implemented and refined the
methodology adopted to produce hazard maps. G. Salerno built the model into ArcGIS® and developed the code. P. Ciavola and C. Armaroli designed, implemented and tested the
20
methodology of the vulnerability along profile lines in close cooperation with L. Perini and L. Calabrese. C. Armaroli prepared the manuscript with contributions from all co-authors, prepared the figures and made the comparison between the two methodologies and the surveyed data.
Acknowledgements. C. Armaroli and P. Ciavola acknowledge the support of the RISC-KIT
25
NHESSD
3, 4315–4352, 2015Evaluation of coastal vulnerability to
flooding in Emilia-Romagna, Italy
L. Perini et al.
Title Page
Abstract Introduction
Conclusions References
Tables Figures
◭ ◮
◭ ◮
Back Close
Full Screen / Esc
Printer-friendly Version
Interactive Discussion
Discussion
P
a
per
|
Discussion
P
a
per
|
Discussion
P
a
per
|
Discussion
P
a
per
References
Armaroli, C. and Perini, L.: A simplified methodology for the estimation of wave runup on armoured rubble slopes for vulnerability assessment, in: Proceedings of 7th Euregeo Conference, I, Bologna, Italy, 12–15 June 2012, 355–356, 2012.
Armaroli, C., Ciavola, P., and Masina, M.: Morphological thresholds for the definition of the
5
vulnerability of coastal dunes in northern Italy, in: Proceedings of AGU Conference, EOS Transaction AGU, San Francisco, California, 14–18 December 2009, 90, 2009a.
Armaroli, C., Ciavola, P., Masina, M., and Perini, L.: Run-up computation behind emerged breakwaters for marine storm risk assessment, J. Coastal Res., SI 56, 1612–1616, 2009b. Armaroli, C., Ciavola, P., Perini, L., Calabrese, L., Lorito, S., Valentini, A., and Masina, M.:
10
Critical storm thresholds for significant morphological changes and damage along the Emilia-Romagna coastline, Italy, Geomorphology, 143–144, 34–51, 2012a.
Armaroli, C., Perini, L., Calabrese, L., Luciani, P., Salerno, G., and Ciavola, P.: Cartografia di rischio da mareggiata della fascia costiera della Regione Emilia-Romagna, in: Proceedings of Meeting Marino, edited by: D’angelo, S. and Fiorentino, A., ISPRA, Roma, 25–
15
26 October 2012, 25–33, 2012b.
Armaroli, C., Grottoli, E., Harley, M. D., and Ciavola, P.: Beach morphodynamics and types of foredune erosion generated by storms along the Emilia-Romagna coastline, Italy, Geomorphology, 199, 22–35, doi:10.1016/j.geomorph.2013.04.034, 2013.
Barredo, J. I., Salamon, P., and Bódis, K.: Towards an assessment of coastal flood damage
20
potential in Europe, European Commission, Joint Research Centre (JRC) and Institute for Environment and Sustainability (IES), Luxembourg, EUR 23698 EN, ISSN 1018-5593, 2008. Bertin, X., Bruneau, N., Breilh, J.-F., Fortunato, A. B., and Karpytchev, M.: Importance of wave
age and resonance in storm surges: the case Xynthia, Bay of Biscay, Ocean Model., 42, 16–30, doi:10.1016/j.ocemod.2011.11.001, 2012.
25
Bertin, X., Li, K., Roland, A., Zhang, Y. J., Breilh, J.-F., and Chaumillon, E.: A modeling-based analysis of the flooding associated with Xynthia, central Bay of Biscay, Coast. Eng., 94, 80– 89, doi:10.1016/j.coastaleng.2014.08.013, 2014.
Breilh, J. F., Chaumillon, E., Bertin, X., and Gravelle, M.: Assessment of static flood modeling techniques: application to contrasting marshes flooded during Xynthia (western France), Nat.
30
NHESSD
3, 4315–4352, 2015Evaluation of coastal vulnerability to
flooding in Emilia-Romagna, Italy
L. Perini et al.
Title Page
Abstract Introduction
Conclusions References
Tables Figures
◭ ◮
◭ ◮
Back Close
Full Screen / Esc
Printer-friendly Version
Interactive Discussion
Discussion
P
a
per
|
Discussion
P
a
per
|
Discussion
P
a
per
|
Discussion
P
a
per
|
Ciavola, P., Armaroli, C., Chiggiato, J., Valentini, A., Deserti, M., Perini, L., and Luciani, P.: Impact of storms along the coastline of Emilia-Romagna: the morphological signature on the Ravenna coastline (Italy), J. Coastal Res., SI 50, 540–544, 2007.
Ciavola, P., Armaroli, C., Perini, L., and Luciani, P.: Evaluation of maximum storm wave run-up and surges along the Emilia-Romagna coastline (NE Italy): a step towards a risk zonation
5
in support of local CZM strategies, in: Integrated Coastal Zone Management – The Global Challenge, Research Publishing Services, Singapore, 505–516, 2008.
Ciavola, P., Ferreira, O., Van Dongeren, A., Van Thiel de Vries, J., Armaroli, C., and Harley, M.: Prediction of storm impacts on beach and dune systems, in: Hydrometeorological Hazards: Interfacing Science and Policy, edited by: Quevauviller, P., John Wiley & Sons, Ltd,
10
Chichester, UK, 227–252, 2014.
Colle, B. A., Buonaiuto, F., Bowman, M. J., Wilson, R. E., Flood, R., Hunter, R., Mintz, A., and Hill, D.: New York City’s vulnerability to coastal flooding, B. Am. Meteorol. Soc., 89, 829–841, 2008.
Corbella, S. and Stretch, D. D.: Multivariate return periods of sea storms for coastal erosion risk
15
assessment, Nat. Hazards Earth Syst. Sci., 12, 2699–2708, doi:10.5194/nhess-12-2699-2012, 2012.
CREW – Centre of Expertise for Waters: Coastal Flooding in Scotland, A guidance document for coastal practitioners, CREW, The James Hutton Institute and Scottish Government, 74 pp., available at: http://www.crew.ac.uk/sites/www.crew.ac.uk/files/publications/coastal_
20
flooding_in_scotland.pdf, last access: 23 June 2015, 2012.
de Moel, H., van Alphen, J., and Aerts, J. C. J. H.: Flood maps in Europe – methods, availability and use, Nat. Hazards Earth Syst. Sci., 9, 289–301, doi:10.5194/nhess-9-289-2009, 2009. Decouttere, C., De Backer, K., Monbaliu, J., and Berlamont, J.: Storm wave simulation in the
Adriatic Sea, in: CENAS – Coastline Evolution of the Upper Adriatic Sea due to Sea Level
25
Rise and Natural and Anthropogenic Land Subsidence, edited by: Gambolati, G., Kluwer Academic Publishers, Dordrecht, The Netherlands, 28, 185–205, 1998.
EXCIMAP, European exchange circle on flood mapping: Handbook on good practices for flood mapping in Europe, EXCIMAP, 60 pp., available at: http://ec.europa.eu/environment/water/ flood_risk/flood_atlas/pdf/handbook_goodpractice.pdf, last access: 23 June 2015, 2007.
30
NHESSD
3, 4315–4352, 2015Evaluation of coastal vulnerability to
flooding in Emilia-Romagna, Italy
L. Perini et al.
Title Page
Abstract Introduction
Conclusions References
Tables Figures
◭ ◮
◭ ◮
Back Close
Full Screen / Esc
Printer-friendly Version
Interactive Discussion
Discussion
P
a
per
|
Discussion
P
a
per
|
Discussion
P
a
per
|
Discussion
P
a
per
Gesch, D. B.: Analysis of lidar elevation data for improved identification and delineation of lands vulnerable to sea-level rise, J. Coastal Res., SI 53, 49–58, 2009.
Harley, M. D. and Ciavola, P.: Managing local coastal inundation risk using real-time forecasts and artificial dune placements, Coast. Eng., 77, 77–90, 2013.
Harley, M. D., Turner, I. L., Short, A. D., and Ranasinghe, R.: Interannual variability and controls
5
of the Sydney wave climate, Int. J. Climatol., 30, 1322–1335, 2010.
Harley, M., Armaroli, C., and Ciavola, P.: Evaluation of XBeach predictions for a real-time warning system in Emilia-Romagna, Northern Italy, J. Coastal Res., SI 64, 1861–1865, 2011. Harley, M. D., Valentini, A., Armaroli, C., Perini, L., Calabrese, L., and Ciavola, P.: Can an
early warning system help minimize the impacts of coastal storms? A case study of the
10
2012 Halloween storm, Northern Italy, Nat. Hazards Earth Syst. Sci. Discuss., 3, 3409–3448, doi:10.5194/nhessd-3-3409-2015, 2015.
Holman, R. A.: Extreme value statistics for wave run-up on a natural beach, Coast. Eng., 9, 477–491, 1986.
Idroser: Piano progettuale per la difesa della costa Emiliano-Romagnola – aspetti meteomarini
15
e determinazione del trasporto litoraneo, vol. III, Regione Emilia-Romagna, Bologna, Italy, 57 pp., 1982.
Idroser: Progetto di Piano per la difesa del mare e la riqualificazione ambientale del litorale della Regione Emilia-Romagna, Regione Emilia-Romagna, Bologna, Italia, 365 pp., 1996. Jimenez, J., Kortenhaus, A., Anhalt, M., Plogmeier, C., Prinos, P., and Sulisz, W.:
20
Guidelines on Coastal Flood Hazard Mapping, FLOODsite Report, T03-08-02, 57 pp., available at: http://www.floodsite.net/html/partner_area/project_docs/T03_08_02_coastal_ flood_mapping_D03_1_V3_1_p01.pdf, last access: 23 June 2015, 2008.
Komar, P. D.: Beach Processes and Sedimentation, 2nd edn., Prentice Hall, New Jersey, US, 544 pp., 1998.
25
LAWA – German Working Group on Water Issues of the Federal States and the Federal Government: Recommendations for the Establishment of Flood Hazard Maps and Flood Risk Maps, LAWA, Dresden, Germany, 25–26 March 2010, 37 pp., available at: http: //www.lawa.de/documents/LAWA_HWGK15062010_Text_Germany_ENG_f72_4d8.pdf, last access: 23 June 2015, 2010.
30
NHESSD
3, 4315–4352, 2015Evaluation of coastal vulnerability to
flooding in Emilia-Romagna, Italy
L. Perini et al.
Title Page
Abstract Introduction
Conclusions References
Tables Figures
◭ ◮
◭ ◮
Back Close
Full Screen / Esc
Printer-friendly Version
Interactive Discussion
Discussion
P
a
per
|
Discussion
P
a
per
|
Discussion
P
a
per
|
Discussion
P
a
per
|
Masina, M. and Ciavola, P.: Analisi dei livelli marini estremi e delle acque alte lungo il litorale ravennate, Studi Costieri, 18, 87–101, 2011.
Murdukhayeva, A., August, P., Bradley, M., LaBash, C., and Shaw, N.: Assessment of inundation risk from sea level rise and storm surge in Northeastern Coastal National Parks, J. Coastal Res., 29, 1–16, 2013.
5
NOAA – National Oceanic and Atmospheric Administration (NOAA), Coastal Services Center: Mapping Coastal Inundation Primer, NOAA Coastal Services Center, 28 pp., available at: http://coast.noaa.gov/digitalcoast/_/pdf/guidebook.pdf, last access: 23 June 2015, 2012. Nordstrom, K. F., Armaroli, C., Jackson, N. L., and Ciavola, P.: Opportunities and constraints for
managed retreat on exposed sandy shores: examples from Emilia-Romagna, Italy, Ocean
10
Coast. Manage., 104, 11–21, 2015.
Perini, L., Calabrese, L., Deserti, M., Valentini, A., Ciavola, P., and Armaroli, C.: Le Mareggiate e Gli Impatti Sulla Costa in Emilia-Romagna 1946–2010, Arpa Emilia-Romagna, Bologna, 143 pp., 2011.
Poulter, B. and Halpin, P. N.: Raster modelling of coastal flooding from sea-level rise, Int. J.
15
Geogr. Inf. Sci., 22, 167–182, 2008.
Purvis, M. J., Bates, P. D., and Hayes, C. M.: A probabilistic methodology to estimate future coastal flood risk due to sea level rise, Coast. Eng., 55, 1062–1073, 2008.
Quevauviller, P.: Adapting to climate change: reducing water-related risks in Europe – EU policy and research considerations, Environ. Sci. Policy, 14, 722–729, 2011.
20
Regione Emilia-Romagna, Servizio Geologico Sismico e dei Suoli: Il sistema mare-costa dell’Emilia-Romagna, edited by: Perini, L., and Calabrese, L., Pendragon Monographies, Bologna, 240 pp., 2010.
Sekovski, I., Armaroli, C., Calabrese, L., Mancini, F., Stecchi, F., and Perini, L.: Coupling scenarios of urban growth and flood hazard along the Emilia-Romagna coast (Italy), Nat.
25
Hazards Earth Syst. Sci. Discuss., 3, 2149–2189, doi:10.5194/nhessd-3-2149-2015, 2015. Salecker, D., Gruhn, A., Schlamkow, C., and Fröhle, P.: Statistical analysis of hydrodynamic
impacts for risk assessment of coastal areas, J. Coastal Res., SI 64, 1906–1910, 2011. Sto. Domingo, N. D., Paludan, B., Madsen, H., Hansen, F., and Mark, O.: Climate Change
and Storm Surges: Assessing Impacts on your Coastal City Through Mike Flood Modeling,
30