Estimating the effects of population size and type on the accuracy
of genetic maps
Adésio Ferreira
1, Marcia Flores da Silva
2, Luciano da Costa e Silva
1and Cosme Damião Cruz
1 1Universidade Federal de Viçosa, Departamento de Biologia Geral, Viçosa, MG, Brasil.
2
Universidade Federal de Viçosa, Departamento de Bioquímica e Biologia Molecular, Viçosa, MG, Brazil.
Abstract
Based on simulation studies, it was shown that the type and size of experimental populations can exert an influence on the accuracy of genetic maps. A hypothetical genome map (one chromosome with nine equidistant molecular markers) was generated for the following population types: F2with dominant and co-dominant markers, backcross-ing, recombinant inbred lines (RIL) and double-haploid. The population sizes were 50, 100, 150, 200, 500 and 1000 individuals and 100 simulations were made for each population. The inaccuracies of the populations with the lowest number of individuals were shown by inversions in the order of the markers and the establishment of more than one linkage group in up to 38% of the simulations, depending on the population type. Stress and variance values of the distances between adjacent markers were significantly reduced with the increased size of the population. More accu-rate maps were obtained for the co-dominant F2and RIL whereas the maps for the dominant F2population were less accurate. The higher the number of individuals, the more precise was the map. In all populations, a total of 200 indi-viduals were considered as being sufficient for the construction of reasonably accurate genetic maps. Although this paper deals with plant populations this approach is equally applicable to other organisms.
Key words:experimental populations, mapping, simulation, markers. Received: August 20, 2004; Accepted: May 31, 2005.
Genetic maps provide important information for de-tailed genetic analysis of qualitative and quantitative traits and have proven to be important tools for plant improve-ment (Mohanet al., 1997; Doerge, 2002) because they al-low workers to evaluate the similarity between genes regulating the expression of a phenotype in different popu-lations and species (Paterson et al., 2000; Ahn and Tanksley, 1993). Another important factor is that such maps constitute the first step towards positional cloning of the genes responsible for a specific phenotype, with ul-tra-dense genetic maps being necessary for these types of studies (Mohanet al., 1997). Simulation studies are also very important in the development of statistical methodolo-gies for both the construction of genetic maps and mapping studies of quantitative trait loci (QTL) (Darvasi et al., 1993).
The currently available literature in this area shows that genetic maps are constructed using different types and sizes of mapping populations, laboratory techniques, marker systems, mapping strategies, statistical procedures
and computer packages. These factors can affect the effi-ciency of the mapping process because of differences in the genetic distances between markers that can occur by varia-tions in the degree of recombination observed in different crossings (Liu, 1998), and this is true even if different maps are generated for the same specie (Patersonet al., 2000).
Distinct types of experimental populations have been employed for mapping of crop species in order to study QTL, including: F2populations; backcrossings (BC);
re-combinant inbred lines (RIL); and double haploids (DH) (Doerge, 2002; Burret al., 1988; Heet al., 2001). As long as the F2and BC populations are considered to be
tempo-rary populations, they cannot be indefinitely. The DH and RIL populations are considered to be permanent and can be maintained under several experimental conditions (He et al., 2001).
During the determination of recombination frequen-cies, used in the establishment of the linkage groups under a determined statistical confidence, the size of the population is a function of the experimental population type, the nature of the markers involved and the required statistical confi-dence. In addition, the genetic density of the markers in the map is limited not only by the number of markers but also by the number of recombination events occurring in
meio-www.sbg.org.br
Send correspondence to Adésio Ferreira. Universidade Federal de Viçosa, Departamento de Biologia Geral, Rua Senador Vaz de Melo 95 F, 36570-000 Viçosa, MG, Brazil. E-mail: adesio@vicosa. ufv.br.
sis that are represented in the mapped population (Liu, 1998).
When the main focus is the detection of QTL, the size of the mapped population may be determined by the gene effect to be detected as well as the type of population (Solleret al., 1976; Lander and Botstein, 1989; Lynch and Walsh, 1998). In this case, the resolution of the mapped QTL depends more on the size of the mapped population and less on to the effect of the QTL (Darvasiet al., 1993). Melchingeret al. (1998) claim that the majority of experi-ments with replicates have used a total of 100 to 200 indi-viduals or progenies and this choice of population size happens due to the excessive work and costs associated with phenotyping and genotyping in large populations.
In spite of the availability of several papers on genetic mapping, specific studies relating to the determination of the ideal number of individuals in a given population needed to establish accurate genetic maps have as yet been inconclusive. The clarification of this aspect is extremely important for optimizing the time and costs associated with molecular analyses allowing breeding programs to obtain improved lines in selective process with the maximum effi-ciency. This paper describes simulation studies aimed at es-tablishing the accuracy of genetic mapping in different experimental populations used in breeding programs, as well as verifying how the size of these populations affects the quality of genetic maps.
A hypothetical genome composed of a single 81.093 centimorgan (cM) linkage group and nine equally spaced molecular markers was developed and used to simulate BC populations: F2with dominant markers; F2with
co-domi-nant markers; recombico-domi-nant inbred lines (RIL); and double haploids (DH). Each population type was investigated for population sizes of 50, 100, 150, 200, 500 and 1000 indi-viduals. When a total of 100 replicates were performed in each case, 3,000 simulated populations were generated.
The simulation process was performed using the fol-lowing steps: 1) simulation of a single 81.093 cM linkage group and nine equidistant molecular markers, from which the recombination percentages were expressed using Kosambi’s mapping function; 2) establishment of the ho-mozygous and contrasting diploid genitors for the nine markers generating F1individuals, with all markers in the
coupling phase; 3) simulation of a gametic group proceed-ing from F1 to form mapping populations. A biological
model was adopted in which the pairing of homologous chromosomes and the exchanges between these chromo-somes took place among regions delimited by the markers. The probability for recombination in a region between ad-jacent markers is given by the genomic distance between the markers,e.g.if the genomic distance (r) between the first two markers in the chromosome is 10 cM the recombi-nation probability in this region will be 10%. Concerning the simulation of the RIL population obtained after succes-sive cycles of self-pollination, the recombination
probabil-ity in this region will be 16.667% (i.e.[r’ = 2r/(1+2r)]) and it was also assumed that the interference was null; 4) the generation of a single individual in the population involved 10,000 gametes of each genitor and from this pool two ga-metes were used for the BC or F2populations and only one
was used for the DH and RIL populations.
Using the dataset simulated for each population type and size, genetic maps were constructed considering the maximum recombination frequency to be 30 cM and a lo-garithm of odds (LOD score) minimum of 3 as the major criteria in evaluating the linkage between two markers. The simulations and analyses were accomplished by using the GQMOL (2004) program.
The accuracy of the maps obtained in relation to the original linkage group (with 81.093 cM and nine equally spaced markers,) considered to be the true one, was estab-lished after taking into account the following criteria:
Size of the linkage group
This is given by the sum of the distances between ad-jacent markers in the linkage group.
L dk
k= 1 m -1
=
å
,where L is the size of the linkage group and dkis the
dis-tance between the adjacent markers mkand mk+1in the
ana-lyzed linkage group (k = 1,..., m - 1). Being m the number of markers in the analyzed linkage group.
Average distance of two adjacent markers in the linkage group
This is the ratio of the linkage group size by the inter-val numbers between adjacent markers in the linkage group.
d L
m -1
=
Variances of the distances between adjacent markers
This measure proved to be useful since the original linkage group presented equidistant markers. Conse-quently, the variance was null.
(
)
s2
2
=
-å
d dI 1 k k= 1 m -1
,
being I the interval numbers given by m - 1.
Stress
(
)
S 100 dok dk d
k= 1 m -1
ok 2 k= 1 m -1
= ×
å
- 2å
,where dokis the distance between the adjacent markers mk
and mk+1in the original genome (true) and dkis the distance
between the adjacent markers mkand mk+1in the analyzed
linkage group (k = 1,..., m-1).
Spearman correlation
This was used to evaluate the degree of concordance between the ordering of the markers in each analyzed link-age group and the original one.
r 1
m(m s
k 2 k= 1
m
2
=
-å
6
1
D
),
whereDkis the difference between the code attributed to the
marker mk(k = 1,..., m) at position k of the original genome
and the code of the mkmarker located at the respective k
po-sition of the linkage group obtained from the simulated population.
The minimum number of individuals in the popula-tion leading genome length, distances and mark sequences similar to the original linkage group was considered as the ideal population size. Since 100 replicates were generated from each simulation study, the analyses were based on the average values of the previously described criteria.
The type and size of the populations proved to affect the accuracy of the genetic mapping. Concerning size, the populations with 50 and 100 individuals were the ones un-able to reconstitute the original (or true) genome and they also presented the less accurate genetic maps (Table 1). In
populations containing 50 individuals (except for the co-dominant F2 population), the establishment of more than
one linkage group was observed in approximately 38%, 23%, 2%, 1% of the simulations for the RIL, dominant F2,
BC and DH populations respectively. These results indicate that this proposed population size is not adequate consider-ing that the expectation would be to reconstitute only a sin-gle linkage group. In addition, inversions in the order of the markers were observed (as indicated by the Spearman cor-relation (r) differing from 1 in all the population types (Ta-ble 1). In populations containing 100 individuals only 2% of the simulations using the RIL population presented the establishment of more than one linkage group, and there was an inversion in the order of the markers for the domi-nant F2, BC and RIL populations. Moreover, it was evident
that populations with a lower number of individuals showed higher stress values and higher distance variances as well as wider deviation in these estimates and in the esti-mates of the genome size (Table 2). All these results pointed to the low levels of accuracy of the information ob-tained with genetic maps generated from studies with a rel-atively low number of individuals.
In all population types the increase in the number of individuals provided less variable measures of genome size as well as variance in both intervals and stress in the 100 simulations performed for each case (Table 2). In addition, stress values and the variance interval showed a statistically significant reduction when the population size was increa-sed (Table 2). Therefore, the mapping accuracy increases with an increased number of individuals in the population.
Table 1- Number linkage groups formed and Spearman correlation differing from 1 for different population types and sizes.
Number linkage groups
Population 1 linkage group with 9 markersa
1 linkage group with 8 markers
2 linkage groups
3 linkage groups
With Spearman r different from 1b
F2dominant
50 62 7 23 - 8
100 96 - - - 4
Backcrossing
50 87 - 2 - 11
100 99 - - - 1
RIL
50 66 1 23 5 5
100 99 - - - 1
Duble haploid
50 88 - 1 - 11
F2co-dominant
50 96 - - - 4
a
The higher the number of individuals the better the estimate of the genome size, as indicated by the lowest stress. This raises the question as to what is the maximum acceptable stress value that can be used for mapping. The average stress values in the populations depended on popu-lation size (n) and were: 32% to 43.7% for n = 50; 22% to
33% for n = 100; 19% to 25% for n = 150; 16.5% to 23% for n = 200; 11% to 14% for n = 500; and 7.9% to 10.4% for n = 1000. In all cases, the co-dominant F2 population
showed the lowest variation whereas the dominant F2
popu-lation presented the highest variation. For a better under-standing of the meaning of stress, it may be explained as a
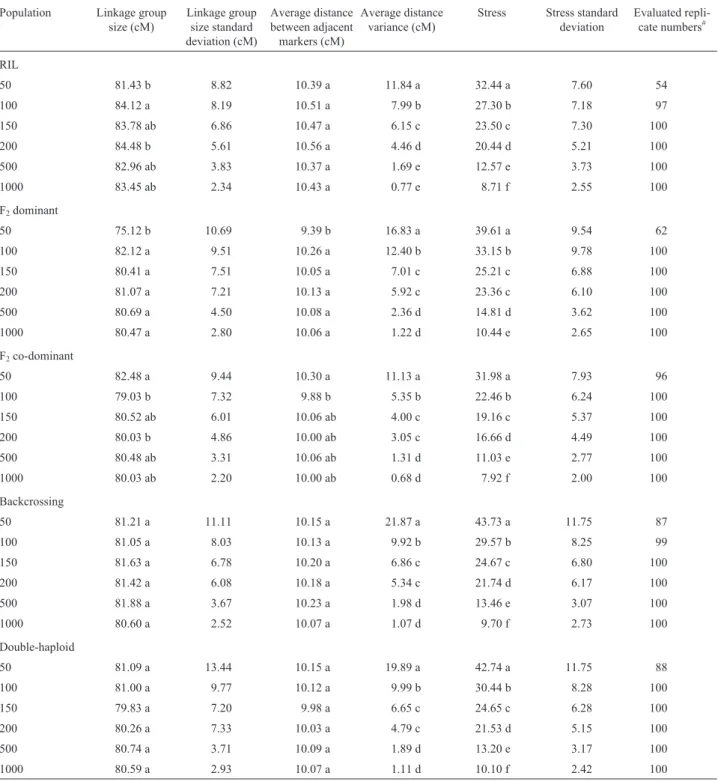
Table 2- Average linkage group size, distance between adjacent linkage group markers and stress in different population types and sizes.
Population Linkage group size (cM)
Linkage group size standard deviation (cM)
Average distance between adjacent markers (cM)
Average distance variance (cM)
Stress Stress standard deviation
Evaluated repli-cate numbers#
RIL
50 81.43 b 8.82 10.39 a 11.84 a 32.44 a 7.60 54
100 84.12 a 8.19 10.51 a 7.99 b 27.30 b 7.18 97
150 83.78 ab 6.86 10.47 a 6.15 c 23.50 c 7.30 100
200 84.48 b 5.61 10.56 a 4.46 d 20.44 d 5.21 100
500 82.96 ab 3.83 10.37 a 1.69 e 12.57 e 3.73 100
1000 83.45 ab 2.34 10.43 a 0.77 e 8.71 f 2.55 100
F2dominant
50 75.12 b 10.69 9.39 b 16.83 a 39.61 a 9.54 62
100 82.12 a 9.51 10.26 a 12.40 b 33.15 b 9.78 100
150 80.41 a 7.51 10.05 a 7.01 c 25.21 c 6.88 100
200 81.07 a 7.21 10.13 a 5.92 c 23.36 c 6.10 100
500 80.69 a 4.50 10.08 a 2.36 d 14.81 d 3.62 100
1000 80.47 a 2.80 10.06 a 1.22 d 10.44 e 2.65 100
F2co-dominant
50 82.48 a 9.44 10.30 a 11.13 a 31.98 a 7.93 96
100 79.03 b 7.32 9.88 b 5.35 b 22.46 b 6.24 100
150 80.52 ab 6.01 10.06 ab 4.00 c 19.16 c 5.37 100
200 80.03 b 4.86 10.00 ab 3.05 c 16.66 d 4.49 100
500 80.48 ab 3.31 10.06 ab 1.31 d 11.03 e 2.77 100
1000 80.03 ab 2.20 10.00 ab 0.68 d 7.92 f 2.00 100
Backcrossing
50 81.21 a 11.11 10.15 a 21.87 a 43.73 a 11.75 87
100 81.05 a 8.03 10.13 a 9.92 b 29.57 b 8.25 99
150 81.63 a 6.78 10.20 a 6.86 c 24.67 c 6.80 100
200 81.42 a 6.08 10.18 a 5.34 c 21.74 d 6.17 100
500 81.88 a 3.67 10.23 a 1.98 d 13.46 e 3.07 100
1000 80.60 a 2.52 10.07 a 1.07 d 9.70 f 2.73 100
Double-haploid
50 81.09 a 13.44 10.15 a 19.89 a 42.74 a 11.75 88
100 81.00 a 9.77 10.12 a 9.99 b 30.44 b 8.28 100
150 79.83 a 7.20 9.98 a 6.65 c 24.65 c 6.28 100
200 80.26 a 7.33 10.03 a 4.79 c 21.53 d 5.15 100
500 80.74 a 3.71 10.09 a 1.89 d 13.20 e 3.17 100
1000 80.59 a 2.93 10.07 a 1.11 d 10.10 f 2.42 100
Notes: For each population the same letter in the same column indicates that there was no statistically significant difference between the averages by the Tukey test at p = 5%. cM = centimorgans. The size of the simulated genome was 81.093 and the average distance 10.137.#Simulations forming a linkage
function of the average deviation of the distances both be-tween adjacent markers in the linkage group and those in the original genome. Therefore, the previously expression of stress can be rewritten as S = [(d/d0).100], wheredis the
average deviation of the distances by interval in the ana-lyzed linkage group in relation to the original genome, and dois the distance between adjacent markers in the original
genome (10 cM in this case). For instance, a stress value of 20% corresponds to an average deviation of 2 cM for each interval in the linkage group, that is, if the real distance be-tween two adjacent markers is 10 cM and if a 20% stress is acceptable, the distance might vary from 8 to 12 cM. Then, the researcher should decide if this variation might or might not interfere with the objectives of the mapping study.
In order to verify the differences between the popula-tion types, a comparison between the averages obtained for those populations containing 1,000 individuals was made. It was assumed that these populations are more stable, so the differences between them are more likely to be related to the type and not to the size of the population. The co-dominant F2and RIL populations presented the lowest
average stress (7.92 F2and 8.71% for the RIL population),
whereas the dominant F2 population showed the highest
stress value (10.44%). The differences between the aver-ages proved to statistically significant (Tukey test at p = 5%). Both the RIL and co-dominant F2populations
pre-sented lower distance variances between adjacent markers in the linkage group than did the other population types, in-dicating that these populations would provide the highest levels of accuracy in genetic mapping.
The performance of each population type relative to the increase in the number of individuals in the population is shown in Table 2. Taking into account the average size of the genome and the average distance in the DH and BC populations, there were no statistically significant differ-ences in the averages among the populations. However, for dominant F2and RIL populations, both the average of the
genome size and the average distance were lower in the map constructed with 50 individuals than were those con-taining other population sizes. Stress and variance values were significantly reduced with the increased number of in-dividuals for all populations. Thus, to obtain a more reliable genetic map it is necessary to use experimental populations with higher numbers of individuals.
The F2population provided the best and the worst
es-timates for stress and variance, depending on the marker type to be used. The F2population with co-dominant
mark-ers showed the lowest values for stress and variance for all population sizes, whereas RIL was the second best popula-tion. Taking into account the importance of this population in the design of QTL mapping experiments, this result is important because RIL populations allow replicates of the same genotype, a process which minimizes the environ-mental error.
According to Burr and Burr (1991), the choice of the population type for genetic mapping might have important consequences concerning the efficiency and utility of the genetic information. Hanson (1959) and Liu (1998) demon-strate that a given population size affects the power to de-tect linkage as well as the estimate and accuracy of the recombination frequency. In addition, the type of markers should also be taken into account when an experiment with genetic mapping is established.
In the present study, the genetic mapping conducted with populations containing of 50 and 100 individuals was clearly inadequate, as indicated by different comparison parameters and different population types. Considering that the original genome had a satisfactory degree of saturation (around 10 cM between each marker) the low number of re-combination events in the populations with a lower number of individuals might be the explanation for the establish-ment of more than one linkage group in the dominant F2
population.
The inversion of marker order occurring in all types of population with a size of 50 and (more frequently) 100 individuals is described in the literature as a problem gener-ated by both the size of the population and the saturation of the map. Liu (1998) used simulations to demonstrate that for a population of 100 individuals the confidence in the or-dering is 90% and drops to 60% when the population size is 50. Liu also states that if the genes are strongly linked (i.e.1 cM) a large number of individuals are necessary to obtain the accurate gene order with high confidence.
For some genome mapping applications the accurate ordering of the markers and the high resolution of the linka-ge map are not always necessary. However, high levels of accuracy are necessary for QTL location aimed at posi-tional gene cloning (Van Ooijen, 1992; Liu, 1998). In this case highly accurate estimates (between 1 and 2 cM) of QTL location are needed for application of the physical mapping and QTL cloning procedures (Darvasi et al., 1993) and detailed mapping techniques are necessary in or-der to obtain better resolution. However, from a plant breeding perspective the high accuracy of the distance esti-mates might not be so restrictive since the processes based on marker-assisted selection might become viable only with information about the markers flanking a given QTL, and such QTLs can be satisfactorily detected when it pres-ents significant phenotypic effects (Van Ooijen, 1992).
Concerning different population types, both the F2
populations with co-dominant markers and RILs presented the most accurate mapping results. Nevertheless, it is well-known that the RIL population is distinguished from the F2,
20 cM are not frequently detected in RIL because of high recombination frequencies (Burret al., 1988). This might have serious consequences because it may lead to linkage not being detected when it in fact exists.
In the attempts to reconstitute the original genome a high frequency of two to three linkage groups was observed in the RIL population containing a low number of individu-als but when the number of individuindividu-als increased the stress and variance estimates indicated that RIL always produced better results than the than those BC, double hybrid and dominant F2populations, demonstrating the relative
effi-ciency of the RIL population for genetic mapping.
The accuracy of genetic mapping is a function of the size and type of the population under study since the accu-racy of the genetic distance estimates is directly related to these two parameters. In all population types, populations of 500 and 1,000 individuals were the ones providing the best genetic maps relative to the original genome as shown by the fact that these populations had the lowest es-timates of stress and variance of the distances between marker pairs in the linkage group. However, populations with a high number of individuals might not be viable be-cause they increase the costs and require more labor, space and time for genetic mapping. Our results showed that in different populations a total of 200 individuals are enough for the construction of reasonably accurate genetic maps with the most efficient populations being the F2
popula-tion with co-dominant markers and the RIL populapopula-tion. Thus, the number of individuals in the population may be determined as a function of the required accuracy level and the technical and scientific return on the information obtained. Therefore, the researcher should decide the reli-ability of the map, given the fact that constructing genetic maps with a higher or lower accuracy will influence the aims and costs of the study. One option would be to em-ploy more informative populations and markers that allow the use of a lower number of individuals and maintain the efficiency of genetic mapping. Although this paper deals with plant populations this approach is equally applicable to other organisms.
References
Ahn S and Tanksley SD (1993) Comparative linkage maps of the rice and maize genomes. Proc Natl Acad Sci 90:7980-7984.
Burr B and Burr FA (1991) Recombinat inbreds for molecular mapping in maize: Theoretical and practical considerations. Trends Gent 7:55-60.
Burr B, Burr FA, Thompson KH, Albertson MC and Stuber CW (1988) Gene mapping with recombinant inbreds in maize. Genetics 118:519-526.
Cruz CD and Carneiro PCS (2003) Modelos biométricos apli-cados ao melhoramento genético. v. 2. Editora UFV, Viçosa, 623 pp.
Darvasi A, Weinreb A, Minke V, Weller JI and Soller M (1993) Detecting marker-QTL linkage and estimating QTL gene ef-fect and map location using a saturated genetic map. Genet-ics 134:943-951.
Doerge R (2002) Mapping and analysis of quantitative trait loci in experimental populations. Nature Reviews 3:43-52. GQMOL, http://www. ufv.br/dbg/gqmol/gqmol.htm.
Hanson WD (1959) Minimum family size for the planning of ge-netic experiments. Agronomy Journal 51:711-715. He P, Li JZ, Zheng XW, Shen LS, Lu CF, Chen Y and Zhu LH
(2001) Comparison of molecular linkage maps and agro-nomic trait loci between DH and RIL populations derived from the same rice cross. Crop Science 41:1240-1246. Kosambi DD (1944) The estimation of map distances from
re-combination values. Ann Eugen 12:172-75.
Lander ES and Botstein D (1989) Mapping Mendelian factors un-derlying quantitative traits using RFLP linkage maps. Ge-netics 121:185-199.
Liu HB (1998) Statistical Genomics, Linkage, Mapping and QTL Analysis. CRC, Boca Raton, Florida, 611 pp.
Lynch M and Walsh B (1998) Genetic Analysis of Quantitative Traits. Sinauer Associets, Sunderland, Massachusetts, 980 pp.
Melchinger AE, Utz HF and Schön CC (1998) Quantitative trait locus (QTL) mapping using different testers and independ-ent population samples in maize reveals low power of QTL detection and large bias in estimates of QTL effects. Genet-ics 149:383-403.
Mohan M, Nair S, Bhagwat A, Krishna TG and Yano M (1997) Genome mapping, molecular markers and marker-assisted selection in crop plants. Molecular Breeding 3:87-103. Paterson AH, Bowers JE, Burow MD, Draye X, Elsik CG, Jiang
C-X, Katsar CS, Lan TH, Lin YR, Ming R and Wright RJ (2000) Comparative genomics of plant chromosomes. The Plant Cell 12:1523-1539.
Soller MT, Broddy T and Genizi A (1976) On the power of experi-mental designs for detection of linkage between marker loci and quantitative loci in crosses between inbred lines. Theor Appl Genet 47:35-39.
Van Ooijen JW (1992) Accuracy of mapping quantitative trait loci in autogamous species. Theor Appl Genet 84:803-811.