pISSN 1899-5241 eISSN 1899-5772
Journal of Agribusiness
and Rural Development
www.jard.edu.pl
4(34) 2014, 99-109
Copyright © Wydawnictwo Uniwersytetu Przyrodniczego w Poznaniu
Corresponding author – Adres do korespondencji: prof. dr hab. in . Jan Pawlak, Instytut
Techno-POLISH FARM MACHINERY MARKET
AFTER ACCESSION TO THE EUROPEAN UNION –
PRICES OF MEANS OF AGRICULTURAL
MECHANIZATION
Jan Pawlak
Institute of Technology and Life Sciences, Warsaw Branch
Abstract. VAT for farm machinery has been increased from 0 to 22% level since the ac-cession to the EU. This was a main reason for rise in prices of a set of 34 farm machines which in June 2004 was by 28.1% higher than a year earlier. Thanks to the decrease in prices of the most expensive farm machines – harvester threshers, during the years 2006- -2009 the price level was quite stable, even though prices of most machines rose. From 2010 moderate, but generally higher than the inflation rate rise in price of the set was ob-served. During the years 2003-2013 the price of the set of 34 farm machines grew more expensive by 66.7%, whilst the inflation index increased by 32.6%. In 2004, 2005, 2010 and 2013 the rate of increase of prices of farm machines was higher than dynamics of the inflation index (relatively by 16.8, 15.5, 3.5 and 3.1 per cent points). In spite of machinery price growth, the equivalent of the set of 34 machines in form of mass or volume of swine and cattle for slaughter, wheat, milk and potato was in 2013 by 1.0 to 33.3% lower than in 2003. The above mentioned set as related to the unit of mass of rye and sugar beet was by 4.1 and 40.3% more expensive.
Key words: farm machinery market, prices, price relations
INTRODUCTION
changes. The accession also had an effect on farm machinery market, and indirectly on the development of agricultural mechanization. Farm mechanization has a very high share in production costs of Polish agriculture. Its importance has been the reason to undertake this study.
Unfavourable agrarian structure affecting farm efficiency has been the weakness of Polish agriculture for centuries. Agrarian transformations observed after 2004 are evi-dent, however, they did not bring Poland any closer to the level of leading EU Member States [Klepacki and ak 2013]. This is an important factor impeding the improvement of production factors’ efficiency in Polish agriculture. As compared to most developed countries of the world Poland has lower productivity both of land and labour in agricul-ture. Therefore, the perspective model of our agriculture has to take into account as far as the improvement of basic production indexes. The biological and chemical advance-ment can ensure both the growth of the land productivity and technology – increase of the productivity of labour [Michałek 2009].
Polish agriculture belongs to the group of countries with highest labour inputs among the member states of the EU and three times lower than EU average capi-tal/labour ratio [Baer-Nawrocka and Markiewicz 2013]. Technological and ecological modernisation of farms is then necessary. The first of them is based on implementation of new technologies in plant and animal production. This is connected with purchases of modern machinery. So far, the most intensive progress was observed in purchases of tractors [Wójcicki 2009]. According to former IBMER forecasts, until 2020 about 500 thousand of family farms will be the subject of technological modernisation and on about 100 thousand of them ecological production will be carried out [Stan i kierunki... 2005, Golka and Wójcicki 2009]. Dynamics of the modernisation will depend on in-vestment abilities of farmers, which is a derivative of their incomes. Modernization possibilities evaluated for 53 family farms of diversified size showed that the farms of acreage less than 28 ha AL do not attain enough funds to be modernized by investment inputs, reproduction of capital assets, at assuring financial means for the maintenance of farmer’s family. Some possibilities of farm modernization exist in objects of the acreage ranging within 28-40 ha AL. However, the farms operating on the acreage of over 40 ha AL revealed significant investment opportunities to modernization [Sawa 2012]. In-vestment abilities of farmers depends also on intensity of production organization. Re-sults of investigations carried out by University of Life Sciences in Lublin on 46 family farms showed that there are relationships between the intensity of production organiza-tion and both the capital-labour ratio as well as producorganiza-tion efficiency and the farmer’s family income [Parafiniuk 2013].
Technological progress, achieved thanks to investments on modernization of the livestock buildings and purchases of new machines for green forage harvesting, posi-tively affected an increase of farmers’ gross income and caused reduction of their labour inputs on mountain dairy farms investigated by the Institute of Technology and Life Sciences within 2006-2010. Over these years the incomes increased by 2.7-29.9% whilst the farmers’ own labour inputs decreased by 5.2-23.8% [Jucherski and Król 2012].
of agricultural mechanization more accessible to farmers. In order to evaluate the effects of new situation in Polish agriculture, the current monitoring of the farm machinery market is necessary. Taking into account the above-mentioned twofold effect of acces-sion to the EU, the undertaken analysis – owing to the extensiveness of the subject pre-sented in separate articles – will concern 2 aspects of the subject:
– trends in price situation of farm machinery,
– home supply and production of means of agricultural mechanization.
The purpose of this article is an analysis referring to prices of means of agricultural mechanization and their relations to selected agricultural products within the years 2003-2013.
MATERIAL AND METHODS
Data of the Central Statistical Office, concerning prices of farm machinery as well as gross value added in agriculture have been used as a base for analyses of prices on Polish farm machinery market. Tractor and 33 types of machines have been selected as a sample for the study. The availability of comparative data for all period of the study has been the criterion of the choice. Only in cases of 90 kW, 4 WD tractor – in 2003, harvester threshers – in 2003 and 2004, as well as for potato planter milk refrigerator estimated data were adopted, basing on price dynamics of most similar types of ma-chines. Only 2.7% of the data used in the study were results of such estimations.
Apart from analyses of dynamics of prices of particular machines, the price of the whole 34 means of agricultural mechanisation set within the years 2003-2013 was cal-culated. This was a base for indexes of rise in prices of the set, as related to the situation in 2003 and to the study of price relations between farm machinery and some agricul-tural products. In addition, relations between price of the set and gross value added in agriculture (in current prices) have been determined for particular years of the period 2003-2012.
RESULTS AND DISCUSSION
VAT has been increased from 0 to 22% level since the accession to the EU. As a re-sult the price of a set of 34 farm machines was in June 2004 by 28.1% higher than a year earlier. As the change of the tax level occurred on May 1st, the effects of this fact only partly affected the average yearly price of 2004. Its influence was observed also in 2005. Within the years 2003-2013 the price of particular means of agricultural mechani-zation increased by 30.8 to 294.7% (Table 1). Growth in prices of farm machines has been generated not only by taxes, but also by growing costs of raw materials and ener-gy, and in some cases – by improvement of the product standard.
Table 1. Prices of farm machines in PLN Tabela 1. Ceny maszyn rolniczych w złotych
Specification
Wyszczególnienie 2003 2004 2013
1 2 3 4
Tractor 90 kW (4WD) Ciągnik 90 kW (4WD)
101 900 125 961 187 617
Agricultural self unloading trailer Przyczepa rolnicza samowyładowcza
13 888 16 706 37 068
3-moldboard tractor plough Pług ciągnikowy trzyskibowy
1 840 2 531 5 766
3-moldboard tractor plough TUR Pług ciągnikowy trzyskibowy TUR
4 641 6 384 10 041
4-moldboard tractor plough Pług ciągnikowy czteroskibowy
3 949 5 432 11 521
Cultivator Kultywator
919 1 138 3 627
Rototiller Glebogryzarka
2 843 3 863 6 036
Tillage aggregate Agregat uprawowy
2 827 3 539 7 800
3-section harrow Brona trzypolowa
608 806 1 426
5-section harrow Brona pięciopolowa
892 1 220 2 180
Fertilizer spreader Rozsiewacz nawozów
1 192 1 319 1 876
1-ax manure spreader
Roztrząsacz obornika jednoosiowy
9 134 13 098 30 345
2-ax manure spreader
Roztrząsacz obornika dwuosiowy
12 524 18 679 45 791
Seed drill Siewnik nasion
7 453 10 142 21 603
Tillage aggregate for seed drill Agregat uprawowy do siewnika
8 746 11 539 16 479
2-row potato planter
Sadzarka do ziemniaków dwurzędowa
4 315 5 580 13 831
Sprayer 400 l Opryskiwacz 400 l
2 488 2 951 4 350
3-section inter-row cultivator Pielniko-obsypnik trzyrzędowy
549 707 1 203
Rotary mower 1650 mm Kosiarka rotacyjna 1650 mm
3 670 4 603 6 927
Pick-up baler Prasa zbierająca
Table 1 – cont. / Tabela 1 – cd.
1 2 3 4
Round baler Prasa zwijająca
34 854 38 230 55 522
Wrapper for bales Owijarka do bel
7 880 9 138 11 820
Harvester thresher TC 5050 Kombajn zbo owy TC 5050
269 189 316 824 385 399
Harvester thresher TC 5070 Kombajn zbo owy TC 5070
328 592 386 740 484 436
2-row potato digger
Kopaczka do ziemniaków dwurzędowa
6 328 8 023 14 740
1-row potato harvester
Kombajn do ziemniaków jednorzędowy
32 182 41 271 77 528
Universal shredder Rozdrabniacz uniwersalny
2 403 2 871 4 300
Hammer feed mill Rozdrabniacz bijakowy
3 023 3 577 6 855
Electric steamer Parnik elektryczny
759 881 1 240
Solid fuel steamer Parnik na paliwo stałe
347 417 682
Pipeline milking machine Dojarka z rurociągiem mlecznym
32 024 40 350 41 889
2-pot milking machine Dojarka dwukonwiowa
5 650 7 119 8 300
Milk refrigerator 500 l Schładzarka do mleka 500 l
11 865 15 371 17 200
Watering cup Poidło miskowe
54 61 73
Source: data of Central Statistical Office and: Pawlak [2010, 2012], Rynek... [2014]. ródło: dane GUS oraz: Pawlak [2010, 2012], Rynek... [2014].
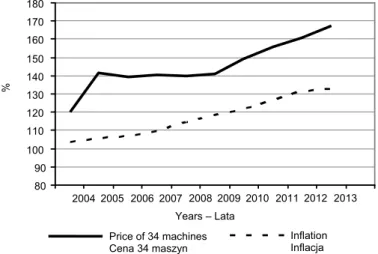
The most dynamic rise in price of the set of 34 machines was observed in 2004 and 2005 respectively by 20.4 and 17.9%. During the years 2006-2009 the price level was quite stable, even though prices of some machines rose. This was due to decrease in prices of the most expensive farm machines – harvester threshers. From 2010 moderate, but generally higher than the index of general price level of goods and services (infla-tion) in Polish economy rise in price of the set was observed. During the years 2003- -2013 the inflation index increased by 32.6%. In the years 2004, 2005, 2010 and 2013 the rate of increase of prices of farm machines was higher than dynamics of the inflation index (relatively by 16.8, 15.5, 3.5 and 3.1 per cent points – p. p.) (Fig. 2).
Instead, during other 5 years the rate of increase in prices of farm machines was by 0.6-4.6 lower then inflation and in 2011 the dynamics of both indexes was equal.
Fig. 1. Dynamics of price of representative 34 farm machines
Source: own elaboration basing on data of Central Statistical Office [Prices... 2005, 2006, 2007, 2008, 2009, 2013, 2014].
Rys. 1. Dynamika cen zestawu 34 maszyn i narzędzi rolniczych
ródło: opracowanie własne na podstawie danych GUS [Prices... 2005, 2006, 2007, 2008, 2009, 2013, 2014].
Fig. 2. Price of representative 34 farm machines set versus inflation index (2003 = 100)
Source: own elaboration basing on data of Central Statistical Office [Prices... 2005, 2006, 2007, 2008, 2009, 2013, 2014]. Rys. 2. Cena zestawu 34 rodków mechanizacji rolnictwa na tle
infla-cji (2003 = 100)
ródło: opracowanie własne na podstawie danych GUS [Pri-ces... 2005, 2006, 2007, 2008, 2009, 2013, 2014].
80 90 100 110 120 130 140 150 160 170 180
2004 2005 2006 2007 2008 2009 2010 2011 2012 2013 Years – Lata
%
Price of 34 machines Cena 34 maszyn
Inflation Inflacja 0
100 200 300 400 500 600 700 800 900 1000 1100 1200 1300 1400 1500 1600 1700
2003 2004 2005 2006 2007 2008 2009 2010 2011 2012 2013
Years – Lata
[t
h
ous.
. PLN –
ty
s.
z
ł
a case of: harvesting forage with a harvester – by 59.8%, sowing seeds with a row seed-er – by 40.5%, planting potatoes – by 39.2%, ploughing by 37.3% and stubble tillage with a disc harrow – by 37.3% [Piwowar 2012].
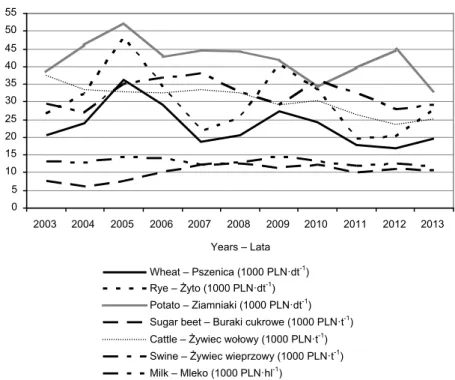
In spite of machinery price growth, the equivalent of the set of 34 machines in form of mass in cases of swine for slaughter, wheat, milk, potato and cattle was in 2013 by 1.0 to 33.3% lower than in 2003. Instead, the above mentioned set as related to the unit of mass of rye and sugar beet was more expensive by 4.1 and 40.3 % (Fig. 3).
Fig. 3. Mass or volume of selected agricultural products as equivalent of price of machinery set Source: own elaboration basing on data of Central Statistical Office [Prices... 2005, 2006, 2007, 2008, 2009, 2013, 2014, Statistical Yearbook... 2008, 2009, 2010, 2011, 2014].
Rys. 3. Masa lub objętoć wybranych produktów rolnych stanowiąca ekwiwalent ceny zestawu
rodków mechanizacji rolnictwa
ródło: opracowanie własne na podstawie danych GUS [Prices... 2005, 2006, 2007, 2008, 2009, 2013, 2014, Statistical Yearbook... 2008, 2009, 2010, 2011, 2014].
Trends in relations between prices of farm machinery and agricultural products to a different degree concerned particular groups of farmers, according to the kind of activ-ity. For most of them the most unfavourable situation was in 2004 and 2005, when the growth in prices of machines had its highest dynamics. Especially unfavourable was then the situation of cereals producers, because prices of wheat and rye were lower then during other years of the studied period. The situation in that year was also especially unfavourable for potato producers. Instead, because the price of sugar beets was the highest in 2004, the situation for producers of this raw material was at that time the most favourable. Strongly marked increase in price of cattle for slaughter, which in
0 5 10 15 20 25 30 35 40 45 50 55
2003 2004 2005 2006 2007 2008 2009 2010 2011 2012 2013
Years – Lata
Wheat – Pszenica (1000 PLN·dt-1) Rye – yto (1000 PLN·dt-1) Potato – Ziamniaki (1000 PLN·dt-1) Sugar beet – Buraki cukrowe (1000 PLN·t-1) Cattle – ywiec wołowy (1000 PLN·t-1
2012 was by 156% more expensive than in 2003, caused that from the point of view of cattle for meat producers changes in price relations had a positive direction. It is proper to note that also prices of particular farm machines had changed to a different rate. Within the years 2008 and 2009 a decrease in prices of harvester threshers was ob-served. At the same time prices of trailers, tillage equipment, machines for fertilization, sowing, planting and plant protection, as well as most of harvest machinery increased.
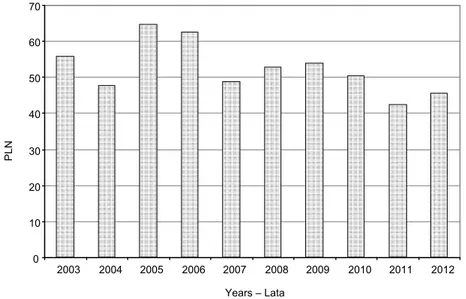
From a farmer’s point of view as an investor, not only mass or volume of agricultur-al products being an equivagricultur-alent of price of machine which he is going to buy is im-portant, but also the level of production obtained. In a case of agriculture as comprehen-sively considered, the most convenient reference to farm machinery prices is the value of production. The relation between the price of the set of 34 means of farm mechaniza-tion and the gross value added in agriculture has been affected by fluctuamechaniza-tion of the value within the period of the analyses. Most unfavourable situation, from the agricul-tural point of view, was observed in 2005, followed by 2006, 2003, 2009 and 2008. Instead the most favourable was the situation in 2011 (Fig. 4).
Fig. 4. Price of representative set of 34 farm machines in PLN per million PLN of gross value added in agriculture
Source: own elaboration basing on Central Statistical Office [Prices... 2005, 2006, 2007, 2008, 2009, 2013, 2014, Statistical Yearbook... 2008, 2009, 2010, 2011, 2014].
Rys. 4. Cena zestawu 34 rodków mechanizacji rolnictwa w zł w przeliczeniu na mi-lion zł warto ci dodanej brutto w rolnictwie
ródło: opracowanie własne na podstawie danych GUS [Prices... 2005, 2006, 2007, 2008, 2009, 2013, 2014, Statistical Yearbook... 2008, 2009, 2010, 2011, 2014].
In 2011 Polish agriculture achieved the highest gross value added in current prices (34 721 million PLN).
0 10 20 30 40 50 60 70
2003 2004 2005 2006 2007 2008 2009 2010 2011 2012
Years – Lata
CONCLUSION
The accession to the EU on May 1st 2004 was connected with increasing the VAT rate from 0 to 22% level. As a result the price of a set of 34 farm machines was in June 2004 by 28.1% higher than a year earlier. The rate of the price growth was strongly differentiated. As compared to 2003, in 2013 particular means of agricultural mechani-zation were by 30.8 to 294.7% more expensive.
Within the years 2008 and 2009 the decrease in prices of harvester threshers was ob-served, the prices of trailers, tillage equipment, machines for fertilization, sowing, plant-ing and plant protection, as well as most of harvest machinery increased.
In 2013 the price of representative set including 34 means of agricultural mechaniza-tion was by 66.7 % higher than in 2003. At the same time the inflamechaniza-tion index increased by 32.6%.
In spite of machinery price growths, the equivalent of the set of 34 machines in form of mass in cases of swine and cattle for slaughter, wheat, potato and volume of milk was in 2013 by 1.0 to 33.3% lower than in 2003. Instead, the above mentioned set as related to the unit of mass of rye and sugar beet was more expensive relatively by 4.1 and 40.3%.
Trends in relations between prices of farm machinery and agricultural products to a different degree concerned particular groups of farmers, according to the kind of activ-ity. For most of them the most unfavourable situation was in 2004 and 2005, when the growth in prices of machines had its highest dynamics. Especially unfavourable was then the situation of cereals and potato producers, because prices of wheat and rye were in 2005 lower than during other years of the studied period and in a case of potato – only slightly higher than in 2003. Instead, since the price of sugar beets was the highest in 2004, the situation for producers of this raw material was at that time the most fa-vourable.
Strongly marked increase in price of cattle for slaughter, which in 2012 was by 156% more expensive than in 2003, caused that from the point of view of cattle for meat producers changes in price relations had a positive direction.
Most unfavourable (from the agriculture point of view) relation between the price of the set of 34 means of farm mechanization and the gross value added in agriculture was observed in 2005, followed by: 2003, 2006, 2009 and 2008. However, the most favour-able was the situation in 2011.
REFERENCES
Baer-Nawrocka A., Markiewicz N., 2013. Relacje między czynnikami produkcji a efektywnoć
wytwarzania w rolnictwie Unii Europejskiej. J. Agribus. Rural Dev. 3(29), 5-16.
Golka W., Wójcicki Z., 2009. Ocena działalno ci rozwojowych gospodarstw rodzinnych. Probl.
In . Roln. 1(63), 35-42.
Jucherski A., Król K., 2012. Wpływ postępu technologicznego na efekty ekonomiczne
wybra-nych górskich gospodarstw rodzinwybra-nych. Probl. In . Roln. 3(77), 25-34.
Michałek R., 2009. Uwarunkowania kształtujące model współczesnego rolnictwa. Probl. In . Roln. 2(64), 5-11.
Parafiniuk S., 2013. Wyposa enie techniczne a efektywnoć pracy w gospodarstwach o ró nych
systemach produkcji rolniczej. Probl. In . Roln. 2(80), 115-121.
Pawlak J., 2010. Produkcja i ceny maszyn rolniczych w Polsce po wej ciu do UE. Probl. In . Roln. 1(67), 45-53.
Pawlak J., 2012. Rynek ciągników rolniczych w Polsce w latach 2000-2010. Probl. In . Roln.
1(75), 5-14.
Piwowar A., 2012. Zmiany na rynku rolniczych usług mechanizacyjnych w Polsce w latach 2004- -2009. J. Agribus. Rural Dev. 4(26), 81-90.
Prices in the national economy in 2004. 2005. Central Statistical Office, Warsaw. Prices in the national economy in 2005. 2006. Central Statistical Office, Warsaw. Prices in the national economy in 2006. 2007. Central Statistical Office, Warsaw. Prices in the national economy in 2007. 2008. Central Statistical Office, Warsaw. Prices in the national economy in 2008. 2009. Central Statistical Office, Warsaw. Prices in the national economy in 2012. 2013. Central Statistical Office, Warsaw.
Prices in the national economy in 2013. 2014. Central Statistical Office, Warsaw. http://old.stat. gov.pl/gus/5840_ceny_w_gospodarce_PLK_HTML.htm.
Rynek rodków produkcji dla rolnictwa. Stan i perspektywy. 2014. Red. A. Zalewski. IERiG - -PIB, ARR, MRiRW, Warszawa.
Sawa J., 2012. Opis procesów produkcji gospodarstwa jako warunek jego modernizacji. Probl. In . Roln. 3(77), 15-24.
Stan i kierunki rozwoju techniki oraz infrastruktury rolniczej w Polsce. 2005. Red. A. Szeptycki. IBMER, Warszawa.
Statistical Yearbook of Agriculture 2007. 2008. Central Statistical Office, Warsaw. Statistical Yearbook of Agriculture 2008. 2009. Central Statistical Office, Warsaw. Statistical Yearbook of Agriculture 2009. 2010. Central Statistical Office, Warsaw. Statistical Yearbook of Agriculture 2010. 2011. Central Statistical Office, Warsaw. Statistical Yearbook of Agriculture 2013. 2014. Central Statistical Office, Warsaw.
Wójcicki Z., 2009. Potrzeby i mo liwo ci inwestycyjne rozwojowych gospodarstw rodzinnych. Probl. In . Roln. 3, 5-12.
POLSKI RYNEK MASZYN ROLNICZYCH PO WEJ CIU DO UNII EUROPEJSKIEJ – CENY RODKÓW MECHANIZACJI ROLNICTWA
Streszczenie. Po wstąpieniu Polski do Unii Europejskiej zwiększono stawkę VAT na sprzęt rolniczy z 0 do 22%. Było to główną przyczyną wzrostu cen zestawu 34 rodków mechanizacji rolnictwa, którego cena w czerwcu 2004 roku była o 28,1% wy sza ni rok wcze niej. Lata 2006-2009 charakteryzowała się do ć stabilną ceną zestawu, mimo
dro-enia większo ci maszyn wchodzących w jego skład. W tym czasie nastąpiły obni ki ce-ny najdro szej maszyce-ny – kombajnu zbo owego. Od 2010 roku notowano umiarkowace-ny, lecz na ogół wy szy od wska nika cen towarów i usług konsumpcyjnych (inflacji), wzrost cen zestawu. W okresie 2003-2013 podro ał on o 66,7%, podczas gdy inflacja w tym cza-sie wyniosła 32,6%. W latach: 2004, 2005, 2010 i 2013 wzrost cen zestawu przewy szał
inflację, odpowiednio o 16,8; 15,5; 3,5 i 3,1 punktu procentowego. Mimo wzrostu cen
sprzętu rolniczego od 2004 roku, ekwiwalentem zestawu 34 maszyn była w 2013 roku
mleka oraz ziemniaków. Zestaw ten podro ał w stosunku do jednostki masy yta i korzeni buraków cukrowych (o 4,1 i 40,3%).
Słowa kluczowe: rynek maszyn rolniczych, ceny, relacje cen
Accepted for print – Zaakceptowano do druku: 19.09.2014