pISSN 1899-5241 eISSN 1899-5772
Journal of Agribusiness
and Rural Development
www.jard.edu.pl
3(33) 2014, 171-183
Copyright © Wydawnictwo Uniwersytetu Przyrodniczego w Poznaniu
Corresponding author – Adres do korespondencji: prof. dr hab. in . Jan Pawlak, Instytut
Techno-POLISH FARM MACHINERY MARKET
AFTER ACCESSION TO THE EUROPEAN UNION –
PRODUCTION AND SUPPLY OF MEANS
OF AGRICULTURAL MECHANIZATION
Jan Pawlak
Institute of Technology and Life Sciences, Warsaw Branch
Abstract. After accession to the EU in 2004 the demand for tractors and agricultural im-plements has grown, followed by increasing supply of them. In 2012, the supply of brand-new agricultural tractors was by 185.4% higher than in 2003. In 2012 the value of renova-tion index of tractor fleet in agriculture was by 149.3% higher than in 2003. In spite of significant increase of demand for tractors, their production in 2012 was by 39.2% lower than in 2003. The downfall in number of tractors produced in Poland caused that imported tractors achieved more and more important share in supplies on Polish market. In 2003 the share of imports amounted to 64.0% and in 2012 – 91.4%. Production of most other means of agricultural mechanization was in 2012 higher than in 2003. The increase in a case of manure spreaders amounted to 704.3%; self loading or unloading agricultural tractor trailers – 362.1%; fertilizer spreader – 335.2%; field sowing machines – 245.3%; pick-up balers – 222.1% and harvester threshers – 194.8. Decreases were noted in cases of steamers – by 73.3%; potato planters – by 49.7%; harrows other than disc ones – by 42.2%; potato diggers – by 31.2% and rototillers – by 22.8%.
Key words: farm machinery, home supply, production
INTRODUCTION
been observed. Results of research carried out in 2009 and 2010 on 53 farms of 8.5 to 150 hectares of agricultural land enable a positive appreciation of the investment activi-ty of owners of these farms [Wójcicki and Kurek 2011, Wójcicki and Rude ska 2013]. In spite of increasing tendency in a case of ability to invest in farm machinery, its level was insufficient to prevent depreciation of fixed assets in the whole agriculture. Im-provement of the situation would be possible on condition that tendency of growing degree of wear of the assets would be stopped. On the other hand, awareness is neces-sary of the considerable differentiation in relation to investment activity with regard to the scale of production. It can be supposed, that started investment processes will bring multiplied effects to a part of farms which will actively use the investment support un-der the CAP instruments and preferential credits. It will intensify the processes of polar-ization in agriculture [Grzelak 2013]. It is known that fragmentation of farms is an im-portant factor of differentiation of farmers’ activity in applying for funds, because it usually implies their weak economic strength and thus limits the possibilities for further development [Poczta and al. 2012].
The analysis based on the results of the implementation of investment programs fi-nanced from EU agricultural funds in Poland showed that in subsequent programs the support for farms’ technological modernisation increased. In each program majority of the funds was spent on farm machinery. Most of the funds went to the central regions of the country, where agricultural structures are relatively good and agriculture is consid-ered as better developed. The investment funds strengthen the competitiveness of these regions [Czubak 2012].
In the farm machinery industry, a system transformation in Poland, started in 1989, caused not only property changes but also significant decreases of the production vol-ume due to decreasing demand from the side of Polish farmers [Waszkiewicz 2009 b]. The home demand decides about a level of production and imports of farm machines [Waszkiewicz 2009 a]. After 2008 production of tractors in Poland dramatically de-creased [Pawlak 2010 b, 2012 a]. As a result, the role of Poland among World and Eu-ropean producers of agricultural tractors decreased [Pawlak 2012 b].
purchased tractors was generally suitable to the needs of farms. Cases of occurring high power tractors in the purchases for farms of acreage below 5 ha AL may be justified by their appropriation for the service purposes [Pawlak 2013 a]. Results of analysis basing on a method taking into account the structure of purchasing brand-new tractors, as de-pended on the farm acreage of purchasers and the power structure of purchased tractors shown that real effects of tractor fleet modernization – as a result of purchasing brand-new tractors within the years 2005-2010 – are almost twenty times higher than those calculated on the basis of mean values, neglecting the structure of purchasers and the tractor power [Pawlak 2013 b].
Fluctuations of situation in agriculture and in national economy as a whole have their effects on farm machinery market. Therefore, the current monitoring concerning this market is necessary. Analyses of demand for farm machines and studies of factors affecting the demand are the base for planning the scale and structure of production in farm machinery industry. Rational adaptation level and assortment of production to the possibility of sale makes it possible to keep production costs on favourable level. Under such conditions the moderate price level of produced machinery is possible. All this helps to achieve competitiveness on market and stimulates the demand [Pawlak 2010 a]. The purpose of this article is an analysis of trends in supply and production of means of agricultural mechanisation during the years 2004-2013.
MATERIAL AND METHODS
Data of the Central Statistical Office [Production... 2003, 2005, 2007, 2009, 2011, 2013, rodki... 2011], concerning production, imports and exports and prices of farm machinery, as well as results of Agricultural Census of 2010 have been used as a base for analyses of situation on the Polish farm machinery market. Home demand for trac-tors and selected farm machines has been estimated as related to home supply, calculat-ed as sum of production and imports and diminishcalculat-ed by exports:
Smr = Pmr + Imr – Exmr (1)
where:
Smr home supply of m-th machine within r-th year (units),
Pmr production in Poland of m-th machine within r-th year (units),
Imr imports of m-th machine within r-th year (units),
Exmr exports of m-th machine within r-th year (units).
Values received in this way cannot be identified with annual sales of particular ma-chines, because the data concerning dealers’ stores stocks at the beginning and end in particular years are not available. Some supplementary knowledge on demand for farm machinery in Poland is provided by the data of the Agricultural Census 2010 [ rodki... 2011].
Ntur Ntsr Rtr
1000 (2)
where:
Rtr index of renovation of tractor fleet in agriculture;
Ntsr supply of tractors within r-th year (units);
Ntur number of tractors in use in r-th year (units).
The method of regression analysis has been used in order to evaluate effects of the index value showing relations between price of the set and gross value added as well as the gross value added itself on tractors’ supply in Polish agriculture. Most accurate trend line has been found by choosing between five different trend or regression types: linear, logarithmic, polynomial, power and exponential. The one with highest R-square value has been selected.
RESULTS AND DISCUSSION
Rise in prices of farm machinery after Poland’s 2004 accession to the EU was com-pensated by implementation of the Common Agricultural Policy in our country. Under The European Agricultural Fund for Rural Development (EAFRD), Poland received EUR 13.2 billion that together with the national funds constitute a total budget in the amount of EUR 17.2 billion for development of food, agriculture and rural areas. This enabled the continuation of the modernisation and development process in Polish agri-culture and rural areas, launched in the previous years. The Agency of Modernisation and Restructuring of Agriculture, being the body that makes payments to farmers in frames of the RDP for 2007-2013 (PROW 2007-2013), designed about EUR 4 billion to support investments in farm machinery. Polish farmers used the funds in 265 thou. pur-chases of tractors and implements which were realised mostly within the measure “Modernisation of agricultural holdings”.
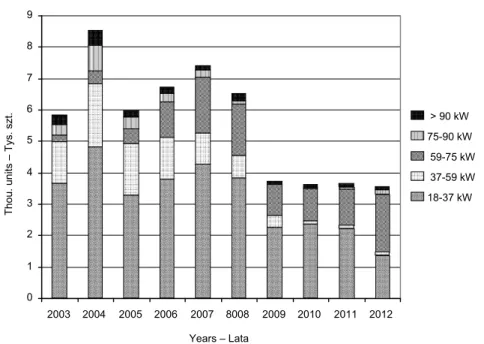
As a result, the demand for tractors and agricultural implements has grown, followed by increasing supply of these means of production. In 2012, the supply of agricultural tractors was by 65.9% higher than in 2003 – last year before the accession. In a case of brand-new tractors the increase was even more marked. It amounted 185.4% (Table 1).
Among the supplied brand-new tractors the share of higher power types increased (Fig. 1).
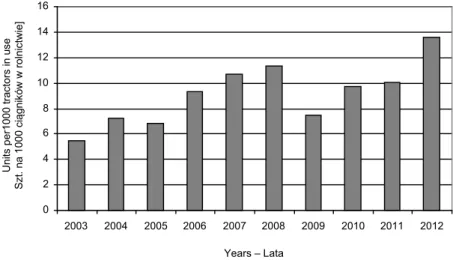
Increase of supply for brand-new agricultural tractors and implements was an im-portant factor enabling technical modernisation of Polish agriculture. The index of ren-ovation of machinery fleet in agriculture can be used as an indicator of the modernisa-tion. Unfortunately, GUS data concerning imports and exports of farm machinery other than tractors do not show division between brand-new and second-hand ones. There-fore, the index of renovation can be calculated only for tractors. Its value within the years 2003-2012 fluctuated, but it was in 2012 by 149.3% higher than in 2003 (Fig. 2).
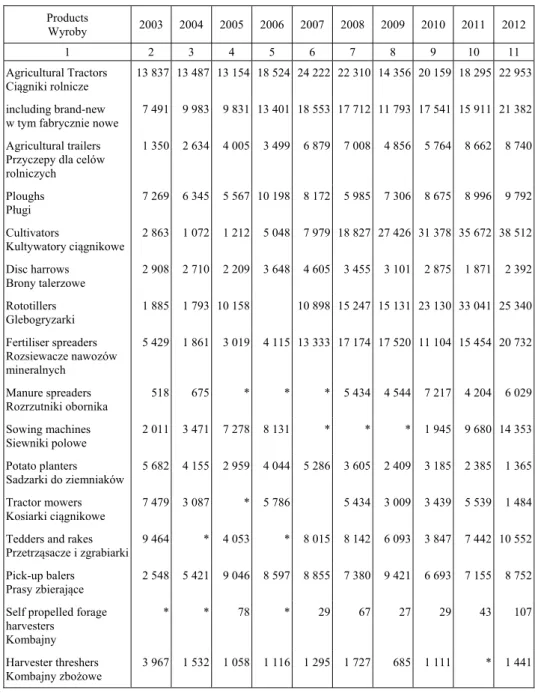
Table 1. Supply of means of agricultural mechanization (units in years) Tabela 1. Poda krajowa rodków mechanizacji rolnictwa (sztuk w latach)
Products
Wyroby 2003 2004 2005 2006 2007 2008 2009 2010 2011 2012
1 2 3 4 5 6 7 8 9 10 11
Agricultural Tractors Ciągniki rolnicze
13 837 13 487 13 154 18 524 24 222 22 310 14 356 20 159 18 295 22 953
including brand-new w tym fabrycznie nowe
7 491 9 983 9 831 13 401 18 553 17 712 11 793 17 541 15 911 21 382
Agricultural trailers Przyczepy dla celów rolniczych
1 350 2 634 4 005 3 499 6 879 7 008 4 856 5 764 8 662 8 740
Ploughs Pługi
7 269 6 345 5 567 10 198 8 172 5 985 7 306 8 675 8 996 9 792
Cultivators
Kultywatory ciągnikowe
2 863 1 072 1 212 5 048 7 979 18 827 27 426 31 378 35 672 38 512
Disc harrows Brony talerzowe
2 908 2 710 2 209 3 648 4 605 3 455 3 101 2 875 1 871 2 392
Rototillers Glebogryzarki
1 885 1 793 10 158 10 898 15 247 15 131 23 130 33 041 25 340
Fertiliser spreaders Rozsiewacze nawozów mineralnych
5 429 1 861 3 019 4 115 13 333 17 174 17 520 11 104 15 454 20 732
Manure spreaders Rozrzutniki obornika
518 675 * * * 5 434 4 544 7 217 4 204 6 029
Sowing machines Siewniki polowe
2 011 3 471 7 278 8 131 * * * 1 945 9 680 14 353
Potato planters Sadzarki do ziemniaków
5 682 4 155 2 959 4 044 5 286 3 605 2 409 3 185 2 385 1 365
Tractor mowers Kosiarki ciągnikowe
7 479 3 087 * 5 786 5 434 3 009 3 439 5 539 1 484
Tedders and rakes Przetrząsacze i zgrabiarki
9 464 * 4 053 * 8 015 8 142 6 093 3 847 7 442 10 552
Pick-up balers Prasy zbierające
2 548 5 421 9 046 8 597 8 855 7 380 9 421 6 693 7 155 8 752
Self propelled forage harvesters
Kombajny
* * 78 * 29 67 27 29 43 107
Harvester threshers Kombajny zbo owe
3 967 1 532 1 058 1 116 1 295 1 727 685 1 111 * 1 441
*data not available.
Source: data of Central Statistical Office [Production... 2004, 2005, 2007, 2009, 2011, 2013]. *brak danych.
Fig. 1. Supply of tractors according to power of engines
Source: own elaboration basing on data of Central Statistical Office [Produc-tion... 2004, 2005, 2007, 2009, 2011, 2013], Pawlak [2010 a], Rynek... [2011, 2013].
Rys. 1. Poda krajowa ciągników według mocy ich silników
ródło: opracowanie własne na podstawie danych GUS [Production... 2004, 2005, 2007, 2009, 2011, 2013], Pawlak [2010 a], Rynek... [2011, 2013].
Fig. 2. Rate of the tractor fleet renovation in agriculture
Source: own elaboration basing on data of Central Statistical Office [Produc-tion... 2004, 2005, 2007, 2009, 2011, 2013], Rynek... [2011, 2013].
Rys. 2. Stopa odnawiania parku ciągnikowego w Polsce
ródło: opracowanie własne na podstawie danych GUS [Production... 2004, 2005, 2007, 2009, 2011, 2013], Rynek... [2011, 2013].
0 2 4 6 8 10 12 14 16
2003 2004 2005 2006 2007 2008 2009 2010 2011 2012
Years – Lata
Uni
ts per10
00
tra
c
tors in u
s
e
Szt. na
1000
ci
ą
gn
ik
ów
w
r
o
ln
ic
tw
ie
]
0 5 10 15 20 25
2003 2004 2005 2006 2007 8008 2009 2010 2011 2012
Years – Lata
Thou. u
nits
– T
y
s.
szt. > 90 kW
increased almost 12 times. Increases in number of units supplied were observed also in cases of sowing machines – by 613.7%; self loading or unloading agricultural tractor trailers – by 547.4%, fertilizer spreader – by 281.9%, pick-up balers – by 243.5%, ploughs – by 34.7% as well as tedders and rakes – by 11.5%. Instead, the supply of tractor mowers decreased by 80.2%, potato planters – by 76.0%, harvester threshers – by 63.7% and disc harrows by 17.7% (Table 1).
In case of harvester threshers, the decrease was due to reduction of the share of sec-ond-hands, dominating in 2003. The reason of decreasing supply in case of potato planters was successively smaller area of potatoes planted in Poland.
Changes of demand for tractors and farm implements had different effect on produc-tion level of particular types of machinery. In cases of agricultural trailers, harvester threshers and some other machines the effect was positive. Instead, in spite of signifi-cant increase of demand for tractors, their production in 2012 was by 39.2% lower than in 2003 (Table 2). Dramatic drop in the number of tractors produced in Poland occurred already at the beginning of the 90’s of 20th century and it was due to worsening of eco-nomic situation in agriculture, followed by decrease of demand. Facing lack of financial sources for purchases of brand-new equipment, farmers bought imported second-hands, and at the beginning – also from state and cooperative farms. At the same time failure in restructuring of Ursus and errors in its management caused successful loss of competi-tiveness on the market. The home competition appeared in a form of fitting-shops using parts of foreign makes tractors. After Poland’s accession to the EU assembling of trac-tors using parts coming from the Union countries has become purposeless because of elimination of duty barriers. At present buyers of brand-new equipment are prosperous farms of high scale of production and considerable requirements towards a quality. This fact and progressive saturation of agriculture, at least on quantitative score, together with decreasing competitiveness of home tractor industry cause, that the demand grow-ing after the accession has been satisfied by purchases of imported tractors, in many cases of high quality standards.
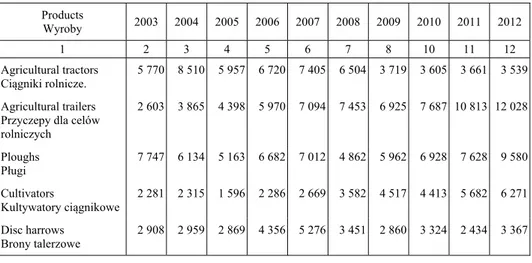
Table 2. Production of means of agricultural mechanization (units in years) Tabela 2. Produkcja rodków mechanizacji rolnictwa (sztuk w latach)
Products
Wyroby 2003 2004 2005 2006 2007 2008 2009 2010 2011 2012
1 2 3 4 5 6 7 8 10 11 12
Agricultural tractors Ciągniki rolnicze.
5 770 8 510 5 957 6 720 7 405 6 504 3 719 3 605 3 661 3 539
Agricultural trailers Przyczepy dla celów rolniczych
2 603 3 865 4 398 5 970 7 094 7 453 6 925 7 687 10 813 12 028
Ploughs Pługi
7 747 6 134 5 163 6 682 7 012 4 862 5 962 6 928 7 628 9 580
Cultivators
Kultywatory ciągnikowe
2 281 2 315 1 596 2 286 2 669 3 582 4 517 4 413 5 682 6 271
Disc harrows Brony talerzowe
Table 2 – cont. / Tabela 2 – cd.
1 2 3 4 5 6 7 8 10 11 12
Other harrows Brony pozostałe
3 818 2 427 3 330 4 915 5 785 6 767 3 637 3 331 2 698 2 206
Rototillers Glebogryzarki
1 885 1 793 2 493 2 825 1 637 1 228 815 930 1 604 1 456
Fertiliser spreaders Rozsiewacze nawozów mineralnych
2 582 3 293 3 121 4 115 5 486 5 815 2 841 2 911 3 332 11 236
Manure spreaders Rozrzutniki obornika
671 555 * * * 5484 4519 4835 3 893 5 397
Sowing machines Siewniki polowe
1 795 2 315 1 973 2 883 2 695 3 804 4 947 4 658 4 316 6 199
Potarto planters Sadzarki do ziemniaków
6 148 4 880 3 561 5 118 6 095 4 442 3 586 4 391 3 695 3 094
Tractor field sprayers Opryskiwacze polowe, ciągnikowe
10 505 10 002 8 605 11 512 12 209 10 657 8 535 9 654 11 625 11 729
Tractor mowers Kosiarki ciągnikowe
5 429 5 068 5 500 5 786 5 859 4 992 5 516 4 314 8 613 10 004
Tedders and rakes Przetrzasacze i zgrabiarki
9 674 6 280 10 577 9 985 7 492 5 424 8 249 12 673
Pick-up balers Prasy zbierające
3 417 4 247 7 774 8 730 8 686 8 095 8 605 8 100 9 433 11 005
including round balers w tym prasy zwijające
3 058 4 162 6 543 8 321 8 214 7 494 6 697 6 167 7 702 8 899
Harvester threshers Kombajny zbo owe
610 821 1 197 1 215 997 1 498 786 1 230 1615 1798
Potato diggers
Kopaczki do ziemniaków
715 839 496 514 879 1 063 792 500 677 492
Potato harvesters Kombajny ziemniaczane
60 78 48 55 92 109 47 61 110 66
Steamers for solid fuels Parniki na paliwo stałe
29 345 19 245 13 089 12 575 12 760 11 570 9 475 7 132 6 348 7 832
Dryers for agricultural products
Suszarnie rolnicze
166 320 319 719 280 446 248 207 536 368
*data not available.
Source: data of Central Statistical Office [Production... 2004, 2005, 2007, 2009, 2011, 2013]. *brak danych.
ródło: dane Głównego Urzędu Statystycznego [Production... 2004, 2005, 2007, 2009, 2011, 2013].
Fig. 3. Production of tractors according the power of engines
Source: own elaboration basing on data of Central Statistical Office [Produc-tion... 2004, 2005, 2007, 2009, 2011, 2013], Rynek... [2011, 2013].
Rys. 3. Produkcja ciągników według mocy silnika
ródło: opracowanie własne na podstawie danych GUS [Production... 2004, 2005, 2007, 2009, 2011, 2013], Rynek... [2011, 2013].
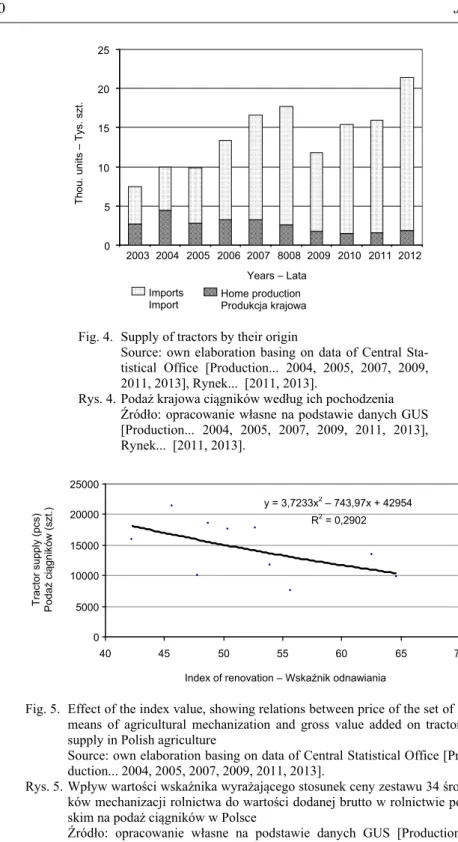
Fall in the number of tractors produced in Poland caused that imported tractors achieved more and more important share in supplies on Polish market. In 2003 the share of imports amounted to 64.0% and in 2012 – 91.4% (Fig. 4).
However, the production of majority of means of agricultural mechanisation in-creased after Poland's accession to the EU (Table 2). The production of manure spread-ers was in 2012 higher by 704.3% than in 2002, self loading or unloading agricultural tractor trailers – by 362.1%, fertilizer spreader – by 335.2%, field sowing machines – by 245.3%, pick-up balers – by 222.1% (of that round balers – 191,0%), harvester thresh-ers – by 194.8%, tractor cultivators – by 174.9%, drythresh-ers for agricultural products – by 121.7%, tractor mowers – by 84.3%, tedders and rakes – by 31.0%, ploughs – by 23.7%, disc harrows – by 15.8 and tractor field sprayers – by 11.7%. Decreases were toted in cases of steamers – by 73.3%, potato planters – by 49.7%, harrows other than disc ones – by 42.2%, potato diggers – by 31.2% and rototillers – by 22.8%.
Weak but positive correlation has been found between the index values, showing re-lations between price of the set of 34 means of agricultural mechanisation and gross value added on tractors’ supply in Polish agriculture (Fig. 5). It seems that possibility to use support funds, available for Polish farmers in frames of CAP cause, that increase of machinery prices, even as related to value of agricultural production did not hamper the investments in brand-new tractors. Thanks to the support farm machinery became less expensive for farmers having investment ability.
0 1 2 3 4 5 6 7 8 9
2003 2004 2005 2006 2007 8008 2009 2010 2011 2012
Years – Lata
Thou. u
nits
– T
y
s.
szt. > 90 kW
75-90 kW
59-75 kW
37-59 kW
Fig. 4. Supply of tractors by their origin
Source: own elaboration basing on data of Central Sta-tistical Office [Production... 2004, 2005, 2007, 2009, 2011, 2013], Rynek... [2011, 2013].
Rys. 4. Poda krajowa ciągników według ich pochodzenia ródło: opracowanie własne na podstawie danych GUS [Production... 2004, 2005, 2007, 2009, 2011, 2013], Rynek... [2011, 2013].
Fig. 5. Effect of the index value, showing relations between price of the set of 34 means of agricultural mechanization and gross value added on tractors’ supply in Polish agriculture
Source: own elaboration basing on data of Central Statistical Office [Pro-duction... 2004, 2005, 2007, 2009, 2011, 2013].
Rys. 5. Wpływ warto ci wska nika wyra ającego stosunek ceny zestawu 34 rod-ków mechanizacji rolnictwa do warto ci dodanej brutto w rolnictwie pol-skim na poda ciągników w Polsce
ródło: opracowanie własne na podstawie danych GUS [Production... 2004, 2005, 2007, 2009, 2011, 2013].
y = 3,7233x2
– 743,97x + 42954
R2 = 0,2902
0 5000 10000 15000 20000 25000
40 45 50 55 60 65 70
Index of renovation – Wskaźnik odnawiania
Tracto
r suppl
y (pcs)
Poda
ż
ci
ą
gni
kó
w (
s
zt
.)
0 5 10 15 20 25
2003 2004 2005 2006 2007 8008 2009 2010 2011 2012
Years – Lata
Thou. u
nits
– T
y
s.
szt.
Imports Import
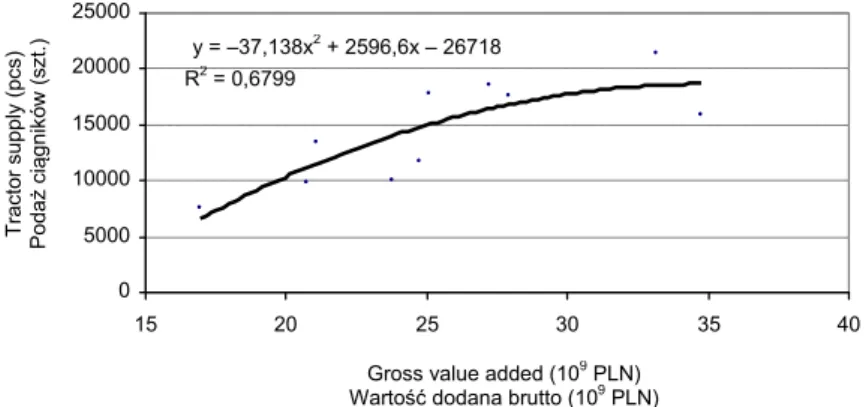
Stronger correlation was observed between the levels of gross value added achieved in Polish agriculture and the demand for agricultural tractors (Fig. 6). Supply of tractors increases along with growing agricultural production.
Fig. 6. Effect of the gross value added in Polish agriculture on tractors’ supply Source: own elaboration basing on data of Central Statistical Office [Production... 2004, 2005, 2007, 2009, 2011, 2013].
Rys. 6. Wartoć dodana brutto w rolnictwie a poda ciągników
ródło: opracowanie własne na podstawie danych GUS [Production... 2004, 2005, 2007, 2009, 2011, 2013].
These shows that not only funds available thanks to CAP stimulate the investments in farm machinery. Also the level of agricultural production, which determines availa-bility of necessary financial sources for farmers own share in purchases, is still very important. The investment ability depends then on the value of agricultural production.
CONCLUSION
After accession of Poland to the EU the demand for tractors and agricultural imple-ments grew, followed by increasing supply of these means of production. In 2012, the supply of brand-new agricultural tractors was by 185.4% higher than in 2003 – last year before the accession. Also in cases of majority of other means of mechanization, the increases of supply were noted.
Within the years 2003-2012 the value of renovation index of tractor fleet in agricul-ture fluctuated but it was in 2012 by 149.3% higher than in 2003.
Changes in the demand for tractors and farm implements had different effect on production level of particular types of machinery. In spite of a significant increase of demand for tractors, their production in 2012 was by 39.2% lower than in 2003. Produc-tion of majority of other means of agricultural mechanisaProduc-tion was in 2012 higher than in 2003.
The downfall in the number of tractors produced in Poland caused that imported tractors achieved more and more important share in supplies on Polish market. In 2003 the share of imports amounted to 64.0% and in 2012 – 91.4%.
y = –37,138x2
+ 2596,6x – 26718
R2 = 0,6799
0 5000 10000 15000 20000 25000
15 20 25 30 35 40
Gross value added (109
PLN)
Wartoć dodana brutto (109
PLN)
Tracto
r suppl
y (pcs)
Poda
ż
ci
ą
gni
kó
w (
s
zt
Positive correlation has been found between level of agricultural production and supply of brand-new tractors. The level of agricultural production determines availabil-ity of necessary financial sources for farmers own share in purchases and their invest-ment ability.
REFERENCES
Czubak W., 2012. Wykorzystanie funduszy Unii Europejskiej wspierających inwestycje w go-spodarstwach rolnych. J. Agribus. Rural Dev. 3(25), 57-67.
Grzelak A., 2013. Ocena procesów inwestycyjnych w rolnictwie w Polsce w latach 2000-2011. J. Agribus. Rural Dev. 2(28) 2013, 111-120.
Pawlak J., 2010 a. Popyt na maszyny rolnicze w Polsce w latach 2000-2008. Probl. In . Roln. (67), 37-44.
Pawlak J., 2010 b. Produkcja i ceny maszyn rolniczych w Polsce po wej ciu do UE. Probl. In . Roln. 1(67), 45-53.
Pawlak J., 2012 a. Rynek ciągników rolniczych w Polsce w latach 2000-2010. Probl. In . Roln. 1(75), 5-14.
Pawlak J., 2012 b. wiatowy rynek ciągników rolniczych. Probl. In . Roln. 2(76), 5-16.
Pawlak J., 2012 c. Zakupy ciągników rolniczych w Polsce w ujęciu regionalnym. Probl. In . Roln. 3(77), 35-44.
Pawlak J., 2013 a. Modernizacja parku ciągnikowego w Polsce w wietle wyników powszechne-go spisu rolnepowszechne-go z 2010 r. Probl. In . Roln. 3(81), 17-27.
Pawlak J., 2013 b. Próba oceny skutków modernizacji parku ciągnikowego w Polsce. Probl. In . Roln. 3(81), 5-16.
Poczta W., Siemi ski P., Sierszchulski J., 2012. Przestrzenne zró nicowanie aktywno ci rolników w pozyskiwaniu rodków unijnych na rozwój gospodarstw rolnych w Wielkopolsce na przy-kładzie działania „modernizacja gospodarstw rolnych”. J. Agribus. Rural Dev. 3(25) 2012, 207-223.
Production of industrial products in 2003. 2004. Central Statistical Office, Warsaw, http://www. stat.gov.pl/gus/5840_1076_PLK_HTML.htm [access: 07.2014].
Production of industrial products in 2004. 2005. Central Statistical Office, Warsaw, http://www. stat.gov.pl/gus/5840_1076_PLK_HTML.htm [access: 07.2014].
Production of industrial products in 2006. 2007. Central Statistical Office, Warsaw, http://www. stat.gov.pl/gus/5840_1076_PLK_HTML.htm [access: 07.2014].
Production of industrial products in 2008. 2009. Central Statistical Office, Warsaw, http://www. stat.gov.pl/gus/5840_1076_PLK_HTML.htm [access: 07.2014].
Production of industrial products in 2010. 2011. Central Statistical Office, Warsaw, http://www. stat.gov.pl/gus/5840_792_PLK_HTML.htm [access: 07.2014].
Production of industrial products in 2012. 2013. Central Statistical Office, Warsaw, http://stat. gov.pl/obszary-tematyczne/przemysl-budownictwo-srodki-trwale/przemysl/produkcja-wyro-bow-przemyslowych-w-2012-r-,3,10.html#.
Rynek rodków produkcji dla rolnictwa. Stan i perspektywy. 2011. Eds L. Mieszkowska, T. Olesiak, J. Pawlak, A. Zalewski, Ar. Zalewski. IERiG -PIB, ARR, MRiRW, Warszawa.
Rynek rodków produkcji dla rolnictwa. Stan i perspektywy. 2014. Eds T. Chro cicki, L. Miesz-kowska, T. Olesiak, J. Pawlak, A. Zalewski, Ar. Zalewski. IERiG -PIB, ARR, MRiRW, Warszawa.
rodki produkcji w rolnictwie. Powszechny Spis Rolny 2010. 2011. GUS, Warszawa.
Waszkiewicz Cz., 2009 b. Rynek wybranych narzędzi i maszyn rolniczych do produkcji ro linnej w Polsce w latach 2001-2007. Probl. In . Roln. 1(63), 51-56.
Wójcicki Z., Kurek J., 2011. Nakłady inwestycyjne w rozwojowych gospodarstwach rodzinnych. Probl. In . Roln. 4(74), 5-11.
Wójcicki Z., Rude ska B., 2013. Działalno ć inwestycyjna w badanych gospodarstwach rodzin-nych. Probl. In . Roln. 3(81), 5-16.
POLSKI RYNEK MASZYN ROLNICZYCH PO WEJ CIU DO UNII EUROPEJSKIEJ – PRODUKCJA I PODA RODKÓW MECHANIZACJI ROLNICTWA
Streszczenie. Po wej ciu Polski do Unii Europejskiej zwiększył się popyt na rodki me-chanizacji rolnictwa oraz poda krajowa większo ci z nich. W 2012 roku dostawy cią gni-ków fabrycznie nowych były o 185,4% wy sze ni 2003 roku. Wartoć wska nika odna-wiania parku ciągnikowego była w 2012 roku o 149,3% większa ni w 2003 roku. Mimo znacznego zwiększenia popytu na ciągniki ich produkcja w 2012 roku była o 39,2% mniejsza ni w 2003 roku. Spadek produkcji ciągników w Polsce spowodował sukcesyw-ne zwiększanie udziału importu. W 2003 roku udział ciągników importowanych wyniósł 64,0%, a w 2012 roku – 91,4%. Produkcja większo ci pozostałych rodków mechanizacji rolnictwa była w 2012 roku większa ni w 2003 roku. Wzrost ten w przypadku roztrzą sa-czy obornika wyniósł 704,3%, ciągnikowych przyczep rolniczych samozaładowczych lub samowyładowczych – 362,1%, rozsiewaczy nawozów mineralnych – 335,2%, cią gniko-wych siewników pologniko-wych – 245,3%, pras zbierających – 222,1%, a kombajnów zbo o-wych – 194,8. Spadła produkcja parników – o 73,3%, sadzarek ziemniaków – o 49,7%, bron innych ni talerzowe – o 42,2%, kopaczek do ziemniaków – o 31,2%, a glebogryza-rek – o 22,8%.
Słowa kluczowe: sprzęt rolniczy, poda krajowa, produkcja
Accepted for print – Zaakceptowano do druku: 19.09.2014