COMPETITIVENESS OF THE POLISH ECONOMY COMPARED WITH
THE ROMANIAN ONE
Wioletta WEREDA Ph.D. Lecturer1, Alina HAGIU University Assistant Ph.D. Candidate2 1
University of Poldasie 2
University of Pitesti [email protected]
Abstract: Generally, competitiveness of the economy defines importance of the national economy in the world market. It is a very complex notion assessed by various institutions using different indicators which actually reflect only selected aspects, such as prospects for economic development, technological progress, quality of public institutions, quality of the national business environment, quality of business legislation, level of prices as well as technical infrastructure.
Key words: competitiveness, performance, development, ranking.
JEL codes: E00; G18; O5
INTRODUCTION
The economic theory emphasizes two assessment sizes of the competitiveness’s level such as: the microeconomic one and the macroeconomic one. At microeconomic level, competitiveness, on one hand, is an attribute of some individuals professionally trained and motivated to perform economic activities (individually or in teams or groups) efficiently on the base of some performances a bound to inventiveness, adaptability, resistance, team work). On the other hand, microeconomic competitiveness of an organization (enterprises, holdings, groups, Non-Government Organizations etc) reflects its capacity to offer products to the market and/or services at the best ratio price-quality-environment impact, in relation to intern or international competition.
The main features of competitiveness at microeconomic level are: innovation, research-development, eco-management, quality, and citizen’s safety, all of them having effect in the product’s or service price.
At macroeconomic level competitiveness is an attribute of some places, regions, countries or groups potential to offer to the market qualitative products/services that include the application of the newest or the most efficient technologies available to the most advantageous prices, with a minimum impact on the environment, to cope with the competition of the similar products and services from other geographical regions.
As a result of the membership to the European Union, the Polish and the Romanian cooperative environment, as well as the one of the other member states, suffered structural transformations and only those companies capable to identify potential risks and to realize necessary modifications will be able to face the unique European market conditions and will benefit of the opportunities brought by them.
POLAND’S AND ROMANIA’S INTERNATIONAL COMPETITIVENESS RANKINGS
In the light of international competitiveness comparisons and rankings, both Polish and Romanian economy is ranked rather low. According to the majority of rankings Poland and Romania have one of the lowest ranks among the EU Member States. However, it should be stressed that the rankings reflect the situation from 1-2 years preceding their publication.
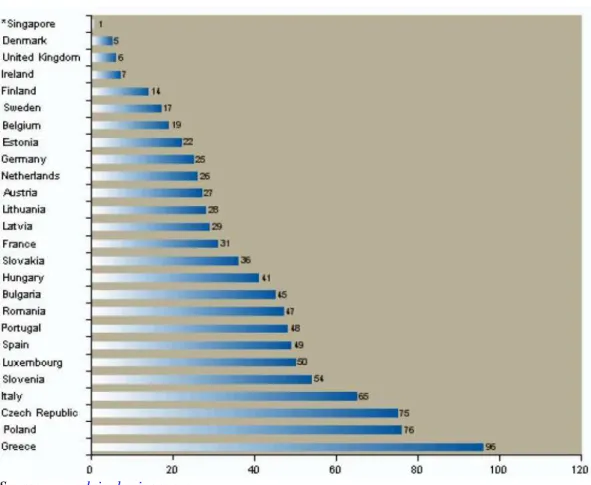
Figure no. 1 European Union - Aggregate rankings
Source: www.doingbusiness.org
The most important rankings and reports showing the competitive position of the Polish and Romanian economy compared to the other countries are presented below.
According to a synthetic evaluation of the ease of doing business, in 2008, Poland ranked 76 out of 181 countries assessed, which means a drop by 6 places, while Romania ranked 47, which means that it went up with 24 places since 2006.
Table no.1 Ease of…
Ease of... (2008) Poland Romania
Doing Business 76 47
Starting a Business 145 26
Dealing with Construction Permits 158 88
Employing Workers 82 143
Registering Property 84 114
Getting Credit 28 12
Protecting Investors 38 38
Paying Taxes 142 146
Trading Across Borders 41 40
Enforcing Contracts 68 31
Closing a Business 82 85
Source: www.doingbusiness.org
As in the previous years, access to licenses and concessions in Poland was rated exceptionally low. According to report's authors these procedures are very time-consuming (322 days), formalized (30 formalities were counted) and costly (159.8% of GDP per capita). In consequence Poland occupies a rather shameful position, i.e. 156 (drop by 2 places). Among the EU States Denmark perfumed the best (6th place), and Estonia is the frontrunner (14) among the EU-12.
In 2008 Romania registered an increase in "Efficiency in Business", going up from the 50 place in 2007, to 47 in 2008, ranking better than countries such as Bulgaria, Russia, Poland and Croatia. Regarding the "economic performance" we have maintained constant occupying the place 35, being before countries such Finland, Bulgaria, Hungary, Croatia, Portugal, Italy, Greece, Russia, Ukraine, and Turkey.
Figure no. 2 Starting a business
Starting a Business (2008)
6 10 10 3,6 1,1
31
18,8
168,8
0 20 40 60 80 100 120 140 160 180
Procedures (number) Duration (days) Cost (% GDP per capita)
Paid in Min. Capital (% of GDP per
capita)
Romania Poland
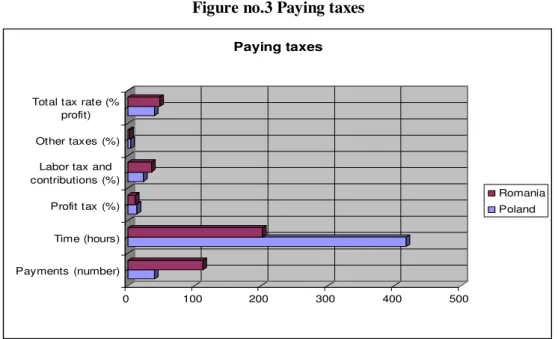
Poland ranked equally low as regards tax paying easiness. In sub-ranking Poland was ranked 125 and dropped by 5 places. According to the estimates of the report's authors, an entrepreneur, who would like to meet all Polish tax requirements, should have to make 41 payments absorbing cumulatively 38.4% of gross profit and should spend 418 hours annually for this purpose. The highest rank among the Central-East European countries is that of Latvia (20). It is worth noting that the Slovak Republic (122) had poor assessment in this respect because of, among other things, the high total tax (50.5% of gross profit), according to the report's authors.
Romania applies 17 taxes to the case study company, seven of which are labor taxes. The number of labor tax payments in the year is 84 out of a total of 113 tax payments. Labor taxes make up 74 percent of the TTR, account for 74 percent of the tax payments and 54 percent of the hours to comply in Romania. The 17 taxes that give rise to the total number of tax payments of 113 comprise corporate income and capital gains tax, two property taxes, seven labor taxes, and six other taxes ranging from environmental taxes to vehicle tax.
Table no.2 Paying Taxes
Economy Payments (number)
Time (hours)
Profit tax (%)
Labor tax and contributions
(%)
Other taxes (%)
Total tax rate (%
profit)
Poland 40 418 13,0 23,5 3,7 40,2
Romania 113 202 10,4 35,5 2,1 48,0
Source: www.doingbusiness.org
Figure no.3 Paying taxes
0 100 200 300 400 500
Payments (number) Time (hours) Profit tax (%) Labor tax and contributions (%)
Other taxes (%) Total tax rate (%
profit)
Paying taxes
Romania Poland
Source: made by the author based on the dates from www.doingbusiness.org
The ranking authors pointed out at the improvement in field of the enforcement of contracts in Poland.
to 830 days. Consequently Poland moved up by 6 places and currently is ranked 68. In this respect Latvia was ranked highest (3 place) among countries of the region.
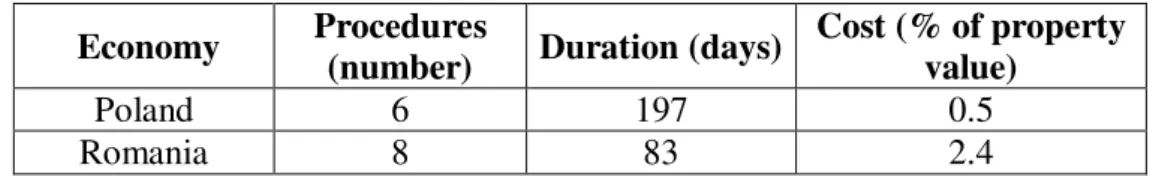
In terms of the easiness of real property registration Poland was classified 81, which means an improvement by 5 places. The main underlying reason is the time-consuming registration process (197 days), although a significant drop in registration costs - from 1.6 to 0.5% of real property value - was noted. In Lithuania, which scored the highest rank among the EU-27 Member States (4), all relevant procedures take 3 days to complete. Romania ranks better on – duration (3 days) but is far off in what concerns the number of procedures (8) and the cost of real property value (2.4).
Table no.3 Registering Property
Economy Procedures
(number) Duration (days)
Cost (% of property value)
Poland 6 197 0.5
Romania 8 83 2.4
Source: www.doingbusiness.org
Different studies show that the presence of legal and regulatory protections for investors explains up to 73% of the decision to invest. In contrast, company characteristics explain only between 4% and 22%*. Good protections for minority shareholders are associated with larger and more active stock markets. Thus both governments and businesses have an interest in reforms strengthening investor protections.
It is worth stressing that Poland and Romania ranks equal (38), in the area of corporate governance ("protecting investors' category).
Table no.4 Protecting Investors
Economy Disclosure Index
Director Liability Index
Shareholder Suits Index
Investor Protection Index
Poland 7 2 9 6.0
Romania 9 5 4 6.0
Source: www.doingbusiness.org
In the other categories Poland took the following ranks: credit availability (68), employment of workers (78), business liquidation (88), while Romania, at the same categories, ranks (12), (143), (85).
Firms consistently rate access to credit as among the greatest barriers to their operation and growth. In realizing this ranking, we took into consideration two sets of indicators of how well credit markets function: one on credit registries and the other on legal rights of borrowers and lenders.
Table no.5 Getting Credit
Economy Legal Rights Index
Credit Information
Index
Public registry coverage (%
adults)
Private bureau coverage (%
adults)
Poland 8 4 0.0 50.0
Romania 8 5 4.5 24.7
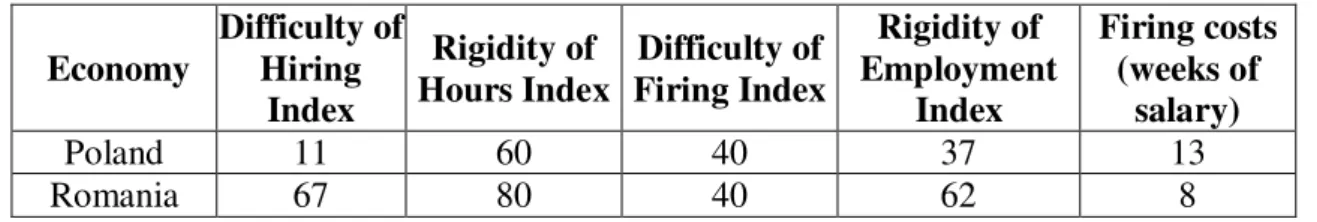
The difficulties of the hiring companies from Romania concerning the hiring procedures or firing procedure, are expressed by the indices presented below, for the year 2008 (each of them takes values from 0 to 100), and the higher values require an illiberal settlement; the index of the company’s rigidity is constituted as an arithmetical rate of the previous three indices.
Economies worldwide have established a system of laws and institutions intended to protect workers and guarantee a minimum standard of living for its population. This system generally encompasses four bodies of law: employment, industrial relations, social security and occupational health and safety laws.
Table no.6 Employing Workers
Economy
Difficulty of Hiring
Index
Rigidity of Hours Index
Difficulty of Firing Index
Rigidity of Employment
Index
Firing costs (weeks of
salary)
Poland 11 60 40 37 13
Romania 67 80 40 62 8
Source: www.doingbusiness.org
The economic crises of the 1990s in emerging markets raised concerns about the design of bankruptcy systems and the ability of such systems to help reorganize viable companies and close down unviable ones. In countries where bankruptcy is inefficient, unviable businesses linger for years, keeping assets and human capital from being reallocated to more productive uses.
In countries where bankruptcy laws are inefficient, this is a strong deterrent to investment. Access to credit shrinks, and nonperforming loans and financial risk grow because creditors cannot recover overdue loans. Conversely, efficient bankruptcy laws can encourage entrepreneurs. The freedom to fail, and to do so through an efficient process, puts people and capital to their most effective use. The result is more productive businesses and more jobs.
Table no.7 Closing a Business
Economy Time
(years)
Cost (% of estate)
Recovery rate (cents on the dollar)
Poland 3.0 20 29.8
Romania 3.3 9 29.5
Source: www.doingbusiness.org
To recapitulate, Poland was not included into the group of reformer states and with its summative rank for ease of doing business Poland comes only before Greece, out of the EU-27 Member States. Regarding Romania, it occupies a better place than Poland, 17, among the European Union member stares.
POLAND COMPARED TO EU MEMBER STATES
Good economic performance in last few years has been reflected in the macroeconomic and labor market indicators improvement. However, a number of indicators illustrating the structural changes differ in minus from the EU average.
Table no.8 Structural indicators of the EU - Poland compared to the EU
Indicator value*
Year Poland EU-27 EU-25 EU-15 Overall economic situation
1. GDP per capita according to the PPS 2006 52.4 100.0 103.9 112.1 2007 53.6 100.0 103.8 111.6 2. Labor productivity per 1 worker 2006 66.3 100.0 103.8 110.4 2007 65.8 m 100.0 103.8 110.2 Employment
3. Employment rate 2006 54.5 64.5 64.8 66.2
2007 57.0 65.4 65.8 66.9
4. Employment rate of older persons 2006 28.ian 43.5 43.7 45.3 2007 29.iul 44.7 44.9 46.6 Innovation and research
5. Youth educational attainment 2006 91.7 77.9 77.9 75.0
2007 91.6 78.1 78.0 75.2
2005 0.57 1.84 (s) no data 1.90 (s) 6. Domestic expenditure on R&D 2006 0.56 1.84 (s) no data 1.91 (s)
Economic reforms
7. Comparative price levels 2006 62.1 100.0 101.1 104.9
2007 63.4 100.0 101.0 104.7 2006 15.9 17.8 17.8 17.8
8. Business investment 2007 18.2 18.3 18.2 18.2
Social Cohesion
9. At risk-of-poverty rate 2005 21 no data 16 16
2006 19 no data 16 16
10. Long-term unemployment rate 2006 7.8 3.7 03.iul 03.feb
2007 4.9 3.0 3.0 02.aug
9. Dispersion of regional employment rates 2005 5.6 11.9 no data no data 2006 5.1 11.4 no data no data Environment
12. Green house gas emissions 2004 67.6 92.8 no data 98.8 2005 68.0 92.1 no data 98.0 target 94.0 no data no data 92.0 13. Energy intensiveness of economy 2004 596.35 211.07 204.89 187.65
2005 584.70 208.05 no data 184.85 14. Volume of freight transport relative to
GDP
2005 89.0 105.4 104.6 104.6 a
EUROPEAN UNION’S PROGRESS IN THE REFORM AREA IN 2008
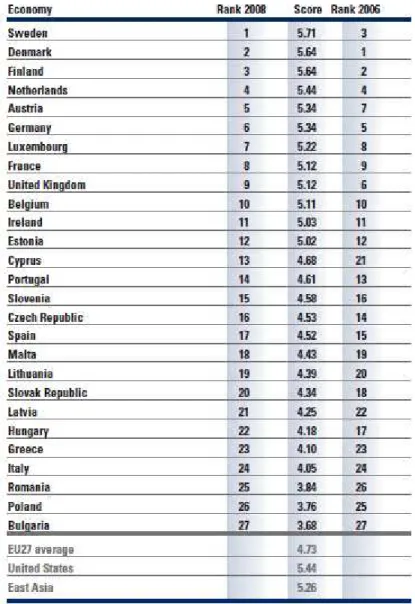
Table 9 shows this year’s rankings and scores of the 27 EU member countries, as well as their 2006 rankings for comparison. The scores are on a scale from one to seven, with larger values indicating stronger performance.
The table shows that the Nordic members continue to hold the top three spots, with Sweden overtaking Denmark and Finland, to be ranked first this year. The countries constituting the ranking’s top 10 also remain the same, although there has been some movement within the ranks. Austria, Luxembourg and France have moved up slightly in the rankings, to 5th, 7th and 8th places respectively.
On the other hand, Germany and the United Kingdom have declined in the rankings to 6th and 9th respectively. The drop of three places by the United Kingdom is particularly notable and mainly due to a worsening assessment of the state of the country’s financial services, as discussed below.
Among the original EU15 members that are ranked outside the top 10, the only changes in rank since the 2006 assessment, are slight declines experienced by Portugal and Spain, to 14th and 17th places, respectively, echoing the present economic downturn in the Iberian Peninsula, particularly in Spain. Nevertheless, and despite the current crisis, Ireland, Spain and Portugal continue to do comparatively well, placing in the top half of European countries, while Greece and Italy continue to round out the bottom of the rankings, grouped together with the least competitive accession countries.
The accession countries register more notable changes in performance. Most striking is Cyprus (13th), which moves up by eight places, due to improvements registered across all areas, especially efforts to develop an information society, improve social inclusion and sustainable development. Five other accession countries improve by one rank, namely Slovenia (15th), Malta (18th), Lithuania (19th), Latvia (21st) and Romania (25th), demonstrating that they are moving in the right direction in some areas, albeit some from a rather low base. On the other hand, the largest decline in rank out of all 27 countries is registered by Hungary, falling five places to 22nd place, linked in particular to poorer assessments of the country’s financial services and efforts towards increased social inclusion. In addition, both the Czech Republic (16th) and the Slovak Republic (20th) decline by two ranks, while the largest of the accession countries, Poland, falls one more rank, displaced by Romania, and is now second to last at 26th place, only ahead of Bulgaria. At the other end of the spectrum is Estonia, which continues to be the highest-placed accession country, just outside the top 10 and right behind Ireland at 12th.The varied performance of the accession countries shows that their reform efforts are meeting with mixed success.
Table 9: Rankings and Scores of EU Countries – 2008 and 2006
Source: World Economic Forum
CONCLUSIONS
According to the majority of international rankings the competitiveness of Polish economy does not perform particularly well, no matter what criteria and indicators are adopted. The weaknesses of the Polish economy primarily include ineffective public expenditure, low labor market flexibility, low quality of public institutions, ineffective judiciary with respect to economic matters, unfavorable conditions for starting up business as well as poorly developed infrastructure. Low position of Poland, which is worse than the actual condition of Polish businesses and the dynamic development of foreign investments in Poland, is also a result of certain competitiveness rankings that are several years old.
The strengths of the Polish economy include favorable macroeconomic results: high economic growth, a low level of inflation, low labor costs in industry, dynamic development of export and the country’s attractiveness to foreign investors. The reports pointed out that Poland had a high innovation potential because of the well-educated workforce.
concerning the creation of a firm. One of the problems refers to the existence of a job market with a rigidity high level of occupancy, relative for the countries from European Union.
Providing the flexibility of the job market represents the main condition of the adaptation of an economy to the global impacts that can affect it; moreover, it represents a way of economy regulation in the conditions of renunciation to the possibility of using the instrument of the change course, as a result of the extern shocks will be felt for a longer period of time, and the correlation of the business cycles will be lower. In such situation, rate of unemployment will increase and the common currency politics will generate lop-sided impacts, which will emphasize the initial evolution.
REFERENCES
1. Adamkiewicz, H.G., –“Uwarunkowania konkurencyjno ci przedsi biorstw w gospodarce rynkowej”, Wy sza Szkoła Morska w Gdyni, Gdynia, 1999.
2. Andreu, R., Baiget, J., Canals A. – “Firm-specific knowledge and competitive advantage: evidence and KM practices”, Knowledge and Process Management Volume 15, Issue 2, 2008.
3. Bowen H. P., Moesen W. – „Benchmarking the Competitiveness of Nations: Nonuniform Weighting and Non-economic Dimensions”, Vlerick Leuven Gent Management School, Vlerick Leuven Gent Working Paper Series, no. 2, 2005
4. Krugman, P. - “Competitiveness: A dangerous obsession”, Foreign Affairs, 2004.
5. Lubi ski, M., Michalski, S., Misala, J. – “Mi dzynarodowa konkurencyjno gospodarki. Poj cie i sposób mierzenia”, Instytut Rozwoju i Studiów Strategicznych, Warszawa, 2008.
6. Marzenna R., Weresa A. – “Polska Raport O Konkurencyjno ci 2008 konkurencyjno sektora usług”, 2008.
7. Matusiak, K.B. – “Dylematy strategii technologicznej i poprawy innowacyjno ci gospodarki polskiej”, Studia Prawno-Ekonomiczne, t. LX, 1999.
8. Pangsy-Kania, S. – “Innowacyjno polskiej gospodarki na tle procesów globalizacyjnych w gospodarce wiatowej”, 2008.
9. Porter, M. E., Ketels, C., Delgado M. – “The Microeconomic Foundations of Prosperity: Findings from the Business Competitiveness Index”, 2007.
10. *** - Government of Romania, – „National Strategic Reference Framework 2007-2013”, 2006. 11. *** - Ministerstwo Gospodarki, – “Polska podstawowe wielko ci i wska niki w latach 1995– 2006”, Warszawa, wrzesie , 2007.
12. ***- Polish Ministry of Economy - “Poland 2008, Report on foreign trade”, Warsaw, 2008. 13. *** - Polish Ministry of Economy - “Entrepreneurship in Poland”, Warsaw, 2008.
14. *** - World Bank - “Doing Business 2008”, Washington, 2008.
15. *** - World Economic Forum - The Global Competitiveness Report 2007-2008”, 16. http://www.konkurencyjnosc.gov.pl/