Acta Scientiarum
http://periodicos.uem.br/ojs/acta ISSN on-line: 1807-8621
Doi: 10.4025/actasciagron.v40i1.35285 AGRICULTURAL ENGINEERING
Acta Scientiarum. Agronomy, v. 40, e35285, 2018
Validation of an experimental prototype of thick-layer fixed bed
dryer and determination of the quality of the dried soybean grains
Paulo Carteri Coradi1* and Ângelo Francisco Calegare Lemes2
¹Universidade Federal de Santa Maria, Campus Cachoeira do Sul, Rua Ernesto Barros, 1345, Santo Antônio, 96506-322, Cachoeira do Sul, Rio Grande do Sul, Brazil. ²Universidade Federal de Mato Grosso do Sul, Campus Chapadão do Sul,Chapadão do Sul, Mato Grosso do Sul, Brazil. *Author for correspondence. E-mail: [email protected]
ABSTRACT. The aim of this study was to validate an experimental prototype dryer with a thick-layer
fixed bed and determine the quality of the dried soybean grains. The drying system was designed as a chamber with four independent drying cells, with a capacity of 164 kilograms, an air ventilation system and heating with electric heaters. This prototype was used for soybeans with an initial water content of 17% (w.b.). The samples were collected from the top, middle and bottom of the four cells to evaluate the quality of the grains. The experimental design was completely randomized factorial (3 x 4 x 3), with three temperatures settings for the drying air (30, 40, and 50°C), four drying cells and three evaluation positions (upper, middle and lower). The grains did not undergo quality changes as a function of the drying cells. In the upper part of the drying cells, there was a reduction in the specific grain mass (851 kg m-³), an increase in electrical conductivity (140.02 μS cm-1 g-1), reduction in germination (63%) and oil content (7%) compared with the middle and lower dryer positions. The experimental prototype of the fixed bed dryer allowed a uniform distribution of the heated air in the drying cells, which was effective in the drying operation and in maintaining the quality of the soybean grains.
Keywords: control and optimization of the drying; loss reduction of grain quality in the drying; yield of the drying processes.
Validação de um secador protótipo experimental de camada fixa espessa e a qualidade de
grãos de soja
RESUMO. O objetivo deste estudo foi validar um secador protótipo experimental de camada fixa espessa e
a qualidade de grãos de soja. O sistema de secagem foi projetado com uma câmara com quatro células independentes de secagem, com capacidade de 164 kg, um sistema de ventilação e aquecimento com aquecedores elétricos. Para realização dos testes de secagem, utilizaram-se soja com teores iniciais de água de 17% (b.u.). Coletou-se uma amostra superior, meio e inferior de quatro células para avaliar a qualidade dos grãos. O delineamento experimental foi inteiramente casualizado, fatorial (3 x 4 x 3), três temperaturas do ar de secagem (30, 40 e 50°C), quatro células de secagem e três posições de avaliação para cada célula de secagem (superior, médio e inferior). Os grãos não sofreram alterações de qualidade em função das células de secagem. Na parte superior das células houve redução da massa específica dos grãos (851 kg m-³), aumento da condutividade elétrica (140,02 μS cm-1 g-1), redução da germinação (63%) e teor de óleo (7,7%), em comparação com as posições média e inferior do secador. O protótipo experimental do secador de leito fixo permitiu uma distribuição uniforme do ar aquecido nas células de secagem, sendo eficaz na operação de secagem e na qualidade da soja.
Palavras-chave: controle e otimização da secagem; redução de perdas de qualidade de grãos na secagem; rendimento dos processos de secagem.
Introduction
Agricultural products are harvested at physiological maturity when the water content is high, thus, making them less prone to deterioration and contamination by fungi, insect pests and reduction of matter section (Niamnuy, Nachaisin, Poomsa, & Devahastin, 2012). In the present study, we observed that the water content of the product was higher than that of the product.
Page 2 of 11 Coradi and Lemes
their physical and chemical quality (Coradi, Fernandes, Helmich, & Goneli, 2016a; Niamnuy, Nachaisin, Poomsa, & Devahastin, 2012).
Artificial drying methods can be classified according to the variation in the heat supply, which is distributed by the air flow. The air imparts heat to the grain mass in a continuous, intermittent or stationary manner (Defendi, Nicolin, Paraíso, & Jorge, 2016; Hashemi, Mowla, & Kazemeini, 2009; Hemis, Choudhary, & Watson, 2012). Several studies have been conducted for developing new dryers and improving the existing ones to obtain a higher yield and maintain the quality of the agricultural products. The main factors involved in this improvement are the temperature and air flow controls, the velocity and pressure of the heated air, and the movement and uniformity of the water content of the product (Khatchatourian, 2012; Sivakumar, Saravanan, Elaya Perumal, & Iniyan, 2016).
Thus, the aim of this study was to validate an experimental prototype for a thick-layer fixed bed dryer and determine the quality of the dried soybean grains. The dryer system consisted of four drying chambers, forced air circulation and electric heating.
Material and methods
The research work was carried out at the Post-Harvest Grain Laboratory, in the experimental area of the Federal University of Mato Grosso do Sul (UFMS), Campus of Chapadão do Sul (CPCS). The designed drying system was composed of a
chamber with four independent drying cells for separating the grains according to water content bands, impurities or grain size, or grains from different species, with the aim of increasing the yield and quality of the grains during drying.
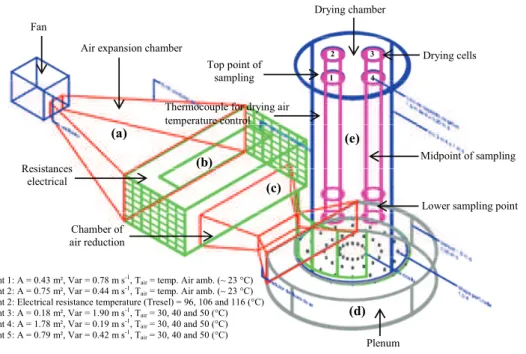
The grain dryer was constructed with 14" thick circular shaped metal sheets containing a drying chamber (e) with a height of 2.0-meters and a diameter of 1-meter, with variable static capacity according to the grain type of 164 kg of soybeans (Figure 1).
Ten percent of the total floor area was perforated. In the interior, four mobile drying cells (1.5-meter in height and 0.20-meter in diameter) were built for holding the grain mass during drying. The cells were constructed from 12" metal plates with walls having circular perforations (2 mm in diameter); the top of the cells was left open. The dryer plenum (d) with the function of reducing the drying air speed, was arranged below the drying chamber and had a diameter of 1.5 m and a height of 0.30 m. Two electric resistances (4,000 watts) were installed in the drying chamber – one in the center of the plenum and the other in the front compartment of the plenum (b), which was 1.5 m long and 0.5 m high. A centrifugal fan was connected to the dryer body. The centrifugal fan had the following specifications: straight blades, 20 m³ min-1, flow, 40
mm static pressure, 0.5 cv power, 220/380 Volts tension, 1,750 rpm and a single-phase, carbon steel structure, cast aluminum rotor with 90 DBA noise, and 35 kg weight coupled to an air expander funnel (1.5 m x 0.5 m, l x h).
Point 1: A = 0.43 m², Var = 0.78 m s-1, Tair = temp. Air amb. (~ 23 °C) Point 2: A = 0.75 m², Var = 0.44 m s-1, Tair = temp. Air amb. (~ 23 °C) Point 2: Electrical resistance temperature (Tresel) = 96, 106 and 116 (°C) Point 3: A = 0.18 m², Var = 1.90 m s-1, Tair = 30, 40 and 50 (°C) Point 4: A = 1.78 m², Var = 0.19 m s-1, Tair = 30, 40 and 50 (°C) Point 5: A = 0.79 m², Var = 0.42 m s-1, Tair = 30, 40 and 50 (°C)
(a)
(b)
(c)
(d) (e)
Top point of sampling
Midpoint of sampling
Lower sampling point Fan
Air expansion chamber
Plenum Drying chamber
Drying cells
Resistances electrical
Chamber of air reduction
Thermocouple for drying air temperature control
2
1 3
4
Experimental prototype of a fixed bed dryer Page 3 of 11
Acta Scientiarum. Agronomy, v. 40, e35285, 2018 The drying system could control the drying air
temperature directly using the electrical resistances through an external controller with dimensions of 500 x 400 x 250 mm, channels with open cutout for cable housing, circuit breaker protection for 10A command and 40A force, 24 vcc switching source for solid state relay activation, 40A three phase solid state relay with heat sink, N1040-PR temperature controller for system control, terminal strip for input and output of control cables and force (Figure 1). The electrical resistances used were U-shaped tubular type, manufactured with a 304 stainless steel tube, 11.2 mm diameter, and the iron fins, the total length of 1200 mm, 220 volts and 4500 watts. Depending on the area of the equipment, air flow and dryer heating, we obtained the variations in the drying air velocity and temperature, according to the specifications in Figure 1.
To perform the drying tests, we used soybean grains with initial water contents of 17% (w.b.), collected at a grain storage unit in the municipality of Chapadão do Sul, State of Mato Grosso do Sul, Brazil. A fixed bed with the capacity to hold 164 kg of soybean was loaded on top, and then the air ventilation system and the heating system with electric resistances were activated through an external controller to control the temperature of the drying air at 30, 40, and 50°C. The temperature conditions in the grain mass were monitored during drying using mercury thermometers in the four drying cells. The grains were sampled every hour from each of the four drying cells, and a grain-water sampler was used to determine the water content. At the end of the drying cycle, the samples from the top, middle and lower parts of the four cells were collected to evaluate the grain quality. The experimental design was a completely randomized, factorial (3 x 4 x 3) with three air drying temperatures (30, 40, and 50°C), four drying cells (1, 2, 3, and 4) and three evaluation positions for each drying cell (upper, middle, and lower). To evaluate the quality of the soybean grains, the physical classification, water content, oil content, apparent specific mass, germination, and electrical conductivity were measured. The physical classification of soybean grains was carried out according to the official standard established by the normative instruction no. 9 on March 30, 2007, by the Ministry of Agriculture, Livestock and Food Supply (MAPA) (Brasil, 2007). The water content (% w.b.) was determined by the difference in the initial and final grain mass obtained by oven drying the grains with forced air circulation at 105ºC ± 1ºC for 24 hours, with three replicates of 15 grams each, according to the Brazilian recommendations
(Brasil, 2009). For the analysis of the oil yield, the soybean grains were crushed using a domestic multiprocessor (model, Arno). Subsequently, 5 grams of the sample was weighed, transferred to a filter paper and subjected to a Soxhlet-type extractor, heated at 70°C with 150 mL of solvent hexane PA, for 4 hours. After extraction, the vessel containing oil and hexane was brought to a rotary evaporator containing water heated to 70°C and operated at 40 rpm for the separation of solvent and oil. The oil sample was kept in an oven at 65°C for 12 hours, after which the oil was weighed. The oil percentage was determined by multiplying by 100 and dividing by the mass of the initial sample, according to the methodology described by Instituto Adolfo Lutz (2008). The apparent specific mass of the soybean was determined, considering the relationship between the mass and the volume of the grains obtained by weighing with three experimental replicates.
Germination tests were conducted with four subsamples of 50 grains from each treatment, placed in rolls of “Germitest” paper towels and packed in a “Mangesdorf” type germinator, with a constant temperature of 25 ± 2ºC. The grain germination results were recorded and interpreted on the 5th and 8th
days, according to the criteria established in the Rules for Seed Analysis (Brasil, 2009). The electrical conductivity test in the soybean grains was performed according to a methodology described by Vieira, Penariol, Perecin, and Panobianco (2002). Twenty-five grains and four subsamples from each treatment were used. The samples were soaked in plastic cups with 75 mL of deionized water and maintained in a refrigerated chamber (type B.O.D.) with a controlled temperature of 25 ± 2°C for 24 hours. The solutions containing the grains were slightly agitated to standardize the leachates and immediately read in a portable CD-850 “Instrutherm” portable conductivity meter; the results were divided by the mass of 25 grains and expressed in μS cm-1 g-1 of grains. The results of the evaluations
were analyzed using the analysis of variance and Tukey’s test, at 5% probability, to determine the significant differences between the treatments.
Results and discussion
Page 4 of 11 Coradi and Lemes
Table 1. Monitoring the drying conditions of soybean grains.
1-central drying chamber 2-center drying chamber 3-center drying chamber 4-center drying chamber URair amb.
(%)
Tair amb. (°C) Tair drying (°C) Tair/URair exhaustion (°C/%)
Tmass grains
(°C)
Tair /URair exhaustion (°C/%)
Tmass grains
(°C)
Tair/URair exhaustion (°C/%)
Tmass grains
(°C)
Tair /URair exhaustion
(°C/%)
Tmass grains
(°C)
70.5 26.3 30 +2 26/72 26.9 26/73 26.3 26/73 27.1 26/73 26.9
58.8 28.6 40 +
2 29/67 29.8 29/66 29.4 29/66 30.0 29/66 29.6
45.5 31.2 50 +2 32/59 33.5 32/59 33.9 32/59 32.1 32/59 31.9
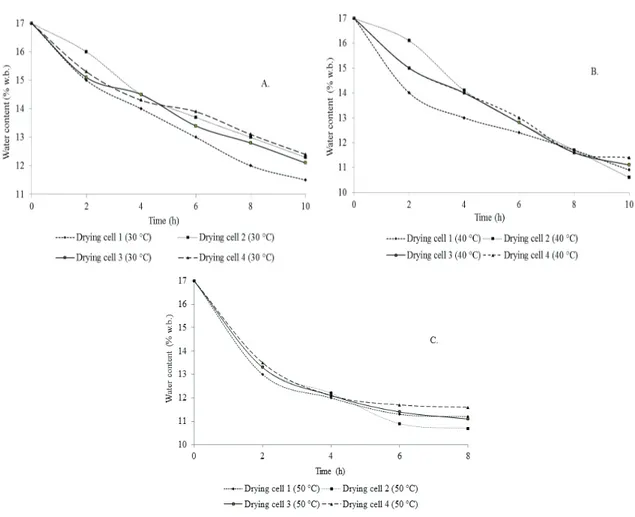
The drying curves, observed in Figure 2A, B, and C, represent the reduction of water contents of the grains from 17 to 11.5% (w.b.) at 30°C, from 17 to 10.3% at 40°C and from 17 to 10.5% (w.b.) at 50°C. Cell 1 showed the greatest reduction (with respect to time) in the water content of the grains at 30 and 40°C, until the end of the drying. The reduction in the water content of the grains at 50°C was similar for all four dryer cells. Moreover, the drying time was two hours less (8 hours) at 50°C compared with the 10 hours at 30 and 40°C.
This behavior is typical of several agricultural products and has been observed by several
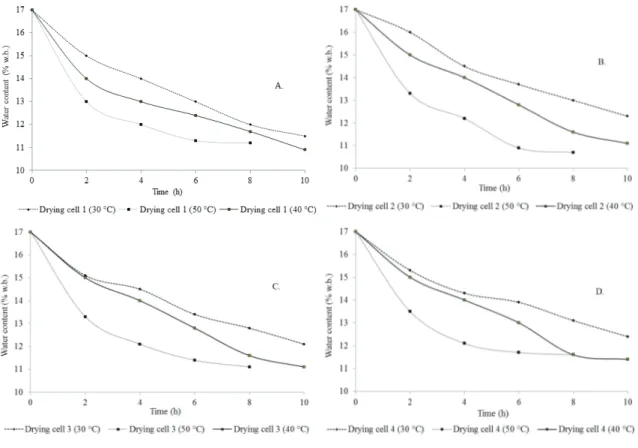
researchers studying numerous agricultural products (Brooker, Bakker-Arkema, & Hall, 1992; Chua, Hawlader, Chou, & Ho, 2002; Isquierdo et al., 2013; Resende, Oliveira, Chaves, Ferreira, & Bessa, 2014; Siqueira, Resende, & Chaves, 2012). Figure 3A, B, C, and D respectively show that the drying cells 1, 2, 3, and 4 exhibited similar behaviors at the same temperatures and drying at 50°C reduced the drying time to eight hours in all of the four cells. Moreover, drying in cell 1, independent of temperature, resulted in a more pronounced curve, which showed accelerated drying in the first hour, followed by drying at 40°C and 30°C.
Experimental prototype of a fixed bed dryer Page 5 of 11
Acta Scientiarum. Agronomy, v. 40, e35285, 2018
Figure 3. Curves drying soybeans versus temperature, (A) drying cell 1, (B) drying cell 2, (C) drying cell 3, and (D) drying cell 4.
The drying curves show that the system was of the right size for the drying process between the four cells for different air temperatures. The curves represent the same results for all cells at the same drying temperatures and for different temperatures.
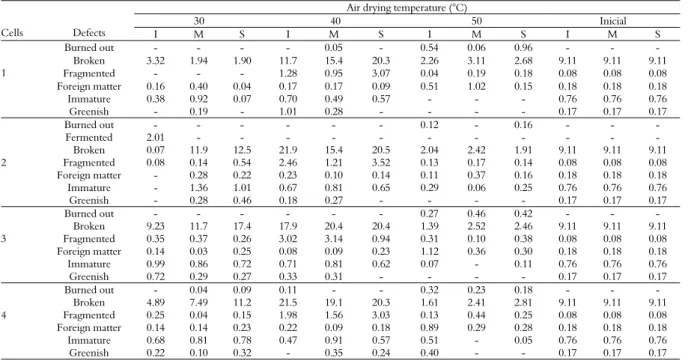
Table 2 shows the results of the physical classification of soybean grains. There was an increase in the number of broken grains during drying; however, the breakage was within the maximum limits of tolerance established by Brasil (2007). The broken or fragmented grains could be attributed to the movement of the product in the dryer (load) and the effects of the temperature of the drying air in the grains. Burned grains were not observed in any of the drying treatments; however, the percentage of fermented and burned grains increased at temperatures of 40 and 50°C.
The fermented grains are grains or pieces of grain that have undergone a visible change in the color of cotyledon due to fermentation. These defects are considered light; however, they can evolve with the deterioration process for the burned and moldy grains to a stage classified as ‘severe’ by the commercial standard (Brasil, 2007). According to Normative Instruction no. 11, which regulates the classification of soybeans, there are no acceptable maximum limits for the fermented grains; however,
the total number of damaged grains (sum of grains including burned, moldy, fermented, or germinated should not exceed 4.0% and 6.0% for the classification of Type 1 and Type 2, respectively, for Group I and should not exceed 8.0% for Group 2.
The burned defects are grains or pieces of grains that are visibly fermented and have a brown or dark coloration affecting the pulp. This may include the grains burned by the drying process, which in Group 1 should not exceed 1% for Type 1 and 2% for Type 2, whereas in Group 2 these defects should not exceed 4% as per the Basic Standard (Brasil, 2007). The immature and greenish grains and the presence of foreign matter and impurities are due to the climatic conditions, harvesting, transport and pre-cleaning of the grains.
Page 6 of 11 Coradi and Lemes
Table 2. Physical classification of soybean grains after drying (%).
Cells Defects
Air drying temperature (°C)
30 40 50 Inicial
I M S I M S I M S I M S
1
Burned out - - - - 0.05 - 0.54 0.06 0.96 - - -
Broken 3.32 1.94 1.90 11.7 15.4 20.3 2.26 3.11 2.68 9.11 9.11 9.11
Fragmented - - - 1.28 0.95 3.07 0.04 0.19 0.18 0.08 0.08 0.08
Foreign matter 0.16 0.40 0.04 0.17 0.17 0.09 0.51 1.02 0.15 0.18 0.18 0.18
Immature 0.38 0.92 0.07 0.70 0.49 0.57 - - - 0.76 0.76 0.76
Greenish - 0.19 - 1.01 0.28 - - - - 0.17 0.17 0.17
2
Burned out - - - 0.12 - 0.16 - - -
Fermented 2.01 - - - -
Broken 0.07 11.9 12.5 21.9 15.4 20.5 2.04 2.42 1.91 9.11 9.11 9.11
Fragmented 0.08 0.14 0.54 2.46 1.21 3.52 0.13 0.17 0.14 0.08 0.08 0.08
Foreign matter - 0.28 0.22 0.23 0.10 0.14 0.11 0.37 0.16 0.18 0.18 0.18
Immature - 1.36 1.01 0.67 0.81 0.65 0.29 0.06 0.25 0.76 0.76 0.76
Greenish - 0.28 0.46 0.18 0.27 - - - - 0.17 0.17 0.17
3
Burned out - - - 0.27 0.46 0.42 - - -
Broken 9.23 11.7 17.4 17.9 20.4 20.4 1.39 2.52 2.46 9.11 9.11 9.11
Fragmented 0.35 0.37 0.26 3.02 3.14 0.94 0.31 0.10 0.38 0.08 0.08 0.08
Foreign matter 0.14 0.03 0.25 0.08 0.09 0.23 1.12 0.36 0.30 0.18 0.18 0.18
Immature 0.99 0.86 0.72 0.71 0.81 0.62 0.07 - 0.11 0.76 0.76 0.76
Greenish 0.72 0.29 0.27 0.33 0.31 - - - - 0.17 0.17 0.17
4
Burned out - 0.04 0.09 0.11 - - 0.32 0.23 0.18 - - -
Broken 4.89 7.49 11.2 21.5 19.1 20.3 1.61 2.41 2.81 9.11 9.11 9.11
Fragmented 0.25 0.04 0.15 1.98 1.56 3.03 0.13 0.44 0.25 0.08 0.08 0.08
Foreign matter 0.14 0.14 0.23 0.22 0.09 0.18 0.89 0.29 0.28 0.18 0.18 0.18
Immature 0.68 0.81 0.78 0.47 0.91 0.57 0.51 - 0.05 0.76 0.76 0.76
Greenish 0.22 0.10 0.32 - 0.35 0.24 0.40 - - 0.17 0.17 0.17
I (Lower), M (Medium), and S (Upper).
Table 3. Analysis of variance of the soybean quality analyzes after drying.
FV Water content Specific mass Electrical conductivity Germination Oil content
Cells 0,0001*
0.7287NS
0.5361NS
0.0006*
0.0000*
Points 0,0001* 0.0000* 0.0001* 0.0308* 1.0000NS
Temperatures 0,0001* 0.0027* 0.0000* 0.0000* 0.0000*
Cells*temperatures 0,0001* 0.2136NS 0.4492NS 0.0033* 0.0000*
Cells*points 0,0001* 0.0000* 0.0006* 0.0096* 1.0000NS
Temperatures*points 0,0001*
0.0020*
0.0127*
0.0261*
1.0000NS
Cells*points*temperatures 0,0001* 0.0013* 0.0973NS 0.0036* 1.0000NS
*Significant, NS
Not significant.
With the increase in the drying air temperature, for the same cells and sampling points, the water content of the grains was reduced (Tables 4 and 5). According to Siqueira et al. (2012), the increase in temperature enables a reduction in the drying time of the grains because the difference between the vapor pressure of the drying air and the grain increases with the increase in temperature, providing a greater reduction of water in a shorter period.
The reduction of water in the grain during the drying period is governed by the water reduction rate until it becomes stable because the reduction in free water slows the migration of water from the interior to the surface of the grain (Jangam, Law, & Mujumdar, 2010; Lopes, Steidle Neto, & Santiago, 2014). This
behavior indicates that diffusion is the largest probable physical mechanism, which governs the movement of water in the thin layers (Khanchi et al., 2013; Nuthong, Achariyaviriya, Namsanguan, & Achariyaviriya, 2011; Rafiee et al., 2009). Moreover, the drying air temperature is the main indication for accelerating the movement of water in the thin layers.
Thus, regardless of the cell, there was a significant reduction in water content at the upper sampling point compared with the middle and lower points of the cells. Moreover, the difference observed was greater with the increase in temperature of the drying air indicating that the superior points had a higher drying rate, which caused the highest reduction in the grain water content at all drying temperatures and cells.
Table 4. Water content (% w.b.) of soybeans after drying, according to the sampling points in the cells and drying air temperatures[a].
T (°C) Cell 1 Cell 2 Cell 3 Cell 4
Experimental prototype of a fixed bed dryer Page 7 of 11
Acta Scientiarum. Agronomy, v. 40, e35285, 2018
Table 5. Water content (% w.b.) of soybeans after drying, depending on the drying cells and the drying air temperatures[a].
T (°C)
[b]Lower point cells [c]Medium point cells [d]Upper point cells
1 2 3 4 1 2 3 4 1 2 3 4 30 12.66 Aa 16.32 Cb 15.98 Bb 13.21 Aa 12.80 Aa 16.16 Cd 14.87 Cc 14.54 Bb 11.74 Ba 14.27 Cc 13.31 Cb 12.83 Cb 40 14.78 Cb 15.13 Bb 14.00 Aa 14.60 Bab 14.24 Bbc 14.76 Bc 13.37 Ba 13.89 Bab 10.90 Aa 11.19 Ba 10.66 Ba 11.18 Ba 50 14.15 Ba 14.39 Aa 14.33 Aa 14.42 Ba 14.14 Bd 13.10 Ac 11.90 Ab 11.15 Aa 12.89 Cc 8.73 Aa 9.55 Ab 9.64 Ab Initial condition 16.54 Da 16.54 Ca 16.54 Ba 16.54 Ca 16.54 Ca 16.54 Ca 16.54 Da 16.54 Ca 16.54 Da 16.54 Da 16.54 Da 16.54 Da [a]
Means followed by the same lowercase letter in the line do not differ by Tukey test at 1%. Means followed by the same capital letter in the column do not differ by Tukey test at 1%.
[b]L (Lower), [c]M (Medium), [d]U (Upper). Coefficient of variation = 1.43%.
Moreover, although the air distribution occurred uniformly in the dryer, the drying air was released from the equipment necessarily due to the mass of grains in the upper layer as observed in Figure 1. Thus, the increase in the volume of the drying air in the upper part of the equipment caused excessive drying, resulting in a greater reduction of the grain water content.
The lower and middle sampling points of the cells showed homogenous drying independent of air temperature, whereas the upper cell point showed the highest variation in water content, especially at temperatures of 40 and 50°C (Table 3). As the drying air temperature increased, the rate of water removal from the grains also decreased, indicating a greater resistance to heat transfer and mass from the interior of the product to its surface. These results suggest that diffusion is the main mechanism that determines the movement of water (Coradi, Fernandes, & Helmich, 2016b; Jangam et al., 2010; Rafiee et al., 2009; Siqueira, Resende, & Chaves, 2012).The results of the specific mass analysis are shown in Tables 6 and 7. The temperature of the drying air changes the specific mass of the grains. A comparison of the sampling points in the drying cells showed that the specific mass was higher at the midpoints of cells 1 and 2 and the lower points of cells 3 and 4 at the drying air temperature of 30°C. At 40°C, the specific mass was the highest at the
lower points of cells 1 and 2 and midpoints of cells 3 and 4. At a drying air temperature of 50°C, the specific mass was highest at the upper point of cell 1, lower points of cells 2 and 3 and the average point of sampling of cell 4. The reduction in the apparent specific mass is associated with the reduction in the water content in response to the increase in the drying air temperature. This causes greater contractions in the internal part of the cotyledons compared with its external dimensions, which contracted to a lesser extent forming voids within the grain (Niamnuy et al., 2012).
By evaluating the drying cells, the specific grain mass varied as a function of drying air temperature and sampling points in the cell. At the drying temperature of 30°C, the specific mass of the grains was higher in cells 3 (lower point) and 1 (mid and upper points), while at 40°C, the specific mass of the grains was higher in cells 4 (lower and medium points) and 3 (upper point). However, at 50°C, the specific mass was the highest in cell 3 (lower point), cell 4 (midpoint), and cell 2 (top point). The treatments that showed the greatest reduction in their masses also showed a significant increase in their electrical conductivity indicating that there was a reduction in the specific mass with a loss in dry matter and consequently quality due to the deterioration of the product.
Table 6. Specific mass (kg m-3) of soybean grains after drying, as a function of sampling points in the cells and drying air temperatures[a].
T (°C) Cell 1 Cell 2 Cell 3 Cell 4
L M U L M U L M U L M U
30 889 Aa 892 Aa 868 Ab 869 Aa 873 Aa 861 ABa 892 ABa 877 ABab 861 ABb 872 Aa 857 Cab 851 Bb 40 879 ABa 878 ABab 858 Ab 885 Aa 869 Aa 848 Bb 872 ABab 886 ABa 865 ABb 886 Aa 889 Aba 858 Bb 50 864 Ba 857 Ba 874 Aa 892 Aa 886 Aa 881 Aa 894 Aa 896 Aa 847 Bb 884 Aab 904 Aa 876 Ab Initial condition 870 ABa 870 ABa 870 Aa 870 Aa 870 Aa 870 ABa 870 Ba 870 Ba 870 Aa 870 Aa 870 BCa 870 Ba [a]Means followed by the same lowercase letter in the line do not differ by Tukey test at 1%. Means followed by the same capital letter in the column do not differ by Tukey test at 1%.
[b]L (Lower), [c]M (Medium), [d]U (Upper). Coefficient of variation = 1.23%.
Table 7. Specific mass (kg m-3) of soybeans after drying, depending on the drying cells and the drying air temperatures[a].
T (°C)
[b]Lower point cells [c]Medium point cells [d]Upper point cells
1 2 3 4 1 2 3 4 1 2 3 4 30 889 Aa 869 Aa 892 ABa 873 Aa 892 Aa 873 ab 877 ABab 857 Cb 868 Aa 861 ABa 861 ABa 851 Ba 40 879 ABa 885 Aa 872 ABa 886 Aa 878 ABa 869 Aa 886 ABa 889 ABa 858 Aa 848 Ba 865 ABa 858 ABa 50 864 Bb 892 Aa 894 Aa 884 Aab 857 Bb 886 Aa 896 Aa 904 Aa 874 Aa 881 Aa 847 Bb 876 Aa Initial condition 870 ABa 870 Aa 870 Ba 870 Aa 870 ABa 870 Aa 870 Ba 870 BCa 870 Aa 870 ABa 870 Aa 870 ABa [a]Means followed by the same lowercase letter in the line do not differ by Tukey test at 1%. Means followed by the same capital letter in the column do not differ by Tukey test at 1%.
Page 8 of 11 Coradi and Lemes
Conversely, in some treatments, we verified an increase in the specific mass after drying, which was due to the significant decrease in their water content. This observation concurred with the previous studies in soybean grains by Ribeiro, Corrêa, Rodrigues, and Goneli (2005) and corn by Peplinski, Paulis, Bietz and Pratt (1994), by Resende et al. (2012), Jatropha by Siqueira et al. (2012).
The increase in the temperature of the drying air showed an increase in the amounts of exudates released in the solution due to higher damage to the grain integuments (Tables 8 and 9). Krzyzanowski, Vieira, & França Neto (2009) described seeds with an electrical conductivity greater than 80 μS cm-1 g-1 at
approximately 13% (w.b.) water content as low vigor seeds. According to Vieira et al. (2002), the electrical conductivity is inversely proportional to the water content of the grains; thus, the amount of leachate in the solution increases the quantity of water in the grains. Our results were in agreement with the results mentioned above wherein the highest values of electrical conductivity were observed in the upper sampling points, where there was a greater reduction of grain water content, independent of the cells.
Table 9 shows that the lower sampling point of the drying cells, regardless of the air temperature, showed no difference in the evaluation of the electrical conductivity as compared with the other cells. For the mean sampling point, the electrical conductivity was higher in dry grains in cell 1 at 50°C and cell 2 at 40°C, whereas for the air temperature at 30 °C there was no difference in the electrical conductivity values between the cells. At the upper sampling point, the highest values of electrical conductivity for the air temperature of 50°C were observed in cell 4, with no differences between the cells at temperatures of 30 and 40°C.
According to Vasquez, Bertolin, and Spegiorin (2011), the electrical conductivity test can promote a stratification of different levels of grain vigor. Increased electrical conductivity results in the disorganization of the cell membranes of the grains making them more susceptible to physical damage, such as temperature and humidity, allowing the entry of pathogens and affecting the physiological quality. Resende et al. (2012) and Almeida, Resende, Mendes, Costa, and Rocha (2013) also our study corroborated the results of previous studies, which reported an increase in electrical conductivity with an increase in the drying air temperature in bean grains (Resende et al., 2012; Almeida et al., 2013).
Increasing the temperature of the drying air reduced the percentage of grain germination (Table 10). The highest reduction in the grain germination percentage occurred when they were dried at 50°C; however, this reduction of germination percentage
was not significant in the lower point of cell 2 and the higher point of cell 4. However, when the beans were dry at 40°C, there was no significant difference compared to the initial condition. Except for the midpoint of cell 2, a situation similar to the lower drying temperature of 30°C, with a significant reduction of the germination potential of the grains, was verified in cell 1 at the lower and upper points. These data agree with the results of Kowalski and Rajewska (2009) who observed that an increase in drying air temperature reduced the germination in rice grains.
Table 11 shows that at a drying air temperature of 30°C, the percentage germination differed in the cells at the lower and upper points, but at the upper point, only cell 1 differed significantly from the others. Drying at 50°C resulted in a difference in the percentage of grain germination between the cells at the lower and medium points.
However, at 40°C there were no significant differences among cells. Almeida et al. (2013) also observed a decrease in the percentage of germination with an increase in the temperature of the drying air for bean grains. Regardless of the drying position of the grains in the dryer and the temperature of the drying air used, the percentage of germination of the grains was reduced when they reached the lowest water contents after drying, corroborating the results observed by Sanjinez-Argandoña, Branco, Bittencourt, and Munhoz (2011), Niamnuy, Nachaisin, Laohavanich, and Devahastin (2011) and Coradi, Melo, and Rocha (2014). Hegarty (1978) verified that the highest germination value occurred when the grains were dried at a temperature of 45°C both in the shade and prototypes of stationary dryers regulated at temperatures of 35/45°C and 35/45°C. Moreover, the oil content of soybean grains varied significantly compared with the initial oil content due to exposure to various drying air temperatures (Tables 12 and 13).
Drying of the grains caused a reduction in the initial amount of oil in the grains, except for those in cells 3 and 4 at 50 °C. Similar results were observed by Dondee, Meeso, Soponronnarit, and Siriamornpun (2011) who observed that the soybean grains with lower water content had a higher oil yield.
Experimental prototype of a fixed bed dryer Page 9 of 11
Acta Scientiarum. Agronomy, v. 40, e35285, 2018
Table 8. Electrical conductivity (μS cm-1 g-1) of soybean grains after drying, according to the sampling points in the cells and drying air temperatures[a].
T (°C) Cell 1 Cell 2 Cell 3 Cell 4
L M U L M U L M U L M U 30 71.6 Aa 79.0 Aa 77.75 Aa 61.60 Aa 75.52 Aba 77.80 Aba 66.20 Aa 62.45 Aa 71.40 Aa 71.90 Aa 71.22 Aa 77.50 Ba 40 67.0 Aa 73.0 Aa 99.22 Ab 92.85 Ba 102.1 Ba 105.4 Ca 75.72 Aa 85.07 Aab 104.3 Bb 81.85 Aa 81.92 Aa 101.60 a 50 116.1 Ba 132.4 Bb 95.52 Aa 84.82 Aba 94.27 Aba 101.3 Ca 91.35 Aa 118.87 b 113.7 Bab 98.22 Aa 113.5 Ba 140.02 b Initial condition 74.04 Aa 74.04 Aa 74.04 Aa 74.04 Aba 74.04 Aa 74.04 Aa 74.04 Aa 74.04 Aa 74.04 Aa 74.04 Aa 74.04 Aa 74.04 Aa [a]Means followed by the same lowercase letter in the line do not differ by Tukey test at 1%. Means followed by the same capital letter in the column do not differ by Tukey test at 1%. [b]L (Lower), [c]M (Medium), [d]U (Upper). Coefficient of variation = 17.01%.
Table 9. Electric conductivity (μcm-1 g-1) of soybeans after drying, depending on drying cells and drying air temperatures[a].
T (°C)
[b]Lower point cells [c]Medium point cells [d]Upper point cells
1 2 3 4 1 2 3 4 1 2 3 4 30 71.63 Aa 61.6 Aa 66.20 Aa 71.90 Aa 79.00 Aa 75.52 ba 62.45 Aa 71.22 Aa 77.75 a 77.80 Ba 71.40 Aa 77.50 ABa 40 67.05 Aa 92.85 Ba 75.72 Aa 81.85 Aa 73.00 Aa 102.1 Bb 85.07 ab 81.92 ab 99.2 Aa 105.4 Ca 104.3 Ba 101.60 Ba 50 116.2 Bb 84.82 Ba 91.35 ab 98.22 ab 132.4 Bb 94.27 Ba 118.8 ab 113.5 ab 95.52 a 101.3 Ca 113.7 ab 140.02 Cb Initial condition 74.04 Aa 74.04 Aa 74.04 Aa 74.04 Aa 74.04 Aa 74.04 Aa 74.04 Aa 74.04 Aa 74.04 a 74.04 Aa 74.04 Aa 74.04 Aa [a]Means followed by the same lowercase letter in the line do not differ by Tukey test at 1%. Means followed by the same capital letter in the column do not differ by Tukey test at 1%.
[b]L (Lower), [c]M (Medium), [d]U (Upper). Coefficient of variation = 17.01%.
Table 10. Germination (%) of soybean grains after drying, according to the sampling points in the cells and drying air temperatures[a].
T (°C) Cell 1 Cell 2 Cell 3 Cell 4
L M U L M U L M U L M U 30 64.00 Bb 78.50 Aa 63.50 Bb 80.50 Aa 83.00 Aa 78.00 Aa 84.00 Aa 73.50 Aa 84.50 Aa 69.50 Ab 84.50 Aa 82.50 Ba 40 77.50 ab 73.00 Ab 85.00 Aa 76.50 Aa 73.00 Ba 82.50 Aa 85.50 Aa 83.00 Aa 81.00 Aa 81.50 Aa 78.00 Aa 84.50 Aa 50 57.00 Ba 53.00 Ba 62.50 Ba 69.00 Aa 65.50 Ba 64.00 Ba 66.00 Ba 53.50 b 65.50 Ba 48.00 Bb 64.00 Ba 71.50 Ba Initial condition 78.00 Aa 78.00 Aa 78.00 Aa 78.00 Aa 78.00 Aa 78.00 Aa 78.00 Ba 78.00 Aa 78.00 Aa 78.00 Aa 78.00 Aa 78.00 Ba [a]
Means followed by the same lowercase letter in the line do not differ by Tukey test at 1%. Means followed by the same capital letter in the column do not differ by Tukey test at 1%. [b]L (Lower), [c]M (Medium), [d]U (Upper). Coefficient of variation = 9.14%.
Table 11. Germination (%) of soybean grains after drying as a function of drying cells and drying air temperatures[a] .
T (°C)
[b]
Lower point cells [c]
Medium point cells [d]
Upper point cells
1 2 3 4 1 2 3 4 1 2 3 4 30 64.0 Bc 80.5 Aab 84.0 Aa 69.5 Abc 78.5 Aa 83.0 Aa 73.5 Aa 84.50 Aa 63.5 Bb 78.0 Aa 84.5 Aa 82.5 ABa 40 77.5 Aa 76.5 Aa 85.5 Aa 81.50 Aa 73.00 Aa 73.0 ABa 83.0 Aa 78.00 Aa 85.00 Aa 82.50 Aa 81.0 Aa 84.50Aa 50 57.0 Bab 69.0 Aa 66.0 Ba 48.0 Bb 53.00 Bb 65.5 Ba 53.5 ab 64.00 ab 62.5 Ba 64.0 Ba 65.50Ba 71.5 Ba Initial condition 78.0 Aa 78.0 Aa 78.0 Ba 78.0 Aa 78.00 Aa 78.0 Aa 78.0 Aa 78.00 Aa 78.0 Aa 78.0 Aa 78.0 Aa 78.0 ABa [a]Means followed by the same lowercase letter in the line do not differ by Tukey test at 1%. Means followed by the same capital letter in the column do not differ by Tukey test at 1%. [b]L (Lower), [c]M (Medium), [d]U (Upper). Coefficient of variation = 9.14%.
Table 12. Oil content (%) of soybean grains after drying, according to the sampling points in the cells and drying air temperature[a].
T (°C) Cell 1 Cell 2 Cell 3 Cell 4
L M U L M U L M U L M U 30 9.05 Ca 9.05 Ca 9.05 Ca 9.89 Da 9.89 Da 9.89 Da 9.22 Da 9.22 Da 9.22 Da 9.28 Da 9.28 Da 9.28 Da 40 7.70 Da 7.70 Da 7.70 Da 10.9 Ca 10.9 Ca 10.9 Ca 14.3 Ca 14.3 Ca 14.3 Ca 12.9 Ca 12.9 Ca 12.92 Ca 50 12.17 Ba 12.1 Ba 12.1 Ba 12.3 Ba 12.3 Ba 12.3 Ba 17.9 Aa 17.9 Aa 17.9 Aa 18.0 Aa 18.0 Aa 18.07 Aa Initial condition 15.44 Aa 15.4 Aa 15.4 Aa 15.4 Aa 15.4 Aa 15.4 Aa 15.4 Ba 15.4 Ba 15.4 Ba 15.4 Ba 15.4 Ba 15.44 Ba [a]Means followed by the same lowercase letter in the line do not differ by Tukey test at 1%. Means followed by the same capital letter in the column do not differ by Tukey test at 1%. [b]L (Lower), [c]M (Medium), [d]U (Upper). Coefficient of variation = 9.14%.
Table 13. Oil content (%) of soybean grains after drying as a function of the drying cells and drying air temperatures[a].
T (°C)
[b]Lower point cells [c]Medium point cells [d]Upper point cells
1 2 3 4 1 2 3 4 1 2 3 4 30 9.05 Ca 9.89 Da 9.22 Da 9.28 Da 9.05 Ca 9.89 Da 9.22 Da 9.28 Da 9.05 Ca 9.89 Da 9.22 Da 9.28 Da 40 7.70 Dd 10.9 Cc 14.3 Ca 12.9 Cb 7.70 Dd 10.9 Cc 14.3 Ca 12.92 Cb 7.70 Dd 10.9 Cc 14.3 Ca 12.9 Cb 50 12.1 Bb 12.3 Bb 17.9 Aa 18.0 Aa 12.17 Bb 12.3 Bb 17.9 Aa 18.07 Aa 12.1 Bb 12.3 Bb 17.9 Aa 18.0 Aa Initial condition 15.4 Aa 15.4 Aa 15.4 Ba 15.4 Ba 15.44 Aa 15.4 Aa 15.4 Ba 15.44 Ba 15.4 Aa 15.4 Aa 15.4 Ba 15.44Ba [a]Means followed by the same lowercase letter in the line do not differ by Tukey test at 1%. Means followed by the same capital letter in the column do not differ by Tukey test at 1%. [b]L (Lower), [c]M (Medium), [d]U (Upper). Coefficient of variation = 9.14%.
Conclusion
The increase in the drying air temperature to 50°C decreased the quality of soybeans. Different drying cells did not affect the quality of grain. In the upper part of the cells, there was an increase in electrical conductivity (140.02 μS cm-1 g-1) and a
reduction of the specific grain mass (851 kg m-³),
Page 10 of 11 Coradi and Lemes
operation and maintaining the quality of the soybean.
Acknowledgements
The authors thank FUNDECT, CNPq and CAPES-Brazil by financial support.
References
Almeida, D. P., Resende, O., Mendes, U. C., Costa, L. M., & Rocha, A. C. (2013). Influência da secagem na qualidade fisiológica do feijão adzuki. Revista Brasileira de Ciências Agrárias, 8(2), 311-315. doi: 10.5039/agraria.v8i2a2164 Brasil. Ministério da Agricultura, Pecuária e
Abastecimento. (2007). Instrução normativa n. 11, de 15 de maio de 2007 para classificação física da soja. Brasília, DF: SNAD/DNDV/CLAV.
Brasil. Ministério da Agricultura, Pecuária e Abastecimento. (2009). Regras para análise de sementes.
Brasília, DF: SNAD/DNDV/CLAV.
Brooker, D. B., Bakker-Arkema, F. W., & Hall, C. W. (1992). Drying and storage of grains and oilseeds. New York, US: van Nostrand Reinhold.
Chua, K. J., Hawlader, M. N. A., Chou, S. K., & Ho, J. C. (2002). On the study of time-varying temperature drying-effect on drying kinetics and product quality.
Drying Technology, 20(8), 1559-1577. doi: 10.1081/DRT-120014052
Coradi, P. C., Melo, E. C., & Rocha, R. P. (2014). Evaluation of electrical conductivity as a quality parameter of lemongrass leaves (Cymbopogon citratus
Stapf) submitted to drying process. Drying Technology,
32(1), 969-980. doi: 10.1080/ 07373937.2013.879593 Coradi, P. C., Fernandes, C. H. P., Helmich, J. C., &
Goneli, A. L. D. (2016a). Effects of drying air temperature and grain initial moisture content on soybean quality (Glycine max (L.) Merrill). Engenharia Agrícola, 36(5), 866-876. doi: 10.1590/ 1809-4430-Eng.Agric.v36n5p866-876/2016
Coradi, P. C., Fernandes, C. H. P., & Helmich, J. C. (2016b). Adjustment of mathematical models and quality of soybean grains in the drying with high temperatures. Revista Brasileira de Engenharia Agrícola e
Ambiental, 20(4), 385-392. doi:
10.1590/1807-1929/agriambi.v20n4p385-392
Defendi, R. O., Nicolin, D. J., Paraíso, P. R., & Jorge, L. M. D. M. (2016). Assessment of the initial moisture content on soybean drying kinetics and transport properties. Drying Technology, 34(3), 360-371.
Dondee, S., Meeso, N., Soponronnarit, S., & Siriamornpun, S. (2011). Reducing cracking and breakage of soybean grains under combined near-infrared radiation and fluidized-bed drying. Journal Food Engineering, 104(1), 6-13. doi: 10.1016/j.jfoodeng.2010.11.018
Hashemi, G., Mowla, D., & Kazemeini, M. (2009). Moisture diffusivity and shrinkage of broad beans during bulk drying in an inert medium fluidized bed dryer assisted by
dielectric heating. Journal Food Engineering,92(3),331-338. doi: 10.1016/j.jfoodeng.2008.12.004
Hegarty, T. W. (1978). The physiology of seed hydration and dehydration and relation between water stress and control of germination: a review. Plant Cell Evironmental, 1(1), 101-19. doi: 10.1111/j.1365-3040.1978.tb00752.x
Hemis, M., Choudhary, R., & Watson, D. G. (2012). A coupled mathematical model for simultaneous microwave and convective drying of wheat seeds.
Biosystems Engineering, 112(3), 202-209. doi:
10.1016/j.biosystemseng.2012.04.002
Instituto Adolfo Lutz. (2008). Normas Analíticas do Instituto Adolfo Lutz. Métodos físico-químicos para análises de alimentos (4a ed., 1a ed. digital). São Paulo, SP: Instituto Adolfo Lutz
Isquierdo, E. P., Borém, F. M., Andrade, E. T., Corrêa, J. L. G., Oliveira, P. D., & Alves, G. E. (2013). Drying Kinetics and quality of natural coffee. Transactions of the American Society of Agricultural and Biological Engineers,
56(3), 1003-1010. doi: 10.13031/trans.56.9794
Jangam, S. V., Law, C. L., & Mujumdar A. S. (2010).
Drying of foods, vegetables and fruits Singapore: National University of Singapore.
Khanchi, A., Jones, C. L., Sharma, B., Huhnke, R. L., Weckler, P., & Maness, N. O. (2013). An empirical model to predict infield thin layer drying rate of cut switchgrass. Biomass and Bioenergy, 58(1), 128-135. doi: 10.1016/j.biombioe.2013.08.024
Khatchatourian, O. A. (2012). Experimental study and mathematical model for soya bean drying in thin layer.
Biosystems Engineering, 113(1), 54-64. doi:
10.1016/j.biosystemseng.2012.06.006
Kowalski, S. J., & Rajewska, K. (2009). Effectiveness of hybrid drying. Chemical Engineering Process, 48(8), 1302-1309. doi: 10.1016/j.cep.2009. 05.009
Krzyzanowski, F. C., Vieira, R. D., & França Neto, J. B. (2009). Vigor de sementes: conceitos e testes. Londrina, PR: Associação Brasileira de Tecnologia de Sementes. Lopes, D. C., Steidle Neto, A. J., & Santiago, J. K. (2014).
Comparison of equilibrium and logarithmic models for grain drying. Biosystems Engineering, 118(1), 105-114. doi: 10.1016/j.biosystemseng. 2013.11.011
Niamnuy, C., Nachaisin, M., Laohavanich, J., & Devahastin, S. (2011). Evaluation of bioactive compounds and bioactivities of soybean dried by different methods and conditions. Food Chemistry,
129(3), 899-906. doi: 10.1016/j. foodchem.2011.05.042 Niamnuy, C., Nachaisin, M., Poomsa, N., & Devahastin, S.
(2012). Kinetic modeling of drying and conversion/degradation of isoflavones during infrared drying of soybean. Food Chemistry, 133(3), 946-952. doi: 10.1016/j.foodchem.2012.02.010
Nuthong, P., Achariyaviriya, A., Namsanguan, K., & Achariyaviriya, S. (2011). Kinetics and modeling of whole longan with combined infrared and hot air.
Journal Food Engineering, 102(3), 233-239. doi:
Experimental prototype of a fixed bed dryer Page 11 of 11
Acta Scientiarum. Agronomy, v. 40, e35285, 2018
Peplinski, A. J., Paulis, J. W., Bietz, J. A., & Pratt, R. C. (1994). Drying of high-moisture corn: Changes in properties and physical quality. Cereal Chemistry, 71(2), 129-133.
Rafiee, S. H., Keyhani, A., Sharifi, M., Jafari, A., Mobli, H., & Tabatabaeefar, A. (2009). Thin Layer Drying Properties of Soybean (Viliamz Cultivar). Journal of Agricultural Science and Technology, 11(3), 289-300.
Resende, O., Almeida, D. P., Costa, L. M., Mendes, U. C., & Sales, J. F. (2012). Adzuki beans (Vigna angularis) seed quality under several drying conditions. Ciência e Tecnologia de Alimentos, 32(1), 151-155.
Resende, O., Oliveira, D. E. C., Chaves, T. H., Ferreira, J., & Bessa, V. (2014). Kinetics and thermodynamic properties of the drying process of sorghum (Sorghum bicolor [L.] Moench) grains. African Journal of Agricultural
Research, 9(32), 2453-2462. doi: 10.5897/
AJAR2014.8808
Sanjinez-Argandoña, E. J., Branco, I. G., Bittencourt, T. U., & Munhoz, C. L. (2011). Influence of temperature and geometry in the drying kinetics of tomato (Lycopersicum esculentum). Food Science and Technology,
31(2), 308-312. doi:
10.1590/S0101-20612011000200005
Ribeiro, D. M., Corrêa, P. C., Rodrigues, D. H., & Goneli, A. L. (2005). Análise da variação das propriedades físicas dos grãos de soja durante o processo
de secagem. Food Science and Technology, 25(3), 611-617. doi: 10.1590/S0101-20612005000300035.
Siqueira, V. C., Resende, O., & Chaves, T. H. (2012). Drying kinetics of Jatropha seeds. Revista Ceres, 59(2), 171-177. doi: 10.1590/S0034-737X2012000200004 Sivakumar, R., Saravanan, R., Elaya Perumal, A., & Iniyan, S.
(2016). Fluidized bed drying of some agro products–A review. Renewable and Sustainable Energy Reviews, 61(1), 280-301. doi: 10.1016/ j.rser.2016.04.014
Vasquez, G. H., Bertolin, D. C., & Spegiorin, C. N. (2011). Testes de envelhecimento acelerado e de condutividade elétrica para avaliar a qualidade fisiológica de sementes de sorgo (Sorghum bicolor (L.) Moench). Revista Brasileira de Biociências, 9(1), 18-24. Vieira, R. D., Penariol, A. L., Perecin, D., & Panobianco,
M. (2002). Condutividade elétrica e teor inicial das sementes de soja. Pesquisa Agropecuária Brasileira, 37(9), 1333-1338. doi: 10.1590/S0100-204X2002000900018
Received on February 8, 2017. Accepted on May 12, 2017.
![Table 6. Specific mass (kg m -3 ) of soybean grains after drying, as a function of sampling points in the cells and drying air temperatures [a]](https://thumb-eu.123doks.com/thumbv2/123dok_br/15997159.691152/7.892.127.806.131.213/table-specific-soybean-grains-drying-function-sampling-temperatures.webp)
![Table 13. Oil content (%) of soybean grains after drying as a function of the drying cells and drying air temperatures [a]](https://thumb-eu.123doks.com/thumbv2/123dok_br/15997159.691152/9.892.129.806.722.801/table-content-soybean-grains-drying-function-drying-temperatures.webp)
