www.atmos-chem-phys.net/11/10057/2011/ doi:10.5194/acp-11-10057-2011
© Author(s) 2011. CC Attribution 3.0 License.
Chemistry
and Physics
Atmospheric deposition of nitrogen to the Baltic Sea in the period
1995–2006
J. Bartnicki, V. S. Semeena, and H. Fagerli
Research and Development Department, Norwegian Meteorological Institute, Oslo, Norway Received: 15 December 2010 – Published in Atmos. Chem. Phys. Discuss.: 19 January 2011 Revised: 6 June 2011 – Accepted: 13 September 2011 – Published: 4 October 2011
Abstract. The EMEP/MSC-W model has been used to compute atmospheric nitrogen deposition into the Baltic Sea basin for the period of 12 yr: 1995–2006. The level of an-nual total nitrogen deposition into the Baltic Sea basin has changed from 230 Gg N in 1995 to 199 Gg N in 2006, de-creasing 13 %. This value corresponds well with the total nitrogen emission reduction (11 %) in the HELCOM Con-tracting Parties. However, inter-annual variability of nitrogen deposition to the Baltic Sea basin is relatively large, ranging from−13 % to +17 % of the averaged value. It is mainly
caused by the changing meteorological conditions and es-pecially precipitation in the considered period. The calcu-lated monthly deposition pattern is similar for most of the years showing maxima in the autumn months October and November. The source allocation budget for atmospheric nitrogen deposition to the Baltic Sea basin was calculated for each year of the period 1997–2006. The main emis-sion sources contributing to total nitrogen deposition are: Germany 18–22 %, Poland 11–13 % and Denmark 8–11 %. There is also a significant contribution from distant sources like the United Kingdom 6–9 %, as well as from the interna-tional ship traffic on the Baltic Sea 4–5 %.
1 Introduction
The effects of eutrophication are most likely the single great-est threat to the unique and fragile environment of the Baltic Sea (HELCOM, 2010). Nitrogen and phosphorus are the main nutrients which in high concentrations stimulate growth of algae which in turn leads to imbalanced functioning of the
Correspondence to:J. Bartnicki ([email protected])
system and eutrophication (HELCOM, 2009). The nitrogen input entering the Baltic Sea is both airborne and waterborne, whereas phosphorus input is mostly waterborne (HELCOM, 2010). Atmospheric deposition of nitrogen accounts for ap-proximately one quarter to one third of the total nitrogen in-put to the Baltic Sea (HELCOM, 2005a) and has been reg-ularly monitored by following the results of measurements and model calculations.
The Co-operative Program for Monitoring and Evaluation of the Long-Range Transmission of Air Pollutants in Eu-rope (EMEP) and the Baltic Marine Environment Protection Commission (HELCOM) are both conducting work on air monitoring, modelling and compilation of emission invento-ries of different pollutants, especially nitrogen species. In 1995, HELCOM decided to rationalize its current programs by avoiding duplication of efforts with specialised interna-tional organizations. At the request of HELCOM, the steer-ing Body of EMEP at its nineteenth session agreed to assume the management of atmospheric monitoring data, the prepa-ration of air emission inventories and the modelling of air pollution in the Baltic region.
Following this agreement, the EMEP Centres have been responsible for regular evaluation of the state of the atmo-sphere in the Baltic Sea region and have produced the annual joint summary reports with updated emissions of nitrogen compounds, heavy metals and POPs, modelled deposition fields, allocation budgets and measurement data. Altogether thirteen joint EMEP Centres reports for HELCOM have been published, the last one in 2010 (Bartnicki et. al., 2010).
33 39
31
28 30 36
32 27
47
32 33 36
0 5 10 15 20 25 30 35 40 45 50
1995 1996 1997 1998 1999 2000 2001 2002 2003 2004 2005 2006
Year
A
ir
bo
rne
c
on
tr
ibu
ti
on
(
%
)
Fig. 1. Annual airborne contribution to total (waterborne plus air-borne) input of nitrogen into the Baltic Sea basin in the period 1995–2006. Units: % of total input.
and the information about waterborne input into the Baltic available in Wulff et al. (2006). Typically, the airborne con-tribution is a quarter to one third of the total input. However, the results in Fig. 1 show a large inter-annual variation in air-borne contribution to nitrogen input, with minimum – 27 % in the year 2002 and maximum – 47 % in the year 2000, sig-nificantly exceeding the typical range. In the year 2000 dry and wet deposition of nitrogen from the air is reaching maxi-mum for the entire period, whereas the waterborne input is at the minimum. The maximum of airborne contribution reach-ing almost 50 % in the year 2000 indicates that the estimation of atmospheric nitrogen deposition is important for the accu-rate calculation of total nitrogen input into the Baltic Sea.
The estimation of airborne nitrogen input to the Baltic Sea is based on both measurements (Rolf et al., 2008; HELCOM, 2005a) and on modelling studies (Hertel et al., 2003; Langer et al., 2009; Bartnicki et al., 2010). Rolf et al. (2008) no-ticed a deposition gradient from the coastal regions to open waters or remote islands. Langner et al. (2009) estimated the present and future deposition of nitrogen into the Baltic Sea using the Eulerian chemical transport model MATCH. The calculated average total nitrogen deposition in the period 1992–2001 was in the range 261–300 Gg N yr−1with
inter-annual variability 5.1–8.0 %. Their study predicts around 5 % increase in the total deposition of reactive nitrogen into the Baltic Sea towards the end of 21st century. Hertel et al. (2003) calculated the annual 1999 deposition of nitrogen into the Baltic Sea with the ACDEP model. The calculated annual deposition was equal to 318 Gg N yr−1for the basin
area 464 406 km2. The deposition showed maximum over
Danish waters during the mid summer periods when the al-gal growth is high whereas the deposition maximum values were distributed over most of the year in the northern part of the Baltic Sea. On the other hand, long-term trends in nitro-gen deposition are nitro-generally related to the trends in anthro-pogenic emissions, meteorological variability, nonlinearities in atmospheric chemistry and these factors can offset the ex-pected changes in deposition.
Here we present and discuss the most important results of the EMEP work for HELCOM concerning atmospheric
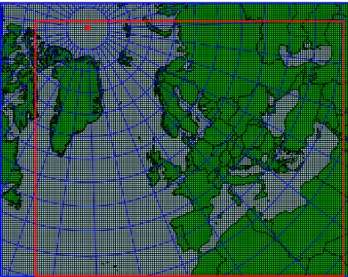
ni-Fig. 2.Standard computational domain of the EMEP Unified model (external frame) and reduced domain (internal red frame) where computations of nitrogen deposition were performed for the period 1995–2006.
trogen deposition to the Baltic Sea. We have chosen the pe-riod 1995–2006 for the calculation of nitrogen deposition for several reasons. Firstly, because the consistent and continu-ous meteorological and emission data are available for the se-lected time frame only. Secondly, we could use for the entire period, exactly the same version (rv3.1) of the EMEP Uni-fied model as well as the same computational model domain. Under normal operation, the EMEP model is frequently im-proved and changed, almost every year and often different model versions are applied for calculating transport and de-position in different years. The same applies to meteoro-logical data, which can be provided by different Numerical Weather Prediction (NWP) models in different years. By se-lecting the 1995–2006 period, we managed to avoid these kind of problems in the present study.
The standard computational domain of the EMEP model is shown in Fig. 2 together with slightly smaller domain which was used for calculations presented here. The size of the standard model grid is 170×133 nodes and its resolution is
50 km in Polar Stereographic Projection at 60◦N. The Baltic
Sea Basin is located in the centre of the reduced model do-main, which is large enough for the estimation of nitrogen deposition and source receptor allocation for the Baltic Sea basin.
Fig. 3.Spatial distribution of annual 2006 nitrogen dioxide emissions (left) and annual 2006 ammonia emissions (right) in the model grid covering the Baltic Sea region. Units: Mg N per year and per grid.
0 500 1000 1500 2000 2500 3000 3500 4000 4500
1995 1996 1997 1998 1999 2000 2001 2002 2003 2004 2005 2006
Year
Em
issi
o
n
Fig. 4.Annual emissions of nitrogen oxides (NO2-N) and ammonia (NH3-N) from all HELCOM Contracting Parties and annual nitro-gen oxides emissions from the international ship traffic on the Baltic Sea (BAS-N) in the period 1995–2006. Units: Gg N per year.
2 Nitrogen emissions
As far as possible, the emission data submitted by the EMEP Contracting Parties have been used in the model runs pre-sented in this study. However, in case of missing or incorrect data, the expert estimates were used instead (Vestreng, 2003). Annual total emissions of sulphur dioxide (SO2), nitrogen
oxides (NOx= NO + NO2), ammonia (NH3), non-methane
volatile organic compounds (NMVOC), carbon monoxide (CO), and particulates (PM2.5, PM10) are submitted every
year, by each Contracting Party. In addition, spatial distri-butions of these emissions in the EMEP grid system are be-ing updated approximately once in five years, since the loca-tions of main sources in each country do not change very often. For the modelling purpose the submitted emission data, as well as the emission data from international ship traffic are verified and eventually corrected by experts. The description of procedures used for collecting anthropogenic
emissions, filling-in gaps, and for spatial distribution can be found in (Vestreng, 2003; EMEP, 2010). The emission data used in this study for the period 1995–2005 have been orig-inally compiled at the meteorological Synthesizing Centre-West (MSC-W) in Oslo and that for the year 2006 have been compiled at the Centre for Emission Inventories and Projec-tions (CEIP) located in the Federal Environment Agency in Vienna, Austria and can be found on the CEIP’s web pages (CEIP, 2010). For the final model runs, the latest emissions available at MSC-W in 2010 have been used (Semeena et al., 2009).
DK05: Keldsnor 0 100 200 300 400 500 600 700 800 900 1000
1995 1996 1997 1998 1999 2000 2001 2002 2003 2004 2005 2006
Year D epo si ti on obs mod DK08: Anholt 0 100 200 300 400 500 600 700 800
1995 1996 1997 1998 1999 2000 2001 2002 2003 2004 2005 2006
Year D epo si ti on obs mod EE11: Vilsandi 0 100 200 300 400 500 600 700
1995 1996 1997 1998 1999 2000 2001 2002 2003 2004 2005 2006
Year obs mod FI04: Ähtäri 0 50 100 150 200 250 300
1995 1996 1997 1998 1999 2000 2001 2002 2003 2004 2005 2006
Year obs mod FI09: Utö 0 100 200 300 400 500 600
1995 1996 1997 1998 1999 2000 2001 2002 2003 2004 2005 2006
D epo si ti on obs mod
FI17: Virolahti II
0 100 200 300 400 500 600
1995 1996 1997 1998 1999 2000 2001 2002 2003 2004 2005 2006
Year D epo si ti on obs mod LT15: Preila 0 100 200 300 400 500 600 700 800
1995 1996 1997 1998 1999 2000 2001 2002 2003 2004 2005 2006
Year D epo si ti on obs mod LV10: Rucava 0 200 400 600 800 1000
1995 1996 1997 1998 1999 2000 2001 2002 2003 2004 2005 2006
Year D ep o si ti o n obs mod PL04: Leba 0 100 200 300 400 500 600 700 800
1995 1996 1997 1998 1999 2000 2001 2002 2003 2004 2005 2006
Year D ep o si ti o n obs mod SE05: Bredkälen 0 50 100 150 200 250
1995 1996 1997 1998 1999 2000 2001 2002 2003 2004 2005 2006
Year D ep o si ti o n obs mod SE11: Vavihill 0 100 200 300 400 500 600 700 800 900 1000
1995 1996 1997 1998 1999 2000 2001 2002 2003 2004 2005 2006
Year D ep o si ti o n obs mod Annual precipitation 0 100 200 300 400 500 600 700 800 900
1995 1996 1997 1998 1999 2000 2001 2002 2003 2004 2005 2006
P re ci pi ta ti on [ m m ] obs mod
Ye a r
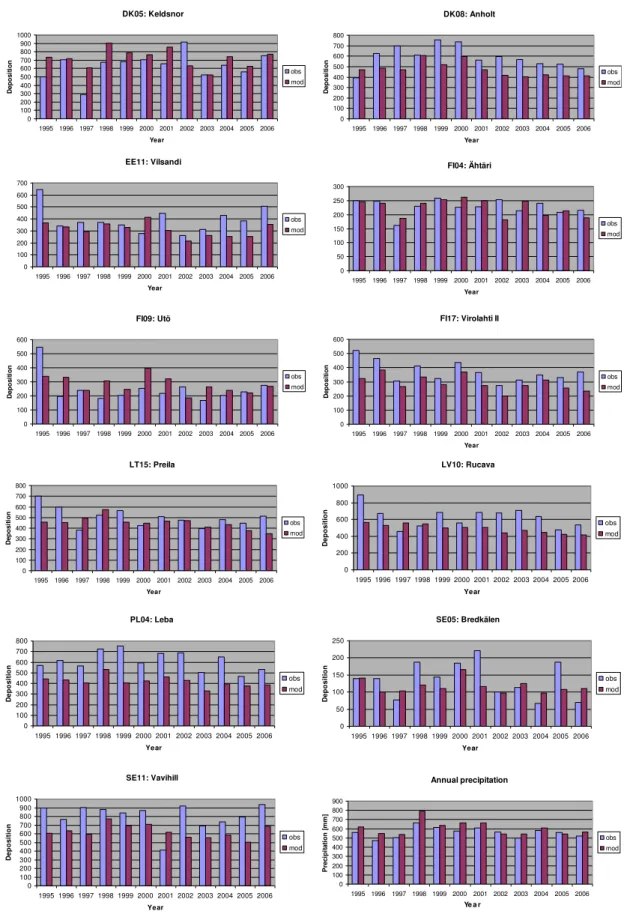
Fig. 5.Comparison of annual wet deposition based on observations (obs) at selected HELCOM stations and calculated by the EMEP model
(mod) for the grid squares including these stations, for each year of the period 1995–2006. Units: mg N m−2. Annual precipitation to the
Table 1.Annual emissions of nitrogen oxides in HELCOM Contracting Parties and from the international ship traffic on the Baltic Sea in
the period 1995–2006. Units: Gg NO2per year.
Year HELCOM Contracting Party
Denmark Estonia Finland Germany Latvia Lithuania Poland Russia Sweden Baltic
1995 252.7 38.5 258.0 2131.1 40.9 64.6 1121.0 2788.4 270.5 267.5
1996 290.0 41.4 268.1 2050.3 42.6 64.2 1155.0 2688.1 260.7 274.3
1997 244.2 40.2 258.9 1975.6 40.9 63.4 1114.0 2628.9 249.8 281.2
1998 221.2 38.9 251.1 1939.5 38.7 65.4 991.0 2758.5 241.8 288.3
1999 205.4 34.5 247.0 1915.7 36.6 57.4 953.0 2795.9 230.1 295.5
2000 187.6 36.7 235.3 1854.7 34.4 48.7 838.0 2666.3 217.1 303.0
2001 183.7 37.7 219.7 1762.8 37.9 47.0 847.9 2801.2 210.8 310.6
2002 180.8 40.1 207.6 1674.1 36.8 51.3 796.0 2927.5 205.5 318.5
2003 189.0 39.2 217.6 1604.7 38.2 52.6 808.1 3368.8 202.7 326.5
2004 171.4 36.8 204.7 1554.3 38.8 54.7 804.2 3356.2 197.4 334.7
2005 185.8 32.1 177.4 1443.1 41.1 57.6 810.9 3356.2 204.9 343.2
2006 185.3 30.5 192.8 1394.3 43.8 61.4 889.6 3634.9 174.6 346.7
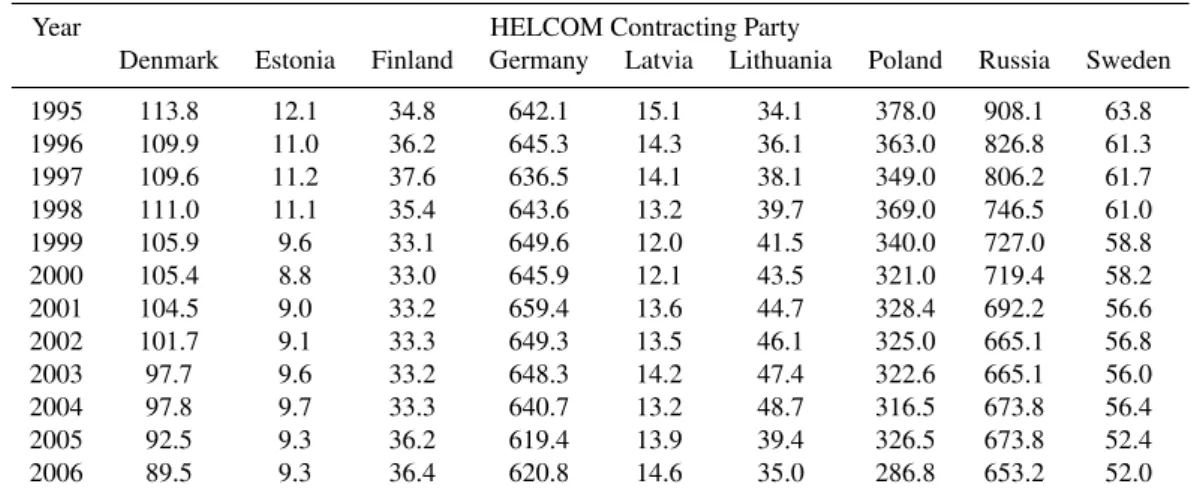
Table 2.Annual emissions of ammonia in HELCOM Contracting Parties in the period 1995 – 2006. Units: Gg NH3per year.
Year HELCOM Contracting Party
Denmark Estonia Finland Germany Latvia Lithuania Poland Russia Sweden
1995 113.8 12.1 34.8 642.1 15.1 34.1 378.0 908.1 63.8
1996 109.9 11.0 36.2 645.3 14.3 36.1 363.0 826.8 61.3
1997 109.6 11.2 37.6 636.5 14.1 38.1 349.0 806.2 61.7
1998 111.0 11.1 35.4 643.6 13.2 39.7 369.0 746.5 61.0
1999 105.9 9.6 33.1 649.6 12.0 41.5 340.0 727.0 58.8
2000 105.4 8.8 33.0 645.9 12.1 43.5 321.0 719.4 58.2
2001 104.5 9.0 33.2 659.4 13.6 44.7 328.4 692.2 56.6
2002 101.7 9.1 33.3 649.3 13.5 46.1 325.0 665.1 56.8
2003 97.7 9.6 33.2 648.3 14.2 47.4 322.6 665.1 56.0
2004 97.8 9.7 33.3 640.7 13.2 48.7 316.5 673.8 56.4
2005 92.5 9.3 36.2 619.4 13.9 39.4 326.5 673.8 52.4
2006 89.5 9.3 36.4 620.8 14.6 35.0 286.8 653.2 52.0
The maps with spatial distributions of nitrogen oxides and ammonia emissions around the Baltic Sea look similar for all the years of the considered period. As an example, the maps with spatial distributions of the annual 2006 nitrogen oxides and ammonia emissions in the Baltic Sea region are presented in Fig. 3. Nitrogen oxides emissions from the inter-national ship traffic on the Baltic Sea are visible in the Baltic Sea basin. Emission sources of ammonia are located on the land only and they are not present in the Baltic Sea basin. There is a south-north gradient in both, nitrogen oxides and ammonia emissions, but slightly steeper for ammonia emis-sions.
Total HELCOM emissions calculated as a sum of contri-butions from the HELCOM contracting parties have been re-duced during the considered period by 5 % and 18 %, for ni-trogen oxides and ammonia, respectively (Fig. 4). However, the reduction pattern was quite different for nitrogen oxides and ammonia. Nitrogen oxides emissions decreased almost
–
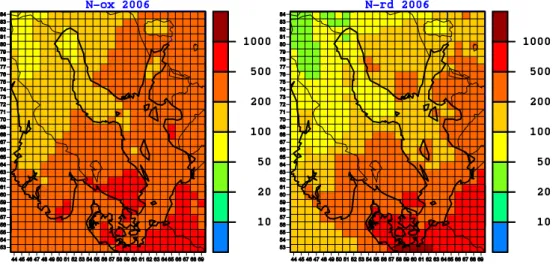
Fig. 6.Map of annual 2006 oxidised nitrogen deposition (left) and annual 2006 reduced nitrogen deposition (right). Units: mg N m−2.
3 Nitrogen deposition into the Baltic Sea
Nitrogen emission inventories described in the previous sec-tion have been used to calculate annual and monthly nitrogen deposition for the entire period of 1995–2006. The version rv3.1 of the EMEP Unified model has been used to calculate both annual and monthly deposition fields of oxidised dry, oxidised wet, reduced dry and reduced wet nitrogen to the Baltic Sea basin.
3.1 Comparison of modelled and measured deposition
Since the beginning of its operational application, the EMEP model has been systematically evaluated every year on the latest available measurement data and the results are pub-lished in the annual EMEP reports (Berge et al., 2010; Fagerli et al., 2011). In addition, the model evaluation has been a subject of several publications (e.g. Simpson et al., 2006a, 2006b; Fagerli and Aas, 2008). The study of Fagerli and Aas (2008) focused on comparison of modelled and mea-sured nitrogen in air and precipitation in the long term pe-riod 1980–2003. Altogether 33 EMEP sites located in differ-ent parts of Europe were used in the study which indicated a decline of ammonium and nitrate in precipitation both in measurements and model results. However, out of 33, only 5 sites reported concentration in precipitation in the loca-tions close to the Baltic Sea basin. Therefore, here we have used additional data from the Norwegian Institute of Air Re-search (W. Aas, personal communication, 2010) with mea-sured nitrogen concentrations in precipitation and precipita-tion amount at so called HELCOM staprecipita-tions. The HELCOM stations are in fact the EMEP stations reporting in slightly different way for the HELCOM purpose. We have exam-ined 21 HELCOM sites, of which 11 reported annual nitro-gen concentrations in precipitation and precipitation amount for the entire period 1995–2006. We have used these 11
sta-tions for comparing annual wet deposition based on observa-tions with the modelled wet deposition. In addition, annual precipitation amount to the Baltic Sea basin has been also compared as average from measurements over 11 stations and average over all model grids covering Baltic Sea basin. This comparison is shown in Fig. 5. For all stations there is a relatively good agreement between averaged observed and modelled deposition values over the entire period, but the correlation is not so good, mainly because of differences in modelled and observed precipitation amount for individual stations (not shown). This good agreement indicates that the most likely, additional reason for the differences in nitrogen deposition to the Baltic Sea basin calculated by the EMEP model and by the MATCH and ACDP models is related to different emission inventories used for the calculations. Both nitrogen and sulphur emissions were slightly lower in the EMEP calculations after latest revisions in 2010. However, different meteorology still remains an important factor for the differences.
0 10 20 30 40 50 60 70 80 90 100
1995 1996 1997 1998 1999 2000 2001 2002 2003 2004 2005 2006
Year
D
epo
si
ti
on Oxidised dry
Oxidised wet Reduced dry Reduced wet
–
Fig. 7. Calculated annual deposition to the Baltic Sea basin of: oxidized dry, oxidised wet, reduced dry and reduced wet nitrogen in the period 1995–2006. Units: Gg N per year.
3.2 Modelled annual deposition
The calculated annual oxidised and reduced nitrogen depo-sition fields for the year 2006 are shown in Fig. 6. The spa-tial distribution patterns of these deposition fields are sim-ilar for all years of the considered period and therefore we present only examples for the year 2006. A clear south-north gradient can be noticed for both fields, however the gradi-ent appears more steep for reduced nitrogen deposition. The ranges of annual 2006 deposition to the Baltic Sea basin are: 82–666 mg N m−2yr−1and 49–1334 mg N m−2yr−1, for
ox-idised and reduced nitrogen, respectively. Maxima of the de-position are located close to the German coastal line, whereas minima are located in the Northern part of the Baltic Sea.
Time series of oxidised dry, oxidised wet, reduced dry and reduced wet deposition to the Baltic Sea basin in the period 1995–2006 are presented in Fig. 7. For all years of the con-sidered period, wet deposition of nitrogen is larger than dry deposition, accounting for 63–70 % of total deposition. The patterns and values of oxidised wet and reduced wet depo-sition are very similar and remain close to each other. Con-tributions of oxidised dry and reduced dry deposition to to-tal deposition are lower, with toto-tal dry deposition accounting for 30–37 % of total nitrogen deposition in the considered period. There is also slightly (2–8 %) more oxidised than reduced deposition for all the years. The level of annual to-tal nitrogen deposition into the Baltic Sea basin has changed from 230 Gg in 1995 to 199 Gg in 2006. Maximum of total nitrogen deposition in the considered period can be noticed in the year 2000 (250 Gg N), whereas minimum can be seen in the year 2002 (184 Gg N). All types of computed depo-sition are lower in the year 2006 than in the year 1995 with total nitrogen deposition decreasing 13 % in 2006. This value corresponds well with the total nitrogen emission reduction (11 %) in the same period, in the HELCOM Contracting Par-ties.
The examination of data behind Fig. 7 shows that the reduction in modelled wet deposition in the period 2001– 2006 compared to period 1995–2000 is 13 %. Similar re-duction is present in the measured deposition for the stations
70 80 90 100 110 120 130
1995 1996 1997 1998 1999 2000 2001 2002 2003 2004 2005 2006
Year
%
of
1
99
5
va
lue
Precipitation Wet deposition
Fig. 8. Comparison of relative annual wet deposition and relative annual precipitation in the period 1995–2006. Units: Percent of 1995 annual value.
70 75 80 85 90 95 100 105 110
1995 1996 1997 1998 1999 2000 2001 2002 2003 2004 2005 2006
Year
%
of
1
99
5
va
lue
Emission
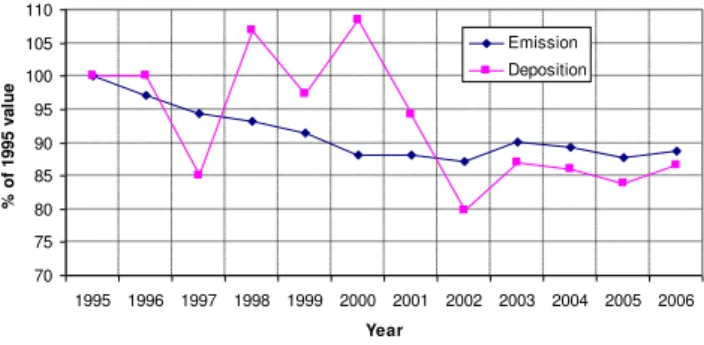
Deposition
Fig. 9. Comparison of relative annual deposition of total nitrogen into the Baltic Sea basin and relative annual emissions of total (ni-trogen oxides + ammonia) ni(ni-trogen from the HELCOM Contracting Parties in the period 1995–2006. Units: percent of 1995 value.
in Fig. 5. Except for two stations DK05-Keldsnor and PL04-Leba, there is a clear reduction for measured wet deposition in the period 2001–2006 – on average 10 %. This value is quite similar and only slightly lower than predicted by the model calculations.
0 2 4 6 8 10 12 14 16 18
1995 1996 1997 1998 1999 2000 2001 2002 2003 2004 2005 2006
Year
D
epo
si
ti
on
(
G
g
N
)
Oxidised dry
Oxidised wet Reduced dry
Reduced wet
–
Fig. 10.Monthly deposition of oxidised dry, oxidised wet, reduced dry and reduced wet nitrogen to the Baltic Sea basin in the period 1995–2006.
oxides and annual deposition of oxidised nitrogen in the pe-riod 1995–2006 is equal to 0.70. These results indicate that the inter-annual variation of dry deposition is mainly forced by the changes in nitrogen emissions, whereas meteorol-ogy and mainly precipitation are responsible for inter-annual variation of wet deposition.
Comparison of relative annual total nitrogen emissions in HELCOM Contracting Parties and annual total nitrogen de-position is shown in Fig. 9. In this Figure, annual total ni-trogen emission is the sum of nini-trogen dioxide and ammonia emissions and relative mean percent of annual 1995 values. Emission pattern in Fig. 9 is relatively smooth, whereas large differences can be noticed in annual deposition especially in the period 1996–2002 with a sudden drop (28 %) between the years 2000 and 2002. This sudden drop is mostly caused by the drop in modelled precipitation from years 2001 to 2002. Similar drop (18 %), but from year 2001 to 2003 is also vis-ible in the measured precipitation data shown in Fig. 5. Fig-ure 9, as well as Fig. 6 and 7 prove again that inter-annual variation of meteorological conditions and especially precip-itation has a strong influence on annual deposition of nitro-gen. One important implication from the decision point of view is the possibility of increased deposition of nitrogen af-ter the reduction of nitrogen emission. For example, total nitrogen emission shown in Fig. 9 decreased 1.7 % between 1997 and 1998, whereas total nitrogen deposition increased 25 % from 1997 to 1998 (both in % of 1995 value). There-fore, in order to evaluate and see the effects of nitrogen emis-sion reduction, it is necessary to use a longer period than one or two years. Figure 9 indicates that the evaluation period should not be shorter than five years.
3.3 Monthly deposition
Calculated monthly deposition of oxidised dry, oxidised wet, reduced dry and reduced wet nitrogen to the Baltic Sea basin in the period 1995–2006 are shown in Fig. 10. As in the case of annual deposition, monthly wet deposition of oxi-dised and reduced nitrogen is also higher than corresponding dry deposition. In addition, patterns of monthly oxidised wet
0 5 10 15 20 25 30 35 40 45 50
J F M A M J J A S O N D
Month
D
ry
de
po
si
ti
on
(
G
g
N
)
Minimum Average Maximum
0 5 10 15 20 25 30 35 40 45 50
J F M A M J J A S O N D
Month
W
et
de
po
si
ti
on
(
G
g
N
)
Minimum Average Maximum
0 5 10 15 20 25 30 35 40 45 50
J F M A M J J A S O N D
Month
To
ta
l
de
po
si
ti
on
(
G
g
N
)
Maximum
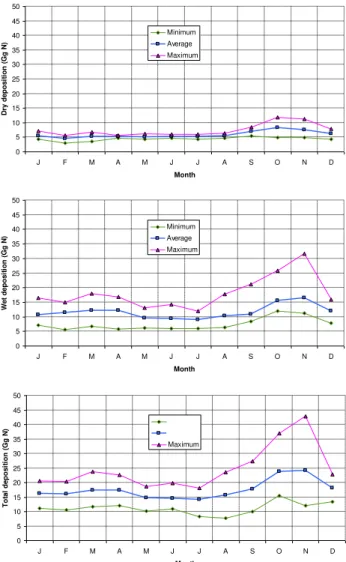
– Fig. 11. Monthly minimum, maximum and monthly average (over 12 yr) deposition of dry, wet and total nitrogen to the Baltic Sea basin in the period 1995–2006.
and monthly reduced wet deposition are very similar and rel-atively well correlated with correlation coefficient equal to 0.65. The minima of monthly deposition in the considered period are similar, slightly above 1 Gg N, however they oc-cur in different years. The maxima of monthly oxidised wet (16.9 Gg N) and reduced wet (14.8 Gg) deposition occurred in the same month and year – October 2000. The maxima of monthly oxidised dry (6.7 Gg N) and reduced dry (6.2 Gg N) deposition also occur in the same month – October, but in different years: in 1995 for oxidised dry and in 2000 for re-duced dry deposition.
0 10 20 30 40 50 60 70 80
1995 1996 1997 1998 1999 2000 2001 2002 2003 2004 2005 2006
Year
D
epo
si
ti
on
(
G
g
pe
r
ye
ar
)
Oxidised dry Oxidised wet Reduced dry
Reduced wet
–
Fig. 12. Annual deposition to the Baltic Sea basin of oxidised dry, oxidised wet, reduced dry and reduced wet nitrogen in the period 1995–2006, calculated with constant emissions from 2006 and vari-able meteorology for all years.
because conditions related to high air concentrations (low wind speed, suppressed turbulence) do not favour large de-position velocities. Most of the maxima in Fig. 10 can be noticed for the autumn months, October and November, both for wet and dry deposition.
In order to detect the seasonal change of monthly dry, wet and total nitrogen deposition, we have calculated minimum, maximum and average value for each month of the period 1995–2006. The results are shown in Fig. 11. October and November are the months with the maximum of monthly dry, wet and total deposition, whereas summer months June and July are those with minimum of monthly wet and total depo-sition for the considered period. The minimum of monthly dry deposition occurs in February. The values of monthly wet and total deposition are also slightly higher in the spring months of March and April.
The correlation of wind speed and precipitation on a sea-sonal basis can be noticed in Fig. 11. For the autumn months October and November when the strong storms on the Baltic Sea are most frequent and surface wind speed reaches the seasonal maximum. For these two months, the highest val-ues are visible in monthly dry, wet and total deposition. 3.4 The effects of meteorological variability on the
deposition
Meteorological variability plays an important role in deter-mining the transport distance and life time of the pollutants. A key question is to what extent different meteorological conditions influence the main characteristics of transport and pollutant exchange. In order to study the impact of meteo-rology in detail, we have made model simulations with con-stant emissions of 2006, but with varying meteorology for the years 1995–2006. Such an experiment gives more insight into the importance of meteorology in transporting pollutants and also into their atmospheric chemistry and removal rates from the atmosphere.
70 80 90 100 110 120 130
1995 1996 1997 1998 1999 2000 2001 2002 2003 2004 2005 2006
Year
D
ry
d
ep
o
si
ti
o
n
70 80 90 100 110 120 130
1995 1996 1997 1998 1999 2000 2001 2002 2003 2004 2005 2006
Year
W
et
d
ep
o
si
ti
o
n
70 80 90 100 110 120 130
1995 1996 1997 1998 1999 2000 2001 2002 2003 2004 2005 2006
Year
Fig. 13. Annual deposition of dry, wet and total nitrogen to the Baltic Sea basin for each year of the period 1995–2006 in % of the average value over the entire period. Results of the model run with constant emissions from 2006 and variable meteorology.
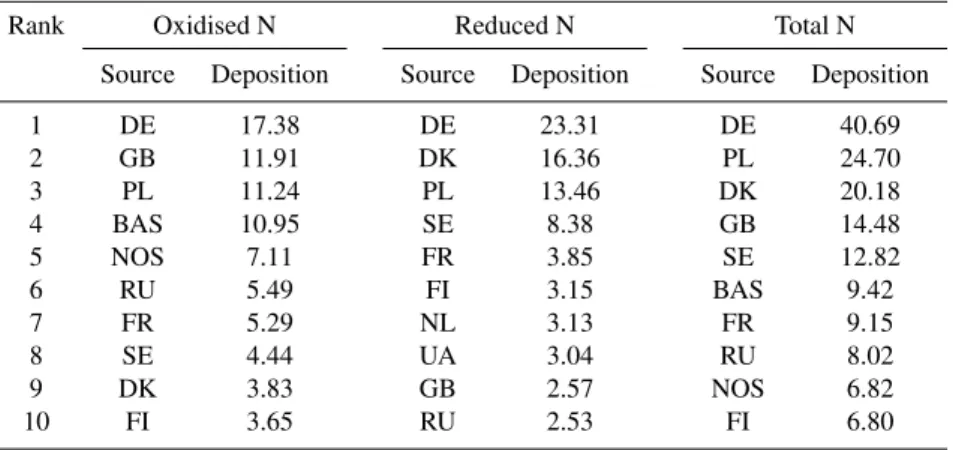
Table 3. Top ten contributors to annual oxidised, reduced and total nitrogen deposition to the Baltic Sea basin averaged over the period 1997–2006. Units: Gg N per year. Source codes: DE – Germany, PL – Poland, DK – Denmark, GB – United Kingdom, SE – Sweden, BAS – international ship traffic on the Baltic Sea, FR – France, RU – Russian Federation, NOS – international ship traffic on the North Sea, FI -Finland, NL – The Netherlands.
Rank Oxidised N Reduced N Total N
Source Deposition Source Deposition Source Deposition
1 DE 17.38 DE 23.31 DE 40.69
2 GB 11.91 DK 16.36 PL 24.70
3 PL 11.24 PL 13.46 DK 20.18
4 BAS 10.95 SE 8.38 GB 14.48
5 NOS 7.11 FR 3.85 SE 12.82
6 RU 5.49 FI 3.15 BAS 9.42
7 FR 5.29 NL 3.13 FR 9.15
8 SE 4.44 UA 3.04 RU 8.02
9 DK 3.83 GB 2.57 NOS 6.82
10 FI 3.65 RU 2.53 FI 6.80
the maximum of precipitation in the year 1998 (791 mm). In this case, other than precipitation, meteorological factors like annual patterns of wind direction, mixing height and temper-ature play an important role in the deposition. A relatively large contribution of Germany to total nitrogen deposition into the Baltic Sea basin in the year 1999 and 2000 suggests that the atmospheric transport from the regions with high ni-trogen emissions can be also responsible for the deposition maximum in the same year.
The time series of relative deposition of dry, wet and total nitrogen to the Baltic Sea basin is shown in Fig. 13 for the period 1995–2006 and model run with 2006 emissions and variable meteorology. The relative deposition is presented in % of the average value for the entire period. The range of inter-annual variability in total deposition is significantly changing from 87 % to 117 % of the average value. There is more variability in wet deposition, with the range 83–121 % of average than in dry deposition with the range 92–110 % of average. However minimum and maximum of both wet and dry deposition occurs in the same years, 1997 and 2000, re-spectively, resulting in clear minimum and maximum of the total deposition in the same years. The influence of variable meteorological conditions is especially visible for the period 1997–2002. The difference between maximum and mini-mum of annual total deposition is 30 % and caused mainly by large differences in wet nitrogen deposition. The inter-annual variability estimated with the EMEP Unified model is much higher than the one calculated with the MATCH model 5.1–8 % (Langner et al. 2009). However, these calculations have been performed for different periods and this can be the reason.
The coefficient of variation of nitrogen deposition, from the model run with constant 2006 emissions, has been cal-culated for each grid square of the Baltic Sea basin and ex-pressed in % of average deposition for the period 1995-2006.
The results for total deposition are shown in Fig. 14. The ranges of the coefficient of variation in the Baltic Sea basin for oxidised dry, oxidised wet, reduced dry and reduced wet deposition are 3–19 %, 6–23 %, 3–23 % and 7–30 %, respec-tively. The coefficient of variation of total nitrogen deposi-tion is in similar range 4–21 %. The range of the coefficient of variation for precipitation is also similar, but the minimum value is higher compared to deposition: 11–23 %.
4 Source allocation of nitrogen deposition
Air concentrations and wet deposition of nitrogen com-pounds in the Baltic Sea region can be estimated both from measurements and from the model calculations. However, the information about the main emission sources contribut-ing to nitrogen deposition into the Baltic Sea basin can be obtained only from the results of the model run. Therefore, the calculation of source-receptor relationships is one of the most important tasks for the EMEP Unified model.
The source allocation budget for the Baltic Sea basin has been calculated for the 10-yr period: 1997–2006, following the needs of the Baltic Sea Action Plan (HELCOM, 2010). The results of these calculations as a list of top ten contribu-tors to annual oxidised, reduced and total nitrogen deposition to the Baltic Sea basin, averaged over the period 1997–2006 are shown in Table 3.
–
Fig. 14.Map of coefficient of variation (over the period 1995–2006) of total nitrogen deposition to the Baltic Sea basin. Deposition is calculated with constant emissions from 2006 and variable meteo-rology for all years. Coefficient of variation is expressed in % of average deposition for each model grid square.
16 %, 11 % and 10 %, respectively. The joint emissions from HELCOM Contracting parties and ship emissions from the Baltic Sea contribute 54 % to oxidised nitrogen deposition.
The role of distant sources is not so large, but also visible in case of reduced nitrogen deposition, with France being the fifth largest contributor with 4 % of the total reduced nitrogen deposition. Germany is again the largest contributor with the whole 24 % followed by Denmark (17 %) and Poland (14 %). The sum of all sources from the HELCOM Contracting Par-ties, contribute 64 % to reduced nitrogen deposition.
The contribution of Germany to total nitrogen deposition (20 %) is almost twice as high as number two on the list Poland (12 %) and number three Denmark (10 %). There is also a substantial contribution, 7 %, of one distant source – United Kingdom to total annual average nitrogen deposition to the Baltic Sea basin. The contribution of all sources from HELCOM Contracting Parties and ship emissions from the Baltic Sea to total nitrogen deposition is 54 %.
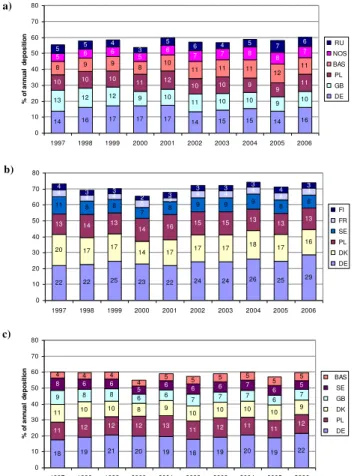
The contribution of main sources to annual nitrogen de-position for each year of the period 1997–2006 is relatively stable (Fig. 15). Germany dominates the picture with 14– 17 %, 22–29 % and 18–22 % contribution to oxidised, re-duced and total nitrogen, respectively. There is a tendency of slightly increasing German contribution with time, espe-cially for reduced nitrogen deposition from 14 % in 1997 to 29 % in 2006. There is also a systematic increase of contri-bution to oxidised nitrogen deposition from the international
a)
14 16 17 17 17
14 15 15 14 16
13 12 12 9 10 11 10 10 9 10
10 10 10
11 12 10 10 9
9 11
8 9 9 8 10 11 11 11
12 11
5 6 6 5
6
7 7 8
8 7
5 5 4 3
5
6 4 5
7 6 0 10 20 30 40 50 60 70 80
1997 1998 1999 2000 2001 2002 2003 2004 2005 2006
% o f a n n u a l d e p o s iti o n RU NOS BAS PL GB DE b)
22 22 25 23 22 24 24 26 25 29
20 17 17 14 17 17 17
18 17 16
13 14 13
14 16
15 15 13 13 13
11 8 8
7 8
9 9 9 8 8
4
4 4
5 3
4 4 4 4 4
4
3 3
2 3
3 3 3 4 3
0 10 20 30 40 50 60 70 80
1997 1998 1999 2000 2001 2002 2003 2004 2005 2006
FI FR SE PL DK DE c)
18 19 21 20 19 18 19 20 19 22
11 12 12 12 13 11 12 11 11 12
11 10 10 8 9 10 10 10 10 9
9 8 8
6 6 7 7 7 6 7
8 6 6
5 6 6 6 7
6 5
4 4 4
4 5 5 5
5 5 5 0 10 20 30 40 50 60 70 80
1997 1998 1999 2000 2001 2002 2003 2004 2005 2006
% o f a n n u a l d e p o s iti o n BAS SE GB DK PL DE – – – – – – – – – –
Fig. 15. Time series of main contributions to annual deposition of nitrogen into the Baltic Sea basin in the period 1997–2006.
Contri-butions are in % of:(a)oxidised,(b)reduced and(c)total
deposi-tion. Source codes: DE – Germany, DK – Denmark, FI – Finland, FR – France, GB – United Kingdom, PL – Poland, RU – Russia, SE – Sweden, BAS – international ship traffic on the Baltic Sea, NOS – international ship traffic on the North Sea.
ship traffic on the Baltic Sea from 8 % in 1997 to 11 % in 2006. The second major contributor – Poland remains on similar level for all kind of the deposition. On the other hand, a certain decrease can be observed in the contributions from Denmark, Sweden and a distant source – United Kingdom. These reductions reflect, to a large extent, the reductions in nitrogen oxides and ammonia emissions, in the above men-tioned sources, in the period 1997–2006.
5 Conclusions
Atmospheric nitrogen deposition into the Baltic Sea basin has been calculated for the period of 12 yr: 1995–2006. The level of annual total nitrogen deposition into the Baltic Sea basin has changed from 230 Gg N in 1995 to 199 Gg N in 2006, decreasing 13 %. This value corresponds well with the total nitrogen emission reduction (11 %) in the HELCOM Contracting Parties. Wet deposition was higher than dry de-position (63–70 % of total dede-position) and oxidised deposi-tion was slightly higher than reduced deposideposi-tion (51–54 % of total). A clear south-north gradient can be noticed in cal-culated deposition fields of oxidised and reduced nitrogen (Fig. 6), reflecting similar gradients in the emission fields of nitrogen oxides and ammonia (Fig. 3). This similarity is also common for other years of the considered 12-yr period.
The calculated monthly nitrogen deposition for each month of the 1995–2006 period remain on similar level for most of the months during the year. Two exceptions are Oc-tober and November when maxima of monthly deposition can be noticed for the considered period.
In general, the changes in nitrogen deposition in the con-sidered period follow the changes in nitrogen emissions, es-pecially in the HELCOM Contracting Parties. However, inter-annual variation in annual deposition in the period 1995–2006 is large (79–108 % of 1995 value) compared to variation of annual nitrogen emissions (87–100 % of 1995 value). This fact can be explained by large inter-annual changes in meteorological conditions and especially in pre-cipitation (86–127 % of 1995 value). Analysis of annual ni-trogen emissions and deposition in the period 1995–2006 shows that in order to evaluate and see the effects of nitro-gen emission reduction, it is necessary to use a longer period than one or two years. Figure 9 indicates that the evaluation period should not be shorter than five years.
The model run with constant emissions from the year 2006 and variable meteorology in the period 1995–2005 shows that the differences between maximum and minimum deposi-tion of oxidised wet and reduced wet nitrogen are large, 35 % and 45 % respectively, of the average value for the entire pe-riod. The differences between maximum and minimum de-position of oxidised dry and reduced dry nitrogen are much lower 17 % and 24 %, respectively. These results confirm again that large inter-annual variability in computed nitrogen deposition is mainly caused by variable meteorological con-ditions and precipitation first of all.
The distribution of standard deviation of total nitrogen de-position over the Baltic Sea basin has been used as a mea-sure of inter-annual variability. A clear south-north gradient can be noticed in this distribution with minima located in the south, where the maxima of average deposition can be found and maxima of the standard deviation in the Northern part of the Baltic Sea basin close to minima of the average deposi-tion. In the places where the deposition is low the influence of the transport pattern is much higher than in the places with relatively high levels of the deposition.
The results presented here suggest that in order to improve accuracy of computed deposition and source allocation bud-get, not only accurate emission inventories are necessary, but meteorological data of good quality as well.
Germany is the number one contributor for all kinds of ni-trogen deposition, followed by Poland and Denmark among the HELCOM Contracting Parties. A significant role of long range transport and distant sources in contribution to oxi-dised nitrogen deposition is marked by United Kingdom in the second position and by presence of North Sea ship traffic and France on the list. The average, over the period 1997– 2006 contribution of Germany, Poland and Denmark to total nitrogen deposition into the Baltic Sea basin is 20 %, 12 % and 10 %, respectively. The contribution of main sources to annual nitrogen deposition is relatively stable. Contribu-tion of Germany is within the range 18–22 % with slightly increasing tendency. There is also a systematic increase of contribution from the international ship traffic on the Baltic Sea from 4 % in 1997 to 5 % in 2006. Contribution from Poland remains on, more or less, the same level mostly be-tween 11 and 12 % and range of contribution from Denmark is 8–11 %.
Acknowledgements. We thank our colleagues David Simpson,
´
Agnes Ny´ıri and Anna Benedictow from the EMEP Centre-West for discussions and help with emission and meteorological data necessary for the model runs. Wenche Aas from the Norwegian Institute for Air Research and Birthe Marie Steensen from the EMEP Centre-West helped us with measurement data necessary for comparison of model results with observations. We are also indebted to the referees for all corrections, comments and valuable
suggestions improving the final version of the paper. A large
part of the work presented here was supported by the HELCOM Convention. Finally, we acknowledge the financial support by the European Commission (NitroEurope-IP, project 017841), and by the EMEP project under UNECE.
Edited by: M. Sutton
References
Bartnicki, J., Gusev, A., Aas, W. and Valiyaveetil, S.: Atmo-spheric Supply of Nitrogen, Lead, Cadmium, Mercury and Dioxines/Furanes to the Baltic Sea in 2010, EMEP Centres Joint Report for HELCOM, EEMEP/MSC-W TECHNICAL RE-PORT 2/2008, Norwegian Meteorological Institute, Oslo, Nor-way, 2010.
Benedictow, A.: Documentation and verification of the 1999
PARLAM-PS meteorological fields used as input for Eulerian EMEP model, Technical report, Norwegian Meteorological In-stitute, Oslo, Norway, Research Note no. 111, 2003.
Bjørge, D. and Sk˚alin, R.: PARLAM – the parallel HIRLAM ver-sion at DNMI, Norwegian Meteorological Institute, Oslo, Nor-way, Research Report No. 27, ISSN 0332-9879, 1995.
CEIP Webpage, available online at: http://www.ceip.at/, last access: 10 December 2010.
EMEP Webpage, available online at: http://www.emep.int/, last ac-cess: 10 December 2010.
Fagerli, H. and Aas, W.: Trends of nitrogen in air and precipitation: Model results and observations at EMEP sites in Europe, 1980– 2003, Environ. Pollut., 154(3), 448–461, 2008.
Fagerli, H., Gauss, M., Benedictow, A., Griesfeller, J., Jonson, J. E.,
Ny´ıri, ´A., Schultz, M., Simpson, D., Stensen, B. E., Tsyro, S.,
Valdebenito, ´A., Wind, P., Aas, W., Hjellbrekke, A-G.,
Mareck-ova, K., Wankm¨uller, R., Iversen, T., Kirkev˚ag, A., Seland, Ø and Vieno, M.: Transboundary acidification, eutrophication and ground level ozone in Europe in 2009, EMEP Status Re-port 1/2011, Norwegian Meteorological Institute. Oslo, Norway, 2011.
HELCOM: Airborne nitrogen loads to the Baltic Sea. Helsinki Commission, Baltic Marine Environment Commission, HEL-COM Environmental Focal Point Information, 1–7, 2005a. HELCOM: Atmospheric supply of nitrogen, lead, cadmium,
mer-cury and lindane to the Baltic Sea over the period 1996–2000, Balt. Sea Environ. Proc., No. 101, 1–75, 2005b.
HELCOM. Eutrophication in the Baltic Sea - An integrated the-matic assessment of the effects of nutrient enrichment and eu-trophication in the Baltic Sea region. Balt. Sea Environ. Proc., 115B, 1–152, 2009.
HELCOM Webpage, available online at: http://www.helcom.fi/, last access: 10 December 2010.
Hertel O., Ambelas Skjøth C., Brandt J., Christensen, J. H., Frohn, L. M., and Frydendall, J.. Operational mapping of atmospheric nitrogen deposition to the Baltic Sea, Atmos. Chem. Phys., 3, 2083–2099, doi:10.5194/acp-3-2083-2003, 2003.
Langner, J., Andersson, C., and Engardt, M.: Atmospheric input of nitrogen to the Baltic Sea basin: present situation, variability due to meteorology and impact of climate change, Boreal Env. Res., 14, 226–237, 2009.
Rolff, C., Elmgren, R., and Voss, M.: Deposition of
nitro-gen and phosphorus on the Baltic Sea: seasonal patterns and nitrogen isotope composition, Biogeosciences, 5, 1657–1667, doi:10.5194/bg-5-1657-2008, 2008.
Semeena, V. S., Ny´ıri, ´A., Valdebenito, A., Simpson, D., and
Fagerli, H.: Trends in source allocation of pollutants, Trans-boundary acidification, eutrophication and ground level ozone in Europe in 2007, EMEP Status Report 1/2009, Norwegian Mete-orological Institute, Oslo, Norway, 47–63, 2009.
Simpson, D., Fagerli, H., Hellsten, S., Knulst, J. C., and Westling, O.: Comparison of modelled and monitored deposition fluxes of sulphur and nitrogen to ICP-forest sites in Europe, Biogeo-sciences, 3, 337–355, doi:10.5194/bg-3-337-2006, 2006a. Simpson, D., Butterbach-Bahl, K., Fagerli, H., Kesik, M., Skiba,
U., and Tang, S.: Deposition and emissions of reactive nitrogen over European forests: A modelling study, Atmos. Environ., 40, 5712–5726, 2006b.
Und´en, P., Rontu, L., J¨arvinen, H., Lynch, P., Calvo, J., Cats, G., Cuaxart, J., Eerola, K., Fortelius, C., Garcia-Moya, J.A., Jones, C., Lenderlink, G., Mc-Donald, A., McGrath, R., Navascues, B., Nielsen, N.W., Ødegaard, V., Rodriguez,E., Rummukainen, M., R¨o¨om, R., Sattler, K., Sass, B.H., Savij¨arvi, H., Schreur, B. W., Sigg, R., The, H., and Tijm, A.: HIRLAM-5 Scientific Docu-mentation, HIRLAM-5 Project. Available from SMHI, 601767 Norrk¨oping, Sweden, 2002.
Vestreng, V.: Inventory review. Emission data reported to CLRTAP. MSC-W Status Report 2003, EMEP/MSC-W Note 1/2003, Nor-wegian Meteorological Institute, Oslo, Norway, 2003.