www.atmos-chem-phys.net/12/2615/2012/ doi:10.5194/acp-12-2615-2012
© Author(s) 2012. CC Attribution 3.0 License.
Chemistry
and Physics
Projected change in atmospheric nitrogen deposition to the Baltic
Sea towards 2020
C. Geels1, K. M. Hansen1, J. H. Christensen1, C. Ambelas Skjøth1,2, T. Ellermann1, G. B. Hedegaard1,3, O. Hertel1,4, L. M. Frohn1, A. Gross1, and J. Brandt1
1Department of Environmental Science, Aarhus University, Roskilde, Denmark 2Faculty of Science, Lund University, Sweden
3Danish Climate Center, Danish Meteorological Institute, Copenhagen, Denmark
4Department for Environmental, Social and Spatial Change, Roskilde University, Denmark
Correspondence to:K. M. Hansen ([email protected]), C. Geels ([email protected]) Received: 23 June 2011 – Published in Atmos. Chem. Phys. Discuss.: 28 July 2011 Revised: 30 January 2012 – Accepted: 31 January 2012 – Published: 8 March 2012
Abstract. The ecological status of the Baltic Sea has for many years been affected by the high input of both water-borne and airwater-borne nutrients. The focus here is on the air-borne input of nitrogen (N) and the projected changes in this input, assuming the new National Emission Ceilings direc-tive (NEC-II), currently under negotiation in the EU, is ful-filled towards the year 2020. With a set of scenario sim-ulations, the Danish Eulerian Hemispheric Model (DEHM) has been used to estimate the development in nitrogen de-position based on present day meteorology combined with present day (2007) or future (2020) anthropogenic emis-sions. Applying a so-called tagging method in the DEHM model, the contribution from ship traffic and from each of the nine countries with coastlines to the Baltic Sea has been assessed. The annual deposition to the Baltic Sea is esti-mated to 203 k tonnes N for the present day scenario (2007) and 165 k tonnes N in the 2020 scenario, giving a projected reduction of 38 k tonnes N in the annual load in 2020. This equals a decline in nitrogen deposition of 19 %. The results from 20 model runs using the tagging method show that of the total nitrogen deposition in 2007, 52 % came from emis-sions within the bordering countries. By 2020, this is pro-jected to decrease to 48 %. For some countries the propro-jected decrease in nitrogen deposition arising from the implemen-tation of the NEC-II directive will contribute significantly to compliance with the reductions agreed on in the provisional reduction targets of the Baltic Sea Action Plan. This under-lines the importance of including projections like the current in future updates of the Baltic Sea Action Plan.
1 Introduction
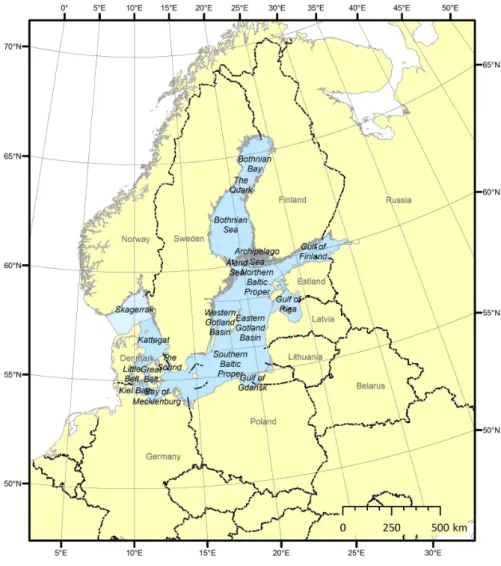
The atmosphere is an important pathway for transport of nu-trients to the marine areas (see Krishnamurthy et al. (2010) and references therein) as well as for inner waters like e.g. the Kattegat Sea (Spokes et al., 2006) and the Baltic Sea (HEL-COM, 2005). For the Baltic Sea, about 25 % of the total reac-tive nitrogen load is deposited directly from the atmosphere (HELCOM, 2005). The Baltic Sea is an enclosed sea area where the total input of nutrients including nitrogen has been high for many years and most parts of the Baltic Sea are af-fected by this nutrient enrichment and the related eutrophica-tion problems (Andersen et al., 2011). In order to re-establish good ecological status of the Baltic marine environment, the countries around the Baltic Sea have adopted the HELCOM Baltic Sea Action Plan (BSAP) (see http://www.helcom.fi/ BSAP/ActionPlan/en GB/ActionPlan/). HELCOM has set up a set of objectives associated with good ecological sta-tus: concentrations of nutrients close to natural levels; clear water; natural levels of algal blooms; natural distribution and occurrence of plants and animals; and natural oxygen lev-els (Andersen et al., 2011). The countries in the Baltic Sea catchment area have agreed to take actions no later than 2016 to reduce the nutrient load from waterborne and airborne in-puts. The aim is a good ecological status of the Baltic Sea in 2021 by following agreed country-wise reductions. An overview map of the region is seen in Fig. 1.
Fig. 1.Overview map of the Baltic Sea and the surrounding countries.
in the European Union (e.g. the National Emission Ceil-ings directive (NEC-I and II) and The Clean Air for Europe (CAFE) programme). Anthropogenic activities like agricul-ture, traffic and energy production lead to emissions of nitro-gen oxides (NOx)and ammonia (NH3)into the atmosphere
(Bouwman et al., 1997). Within the atmosphere these ni-trogen compounds are transported and/or chemically trans-formed before they are removed again by dry or wet depo-sition. The residence time in the atmosphere differs among the different nitrogen components and also depends on the availability of other chemical substances in the atmosphere (Seinfeld and Pandis, 2006).
NOxare emitted as nitrogen monoxide (NO) and nitrogen
dioxide (NO2)from combustion processes related to energy
production, industry and traffic and constitute in total about 60 % of the reactive nitrogen compounds emitted to the at-mosphere (Hertel et al., 2006). Over land NO2 deposit to
vegetation, but this removal is relatively small (Hertel et al., 2006). Also, the possibility of foliage emissions at low
atmo-spheric concentrations has been discussed (Chaparro-Suarez et al., 2011; Lerdau et al., 2000). The main removal path of NOxis the conversion of NO2to nitric acid (HNO3)that
takes place at approximately 5 % per hour, giving NOxa
life-time of about 24 hours in the atmosphere. HNO3 stick to
any surface and may therefore either deposit or be converted to aerosol phase nitrate (NO−3). Nitrate containing aerosols have a long lifetime in the atmosphere – up to 7 to 10 days when the air mass does not meet a rain event (Hov et al., 1994; Hov and Hjollo, 1994). NH3plays a significant role
in eutrophication of ecosystems (Sutton et al., 2009) and has a relatively high dry deposition velocity to both dry and wet surfaces. The deposition of atmospheric NH3may therefore
totally dominate the overall load of reactive nitrogen from the atmosphere (Hertel et al., 2006). NH3is also efficiently
incorporated into acidic aerosols, forming secondary atmo-spheric components containing ammonium (NH+4). Com-ponents like ammonium bisulphate (NH4HSO4), ammonium
quickly incorporated into aerosols (Hertel et al., 2006; Skjøth et al., 2004). The main removal path from the atmosphere of the nitrogen containing aerosols is through wet deposi-tion (Karthikeyan et al., 2009). High NH3 emissions are
found in or near the Baltic Sea catchment area due to inten-sive agricultural activities in Central and Northern Europe (see the emissions reported to the European Monitoring and Evaluation Programme (EMEP): http://www.emep.int/). As such, NOx and NH3 or the reaction products can either be
deposited near the emission source or be transported up to more than 1000 km before wet deposition takes place (Her-tel et al., 2006; Hov et al., 1994). All in all, this means that a comprehensive budget of atmospheric nitrogen depositions to the Baltic Sea must include at least the following four com-ponents: (1) a very large geographical area, (2) high quality emission inventories including future projections, (3) chemi-cal transformation, and (4) removal processes.
Projected budgets of nitrogen depositions are most effi-ciently studied using state-of-the-art atmospheric chemistry transport models (CTM). Previous CTM studies have mainly focused on specific years, previous trends as well as meteo-rological and climatological factors influencing the nitrogen deposition to the Baltic Sea (Bartnicki et al., 2011; Hertel et al., 2003; Hongisto and Joffre, 2005; Langner et al., 2009), while future emission scenarios have not been included, al-though initiatives such as the Baltic Sea Action Plan will ben-efit from such knowledge.
The aim of this study is to investigate the changes in nitro-gen deposition if the new National Emission Ceilings (NEC-II) directive for 2020 is adopted. We use the results from the Danish Eulerian Hemispheric Model (DEHM) to assess changes in nitrogen deposition to the Baltic Sea, compar-ing the present-day (2007) deposition estimate with that for 2020. A series of model simulations have been conducted to calculate total deposition, but also to assess the contribu-tion from each of the nine countries surrounding the Baltic Sea as well as from ship traffic. Focus is on the total an-nual nitrogen deposition to the Baltic Sea, future changes due to changed atmospheric emissions and the contribution from the surrounding countries. These projections can be com-pared to the country-wise reduction requirements included in the HELCOM Baltic Sea Action Plan. The calculated nitro-gen depositions are estimated for the main basins and sub-basins in the Baltic Sea to assess the spatial differences in the resulting deposition changes. These results are included in the Supplement and will be further analysed in a following paper (Frohn et al., 2012).
2 Methodology
A general description of the applied CTM is given in the following. We have validated a 20-yr simulation of the model with focus on the nitrogen deposition. As described in Sect. 2.2, the results of the validation indicate that the model reproduces measured nitrogen deposition reasonably well. We can therefore apply the model for scenario stud-ies with good confidence. Thereafter we describe the set of scenario simulations we have performed to investigate the changes in nitrogen deposition if the NEC-II directive for 2020 is adopted as well as the meteorological data and emis-sions applied for these scenario simulations.
2.1 The applied model system
The Danish Eulerian Hemispheric Model (DEHM) is a state-of-the-art off-line CTM covering the Northern Hemisphere using a polar stereographic projection with a resolution of 150 km×150 km, true at 60◦N (Brandt et al., 2012; Chris-tensen, 1997). A two-way nesting capability allows for a higher resolution over targeted regions (Frohn et al., 2002) like, for example, Europe (resolution of 50 km×50 km), which is applied in the current study. For other applica-tions, higher resolution is used over Northern Europe (res-olution of 16.7 km×16.7 km) and Denmark (resolution of 5.6 km×5.6 km). In the vertical the DEHM model follows the resolution of the applied meteorological fields (see be-low). The vertical grid is defined using the σ-coordinate system, with 29 vertical layers extending up to a height of 100 hPa. Highest resolution is defined closest to the ground, e.g. in order to have a good description of vertical dispersion close to source areas. The lowest model layer is approxi-mately 25 m thick.
The model describes concentration fields of 58 chemical compounds and 9 classes of particulate matter (PM2.5(mass
of particles with a diameter less than 2.5 µm), PM10 (mass
of particles with a diameter less than 10 µm), total suspended particulate matter (TSP), sea-salt>2.5 µm, fresh black car-bon, aged black carcar-bon, and organic carbon) and includes in total 122 chemical reactions. Primary emitted pollutants are NH3, NOx, sulphur dioxide (SO2), carbon monoxide
(CO), methane (CH4), volatile organic compounds (VOC),
PM2.5, PM10 and TSP. The applied emission inventories are
described in Sect. 2.3.2.
Wet deposition includes in-cloud and below-cloud scav-enging and is calculated as the product of scavscav-enging coeffi-cients and the concentration.
use information for Denmark is taken from the AIS database (Area Information System) and for the rest of the world it is based on the Olson World Ecosystem Classes v1.4D (Olson, 1992).
For deposition of gases to vegetative surfaces, the surface conductance (the reciprocal of the resistance) is composed of two parts; the stomatal conductance and the non-stomatal conductance. They are calculated based on, e.g. radiation, temperature and vapour pressure deficit, all obtained from the meteorological model (for further detail see Simpson et al., 2003). In the case of dry deposition of gases on wa-ter surfaces, the deposition depends on the solubility of the chemical specie and the wind speed (Hertel et al., 1995).
For the particles, dry deposition velocities are calculated assuming a particle diameter of 1 µm for most of them (ex-cept for a coarse fraction of NO−3 and sea salt). A density of 1800 kg m−3is used for all particles. For particles the
sur-face resistance is assumed to be zero and a gravitational set-tling velocity is included. The other terms in the resistance method are the same as for gases. In case of dry surfaces, it is included that a certain fraction of large particles (with a diameter larger than 2 µm) will bounce off. At water sur-faces the laminar boundary layer resistance includes a sim-ple parameterisation reflecting the influence of sea-spray as a function of wind speed (Simpson et al., 2003).
The required meteorological input to DEHM is obtained from the numerical weather prediction model MM5 (Grell et al., 1995) that is set up with the same domains and resolu-tions as the DEHM model. See Brandt et al. (2012) for more details on the setup.
The applied chemistry and dry deposition module have through the years been updated with the purpose of improv-ing the calculations of nitrogen deposition to especially the Danish sea and land areas. The DEHM model is also ap-plied within AMAP (Arctic Monitoring and Assessment Pro-gramme) to quantify transport of air pollution to the Arctic (Christensen et al., 2004; Forsius et al., 2010; Hole et al., 2009) and is one of the models included in the THOR inte-grated model system (Brandt et al., 2001, 2003) for forecast-ing of air pollution from European scale over urban back-ground scale down to urban street scale. The DEHM model has furthermore been used for carbon dioxide (CO2)
stud-ies (Geels et al., 2004, 2007) and studstud-ies of persistent or-ganic pollutants and emerging contaminants (Genualdi et al., 2011; Hansen et al., 2008; McLachlan et al., 2010). It has also been used in climate mode, where the model is driven by data from a climate model to estimate the impacts of cli-mate change on future air pollution levels (Hedegaard et al., 2008, 2011; Langner et al., 2012).
To apply the DEHM model to estimate the contribution to the total air pollution from a specific source type (e.g. ship traffic) or a specific country, a so-called tagging method has been implemented in the model (Brandt et al., 2011). When applying the tagging procedure in DEHM, the contribution
to the concentrations related to the specific source (the tag) and the contribution to the concentrations evolving from all other sources (the background) are calculated separately, but simultaneously in the same model run. For all the linear pro-cesses in the model (emissions, advection, diffusion, and wet and dry deposition), this procedure is straightforward. The concentration fields evolving from the tagged emissions and all other emissions are calculated separately and they can be summed to form the total concentration fields from all emis-sions. For the non-linear process, chemistry, the two fields cannot just be added. When performing a time-step in the chemistry module, the tagged concentration fields are esti-mated by first adding the background and tag concentration fields, then applying the non-linear operator (the chemistry). The concentration field obtained by applying the non-linear operator to the background field alone is then subtracted, and the result is the change in concentrations due to chemical re-actions from the tagged emissions. Thus, the contribution from the specific emission source (the tag) is accounted for appropriately without assuming linearity of the non-linear at-mospheric chemistry. Tagging methods have also been used in other recent CTM studies (Fisher et al., 2010; Wu et al., 2011), as the method gives a more accurate estimate of the contribution from the tagged emissions compared to the com-monly applied method, where two different model run are subtracted to obtain the signal (Brandt et al., 2012).
2.2 Validation and uncertainties
As part of the Danish monitoring programme NOVANA, DEHM has been run for a 20-yr period covering the years 1990–2009. Both meteorological input and emissions repre-sent the actual years in the period (except in 2009, where 2008 emissions are applied). This long-term series offers a sufficiently large data set for a general validation against measured nitrogen depositions. Air concentrations and wet depositions of nitrogen components have in the same period been measured at five locations in Denmark (Hertel et al., 2007). Measurements of dry deposition fluxes are very re-source demanding and are therefore not part of the routine monitoring programmes. The dry deposition fluxes are con-sequently calculated from dry deposition velocities obtained from the DEHM model and measured air concentrations of gas and particle phase nitrogen compounds. In Fig. 2 the measured and modelled annual nitrogen deposition is com-pared at the five sites. Two of the sites are located close to the coast on small islands and are considered to represent ma-rine conditions. Measurements from these sites are in part of the plot (defined in the legend) compared to the modelled deposition to marine surfaces at the same locations.
4 6 8 10 12 14 16 18 20
4 6 8 10 12 14 16 18 20
Calculated deposition, kg N/ha
M
e
a
s
u
re
d
d
e
p
o
s
it
io
n
,
k
g
N
/h
a
Deposition to w ater Deposition to land 1:1 line
Fig. 2. Measured and modelled annual nitrogen deposition at five monitoring sites in Denmark in the period 1990–2009 (Ellermann et al., 2010). Deposition to land is a mean over all five sites and calculated with a deposition velocity for the actual land surfaces. Deposition to water (blue squares) is a mean over two of the sites (located close to the coast) and calculated with a deposition velocity for water surfaces.
the average deposition to the same grid. The measurements sites are, on the other hand, located in background areas with some distance to local sources to avoid the direct impact of, e.g. agricultural activities. Hence, the measurements are an-ticipated to provide smaller deposition fluxes compared to the grid-average deposition flux, especially for those sites lo-cated within model grid cells including areas with intensive agriculture. For the marine conditions as represented at two sites, the calculated level of the deposition is in better agree-ment with the measured level. As a mean over the period the DEHM model underestimates the nitrogen deposition with approximately 10 % at the marine sites. This comparison indicates that the DEHM model is a valid tool for studies of nitrogen deposition to marine areas. In previous studies DEHM has also been validate against measured concentra-tions of, for example, the sum of NH3 and NH+4 (denoted
SNH) across the EMEP measuring sites in Europe and the model captures the overall measured patterns (Brandt et al., 2012; Geels et al., 2005; Pul et al., 2009).
Apart from the small general negative model bias at ma-rine sites seen from the validation in Fig. 2, additional uncer-tainties related to emissions and meteorological input vary-ing from year to year should be taken into account. The ap-plied projections of future emissions are based on assump-tions about future developments and are therefore associated with additional uncertainties.
As described in Sect. 2.1, dry deposition of gases and par-ticles is based on the resistance method, which is commonly used in CTMs applied for nitrogen assessments at the re-gional scale (Pul et al., 2009). In the resistance method it is assumed that the surface concentration of the chemical species is zero. For, e.g. NH3and NO2, this is not always the
case and a bi-directional flux can take place (Ganzeveld et al., 2002b; Hertel et al., 2006). For NH3, several
parameteri-zations of bi-directional fluxes over land exist, but they have so far mainly been used in field-scale NH3exchange models
(Massad et al., 2010). However, primarily due to the lack of sufficient input data, these parameterisations have not been widely used in regional CTMs (Massad et al., 2010; Zhang et al., 2010). In a recent study, a bi-directional flux model for NH3was included in a CTM covering the United States
(CMAQ), but so far it has only been evaluated through a sin-gle field study (Cooter et al., 2010). Bi-directional fluxes of other nitrogen components have also been included in a chemistry general circulation model for global simulations (Ganzeveld et al., 2002a). Including a bi-directional flux pa-rameterisation for ammonia will most likely lead to reduced dry deposition in source areas (Zhang et al., 2010). This may be an indication that we in the current study might be over-estimating the dry deposition of ammonia over agricultural areas. Also over the marine surface, bi-directional fluxes of NH3have been documented (Hertel et al., 2006) and the
in-clusion of such fluxes in a CTM can lead to a redistribution of the deposition in the coastal areas and hence in the gra-dients of nitrogen depositions over the sea (Sorensen et al., 2003).
The dry deposition of NO2 is, as previously mentioned,
a relatively slow process, and it is common to parameterise dry deposition over vegetation as a process where uptake take place through stomata (Hertel et al., 2006). The rapid conver-sion in the NO, O3and NO2system complicates the
interpre-tation of experimental flux studies of these compounds over, e.g. forests, but there are indications that also non-stomatal uptake may take place (Dorsey et al., 2004). An Ameri-can experimental study showed dry deposition velocities of about 0.2 cm s−1 over temperate deciduous forest (Horii et
al., 2004). They found a compensation point for NO2 of
about 1.5 nmol mol−1, and furthermore concluded that their
results contradict commonly applied dry deposition parame-terisations that overestimate stomatal uptake and do not allow surface uptake when stomata is closed. This is thus an area for further improvements of the model system.
2.3 Model setup in this study
The validation above showed that the DEHM model is able to reproduce the observed nitrogen depositions reasonably well. The model can therefore be used for scenario studies of nitrogen deposition to marine areas. In the following sec-tions we describe how a meteorological reference year has been chosen for the scenario simulations in the current study and give an overview of the emissions applied in the scenario simulations.
2.3.1 Meteorological reference year
Year-to-year variations in meteorological parameters like wind direction and speed as well as precipitation will impact the calculated nitrogen deposition to the Baltic Sea. Such short-term inter-annual fluctuations and anomalies could be avoided using a 30-yr period recommended as a climate nor-mal minima by World Meteorological Organisation (WMO) (WMO, 2007, 2010). However, due to the long computation time, this approach is not (yet) feasible in air pollution mod-elling. Alternatively, we have made a 10-yr model simulation with the same emissions applied for all years. In the valida-tion described in Sect. 2.2, both emissions and meteorology were changed each year, so the two simulations can not be directly compared.
Based on the 10-yr simulation, we have calculated the average nitrogen deposition to the Baltic Sea and analysed the variability in nitrogen deposition associated with the variability in meteorology alone. Finally, we identified the year where the nitrogen deposition to the Baltic is closest to the average for the full 10-yr simulation. The analysis also showed that, within the period 1995–2004, the deposi-tion varies by±17 % from year to year due to meteorology alone. The nitrogen deposition calculated with meteorology for 1998 is closest to the average for the period both for a ma-jority of the basins and sub-basins as well as for the whole Baltic Sea.
In this study we therefore apply 1998 as the deposition ref-erence year. It should be noted that 1998 does not necessarily reflect the average deposition from each of the studied coun-tries for this period. This induces an additional uncertainty in the estimates of the deposition from individual countries. In the scenario runs we combine the deposition reference year with emissions for 2007 and 2020. A direct validation with observed nitrogen depositions is therefore not feasible. In-stead we discuss the estimates in relation to related simula-tions carried out with other CTM models (see Sect. 4).
2.3.2 Anthropogenic emissions and projections
In order to include the most realistic emission input to the DEHM model, the available emission inventories covering the globe (Representative Concentration Pathways (RCP) database) and Europe (European Monitoring and Evaluation
Programme (EMEP) database) have been combined using the best available quality and resolution for the specific areas. Specific focus has been on obtaining the best possible emis-sion data set in the immediate vicinity of the Baltic Sea. In this context the detailed emission data set covering Denmark (Gyldenkærne et al., 2005; Skjøth et al., 2004) play an impor-tant role, especially due to the ammonia emissions from the extensive Danish agricultural activities that contribute signif-icantly to local depositions. Similar data have, however, not been available for the other countries in the region. Natural emissions of NOx from lightning and soil as well as
emis-sions of NH3 from soil/vegetation based on GEIA (Global
Emission Inventory Activity; Graedel et al., 1993) are also implemented in the model.
In this study the emissions for 2007 will represent “present-day” emissions. Emissions of primary pollutants are for the European part of the model domain obtained from the EMEP database with a 50 km×50 km resolution. For the hemispheric domain, emissions are taken from the RCP database with a 0.5◦×0.5◦resolution for historical data (Lamarque et al., 2010). Emissions from wildfires are in-cluded (Schultz et al., 2008), as well as ship emissions both around Denmark (Olesen et al., 2009) and for the rest of the domain (following EMEP and RCP). These gridded ship emissions cover international traffic that is not included in the national inventories.
For Denmark updated national NH3 and NOx emissions
are included with a spatial resolution of 1 km×1 km, and the temporal resolution of the Danish ammonia emissions is based on a dynamic parameterisation. This parameterisation account for physical processes like volatilization of NH3and
local agricultural production methods, including long-term changes in regulation such as seasonal timing and amount of applied manure and mineral fertilizer (Gyldenkærne et al., 2005; Skjøth et al., 2004, 2011).
For 2020, the applied emission inventory is based on various assumptions and proposed international agreements about emissions ceilings to be reached in 2020. The inven-tory for Europe is based on a combination of the EU thematic strategy for clean air in Europe and scenarios for the 27 EU countries made by IIASA (Amann et al., 2008) as part of the analysis towards a new directive on national emission ceil-ings (NEC-II). For the remaining European countries and the western Asian countries, the projected emissions are based on the estimates provided in the EU Clean Air For Europe (CAFE) programme. For the rest of the Northern Hemi-sphere, the emissions in 2020 are based on the RCP 3-PD projections (van Vuuren et al., 2007). Ship emissions from the area around Denmark are assumed to follow new regu-lations adopted by the International Maritime Organisation (IMO) and the same projections are used for the North Sea and the Baltic Sea (see Olesen et al., 2009).
In Table 1 the emissions of NOx, NH3and total nitrogen
Table 1.The applied emissions of NOx, NH3and total nitrogen for 2007 and 2020 given for Europe (emissions within the European model
domain), the countries with coastlines to the Baltic Sea (PBaltic C.) and from ship traffic in Europe.
NOx NH3 total N
1000 t N 1000 t N 1000 t N
Area 2007 2020 Change % 2007 2020 Change % 2007 2020 Change %
Europe∗ 5931 4264 −28 4715 4661 −1 10646 8925 −16
Denmark 51 27 −47 62 53 −13 112 80 −29
Estonia 11 5 −53 8 8 −1 18 13 −31
Finland 56 30 −45 29 23 −20 85 54 −37
Latvia 13 7 −47 13 9 −26 26 16 −36
Lithuania 21 9 −57 30 28 −7 51 37 −28
Poland 269 119 −56 240 220 −8 510 339 −33
Sweden 50 34 −33 41 27 −35 92 61 −34
Germany 391 217 −45 514 366 −29 905 583 −36
Russia 1068 951 −11 460 687 50 1527 1638 7
6Baltic C. 1929 1398 −28 1397 1422 2 3326 2820 −15
Ships 1016 1237 22 1016 1237 22
∗Change in emissions within the model domain covering Europe.
and for international ship traffic. For Europe (here defined as the model domain covering the majority of Europe, see Fig. 3), the emissions of NOxand NH3are projected to
de-crease by 28 % and 1 %, respectively, leading to a dede-crease of 16 % of the total nitrogen emission by 2020 compared to 2007.
The emission of NOxis projected to decrease in all of the
nine countries bordering the Baltic Sea. In the majority of the countries the decrease in emission from 2007 to 2020 is in the order of 50 %, lower emission reductions are only expected for Sweden (33 %) and Russia (11 %). Emissions due to ship traffic are, on the other hand, expected to increase by 22 % in the same period.
Larger variations are projected for the development in the NH3emissions. Largest reductions of about 20–30 % are
ex-pected in Sweden, Germany, Latvia and Finland, while lower reductions from 1–13 % are projected in Denmark, Poland, Lithuania and Estonia. For Russia the NH3 emissions are
expected to increase by 50 % in 2020.
The total nitrogen emission is, as a result of the separate changes in NOxand NH3, projected to decrease by
approxi-mately 30 % in eight of the nine countries, where only emis-sions from Russia are projected to increase by 7 %. The net effect is an overall decrease of 15 %.
3 Results
With a model setup of DEHM using the meteorological ref-erence conditions and emission estimates described above, a series of model simulations have been conducted to calculate the total deposition, but also to assess the contribution from
each of the nine countries surrounding the Baltic Sea as well as from ship traffic. In total, 22 model simulations have been carried out for the two emission years 2007 and 2020 based on the same meteorological input for 1998. The first series of 11 simulations include:
1. one standard simulation including the full emission dataset for 2007;
2. simulations for each of the nine countries, where the tagging method has been used to “tag” the emissions from the specific countries. Thereby it is possible to separate the source signals from, e.g. Poland, from the full set of emissions in the model;
3. one simulation where the emissions from international ship traffic are tagged.
The same series of simulations are made for the next emis-sion year, where the projected emisemis-sions for 2020 are in-cluded.
As mentioned in Sect. 2.3.1, the results from the scenario simulations are not directly validated against measurements, since the results do not describe the actual depositions but re-flect average deposition for present day conditions. In Sect. 4 the results will be evaluate by comparison to other similar studies.
3.1 Depositions to the Baltic Sea
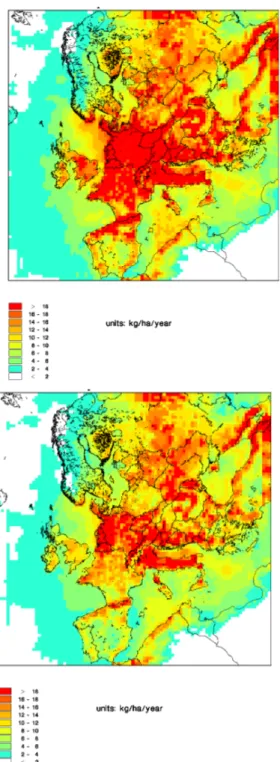
Fig. 3.Simulated total annual deposition of nitrogen across Europe, based on emissions from all present day (2007) sources (top) within the model domain and the projected emissions for 2020 (bottom). The common unit for nitrogen deposition [kg N ha−1] is used. Mul-tiply with 100 to convert to [kg N km−2].
deposition per km2 to the Belt Sea is approximately three
times higher than the deposition per km2to the Gulf of Both-nia (see Tables S1 and S2 in the Supplement). The general decrease in the projected emissions from today to 2020 (see also Sect. 2.3.2 and Table 1) is clearly reflected in a
corre-Table 2.The modelled deposition of NOy, NHxand total nitrogen
(in k tonnes N) to the Baltic Sea based on 1998 meteorology and including present day emissions (2007) and projections for 2020. The resulting reduction in deposition is given in kt N and as a %-decrease. The latter can be compared to the %-decrease in emis-sions in Europe and in the countries bordering the Baltic Sea (P Baltic C.).
NOy NHx Total N
2007 [kt N] 102 101 203
2020 [kt N] 73 91 165
Difference [kt N] 28 10 38
Difference [%] −28 −10 −19
Emis. change, Europe [%] −28 −1 −16
Emis. change,PBaltic C. [%] −28 2 −15
sponding decrease in the deposition of nitrogen in most re-gions across Europe. In rere-gions where the projected changes in agricultural emissions of NH3are small (which is the case
in, e.g. Russia, Italy and the Netherlands) the development in the total deposition is also small.
The total modelled nitrogen deposition to the Baltic Sea (here a surface area of 415 000 km2is used) based on the two un-tagged scenarios is given in Table 2. Based on the 2007 and 2020 emissions, the annual deposition to the Baltic is 203 and 165 k tonnes N, respectively, giving a projected reduc-tion of 38 k tonnes nitrogen in the annual load in 2020. This equals a decline in nitrogen deposition of 19 %, which should be compared to the corresponding overall emission reduc-tion of 16 % in Europe during the same period. The results for the oxidised (NOy)and reduced (NHx)nitrogen
compo-nents are also given in Table 2. Following the reductions in the emissions, the largest decrease of 28 % is estimated for NOy, while the contribution from NHx only is projected to
decrease by 10 %. This can be compared to the reduction of 28 % and 1 % in the applied emissions of NOyand NHx
in Europe during the same period. The largest reductions in percent of the present day deposition are predicted to be in the Sound, the Belt Sea and Kattegat (26 %) and smallest re-ductions (10 %) in the Gulf of Finland (see Table S5 in the Supplement).
In Fig. 4 the nitrogen deposition related to emissions in Poland alone in 2007 is compared to the similar simulation including 2020 emissions. These results are shown as an ex-ample of the results for a model run including the tagging method. Poland contributes to the nitrogen deposition mainly in the northern and eastern part of Europe. Highest present day depositions of more than 10 kg N ha−1yr−1are only seen
over Poland and the contribution decreases relatively fast with distance, leading to contributions of 2–5 kg N ha−1 in
the neighbouring countries to the east and 1–2 kg N ha−1in
Fig. 4. Simulated annual deposition of nitrogen across Europe, based on emissions from present day sources in Poland (top) and 2020 sources in Poland (bottom), using the tagging method. The common unit for nitrogen deposition [kg N ha−1] is used. Multiply
with 100 to convert to [kg N km−2].
visible in the lower part of Fig. 4 showing a clear decrease in depositions in 2020. It can also be seen that the deposi-tion of nitrogen within the country itself arising from Polish emissions is generally below 10 kg N ha−1in 2020.
2007
48
17 9 8
6 5
3 2
1 1
Other sources Germany Poland Denmark Russia Sweden Finland Lithuania Latvia Estonia
2020
52
13 8 7
9
4 3
2 1
1
Other sources Germany Poland Denmark Russia Sweden Finland Lithuania Latvia Estonia
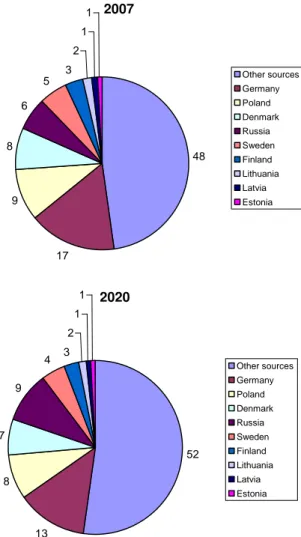
Fig. 5. The nitrogen deposition to the Baltic Sea divided into the contribution from the nine bordering countries and other sources (i.e. from the remaining emissions in the model domain). The con-tributions are given in percent [%] for both the present day scenario and the projections for 2020. Each contributing country has the same colour in the two pies.
3.2 Country allocation
Based on the 20 simulations with the tagging technique, the contribution from the countries surrounding the Baltic Sea to the deposition in the Baltic Sea is displayed in a “country allocation table” (Table 3) including the contributions from ship traffic and from all sources within the full model do-main. The deposition per km2is highest to the basins closest to each country (see Tables S1 and S2 in the Supplement), which indicates that the deposition is dominated by com-pounds that are transported over relatively short distances.
Table 3.A country allocation table with the predicted contributions (in k tonnes N yr−1) from different source regions/types to the total nitrogen deposition to the Baltic Sea. The change from 2007 to 2020 is given both as k tonnes N and in percent [%]. The changes in nitrogen emissions are also given (taken from Table 1).
Contribution 2007 2020 Change Change Emission from [kt N] [kt N] [kt N] [%] change [%]
All sources 203 165 −38 −19 −16
Denmark 16 11 −5 −30 −29
Sweden 11 7 −4 −35 −34
Finland 7 4 −2 −31 −37
Germany 34 22 −12 −35 −6
Poland 19 14 −6 −30 −33
Russia 13 16 3 23 7
Estonia 2 1 −1 −33 −31
Latvia 2 1 −1 −35 −36
Lithuania 3 3 −1 −23 −28
P
Baltic C. 106 79 −27 −26 −15
Ships 17 18 1 6 22
2007, be traced back to emissions within the nine countries surrounding the Baltic Sea, while 48 % comes from ships and countries further away. This distribution is projected to shift so that the part of the deposition arising from the countries surrounding the Baltic Sea are expected to decrease to ca. 48 % in 2020, while other sources are predicted to contribute with 52 %. However, the contribution from international ship traffic is projected to increase from 17 k tonnes N in 2007 to 18 k tonnes N in 2020, equal to 8 % and 11 % of the total de-position to the Baltic Sea for the two years. The fraction of the contribution from countries with no border to the Baltic Sea is therefore almost the same for the two years (∼40 %).
In the present day scenario, the four largest contributors to Baltic Sea deposition were Germany, Poland, Denmark and Russia, whereas this order changes slightly to Germany, Russia, Poland and Denmark in the 2020 scenario. If cal-culated as a percentage of the present day deposition, the change in deposition between the 2007 and the 2020 sce-nario is between−23 % and−35 % for all countries except Russia. The expected increase in nitrogen emissions within Russia leads to a projected 23 % increase in the deposition. When examining the reduction in absolute contributions in k tonnes N (Table 3), the largest reductions in deposition are from Germany (ca. 12.0 k tonnes N), Poland (5.7 k tonnes N), Denmark (4.75 k tonnes N) and Sweden (3.83 k tonnes N).
In the main basins the deposition per km2 from ships is highest in Kattegat, the Danish Straits and in the western part of the Baltic Proper (see Tables S1 and S2 in the Supplement for details).
The BSAP includes a provisional country-wise reduc-tion allocareduc-tion (see http://www.helcom.fi/BSAP/Acreduc-tionPlan/ en GB/ActionPlan/#eutrophication), which will be reviewed
Table 4. The projected reduction in nitrogen deposition compared to the required nitrogen input reduction in the provisional Baltic Sea Action Plan (BSAP) country allocation plan.
Contribution 2007–2020 BSAP Part of BSAP
from Reduction reductions reduction
[kt N] [kt N] [%]
Denmark 4.75 17.21 28
Sweden 3.83 20.78 18
Finland 2.03 1.20 169
Germany 11.97 5.62 213
Poland 5.70 62.40 9
Russia −2.94 6.97 –
Estonia 0.62 0.90 69
Latvia 0.75 2.56 29
Lithuania 0.75 11.75 6
in 2013. In Table 4 this is compared to the reductions pro-jected in this study on the basis of the NEC-II emissions. It can be seen that some countries (i.e. Germany and Finland) are anticipated to have a stronger reduction in emissions fol-lowing the NEC-II directive compared to the targeted emis-sion reductions according to the BASP. Other countries (e.g. Denmark, Sweden and Poland) require further regulations to reach the BSAP goal. Based on the projected emissions changes, the overall reduction in the contribution from eight of the countries is 25 % of the nitrogen reduction required in the provisional BASP. The contribution from Russia is not included here, as this is the only country where the emissions are projected to increase. In this case the increased input of nitrogen would have to be counteracted by further regulation initiatives in Russia.
4 Discussion
agreement with this most recent estimate from the EMEP model (which is based on 2006 emissions and meteorology). The other numbers representing the 1990s are higher than our estimate using 2007 emissions; however, this seems reason-able since the emissions of nitrogen compounds in Europe have been reduced by more than 30 % since 1990. In ad-dition to that, year-to-year variations in meteorological pa-rameters will have an impact on the estimates for individ-ual years. As described previously, we found the deposition to vary by±17 % due to interannual variations in meteorol-ogy in the period 1995–2004. This is in accordance with Bartnicki et al. (2011), in which the simulated deposition based on 2006 emissions and the meteorology for 1995–2005 ranged between 87 % and 117 % of the mean deposition.
The model runs performed with the tagging method have provided us with data on the percentage that each country surrounding the Baltic Sea contributes to the total nitrogen deposition now and in 2020 (Sect. 3.2). When comparing the changes in deposition with the changes in emission (Ta-ble 3), the results can be divided into three groups. In the first group the projected percentage emission decrease is close to the percentage deposition decrease; this is seen for Denmark, Sweden, Germany, Estonia and Latvia. For the second group (Finland, Poland and Lithuania), the projected emission duction is four to five percent higher than the deposition re-duction. The last group consists only of Russia. Opposite to all other countries, nitrogen emissions from Russia are pro-jected to increase by 7 %, resulting in a propro-jected increase of the deposition load to the Baltic Sea of around 23 %.
The discrepancy between reductions in emissions and re-sulting depositions can have many explanations. The main sources of nitrogen are emissions of NH3and NOx. These
compounds take part in non-linear chemical transformations and their products can be transported over short or long dis-tances before being deposited, e.g. onto the Baltic Sea. The ∼one-to-one ratio between emission and deposition reduc-tions for the first group of countries can be explained by a combination of the geographic distribution of emissions within these countries and their distance to the Baltic Sea, as well as the prevailing wind and precipitation patterns. Den-mark, Sweden and Germany lie in the western upwind flow to the Baltic Sea. Although Estonia and Latvia are in the downwind flow to the Baltic Sea, they have very long coast-lines to the Baltic Sea and the deposition is likely dominated by coast-near sources. The same explanation applies to the second group of countries; however, since their geographical distribution of emissions is not directly upwind in the prevail-ing wind and precipitation patterns, the emission reductions here will have a smaller impact on the deposition reduction to the Baltic Sea.
In Russia the NOxemissions are projected to reduce with
10 %, while the NH3emissions are expected to increase by
50 %, and the emission patterns of Russia show a high in-crease of NH3emissions in the western part of Russia. The
atmospheric residence time of NH3is shorter than for NOx,
so this change in the relative share of NOxand NH3
emis-sions from Russia will lead to an increase in deposition within and close to Russia and hence also to the Baltic Sea. Based on the above explanations, the main deposition source from Russia will come from the western part of Russia.
The decrease (−28 %) in total deposition of NOy to the Baltic Sea (Sect. 3.1 and Table 2) has a∼one-to-one relation-ship to the projected NOxemission changes at the European
scale and within the surrounding countries (both −28 %). For NHx this is, however, not the case. Here the total depo-sition of NHx is projected to decrease with−10 %, while the emissions are changing with−1 % (Europe) and 2 % (coun-tries surrounding the Baltic Sea). Following the discussion above, this can be explained mainly by the fact that the emis-sion changes in the upwind areas (Denmark, Germany and Sweden) are projected to be larger than the average changes. These emission reductions will hence have a large impact on the total NHx deposition changes.
An important aspect which also requires attention is that the size of the change in emissions/concentrations relative to the general background level can have an impact on the non-linear chemical processes in the atmosphere. However, this is a non-trivial problem and will be investigated in a forth-coming study. Also, the importance of bi-directional fluxes of nitrogen components for this kind of study should be eval-uated in the future.
In addition to the interannual variability in meteorology and hence in deposition (Sect. 2.3.1), general variations in the climate and global warming might lead to changed mete-orological conditions in the Baltic region. In a recent study the possible impact of climate change on the deposition of nitrogen to the Baltic sea was investigated by forcing a CTM with a climate change scenario (SRES A2) while maintaining the emissions constant at the present day (year 2000) level (Langner et al., 2009). They concluded that the impact from climate change alone is small, with an increase in the depo-sition of∼5 % by the end of the 21st century.
5 Conclusions
The magnitude and variability in nitrogen deposition to the Baltic Sea is a highly studied topic. We focus in this model study solely on the impact of changes in anthropogenic emis-sions between 2007 and 2020. In total, 22 model runs have been carried out with the CTM model DEHM, 20 of these in-cluding a tagging technique to keep track of emissions from a specific source (here the nine countries with coastlines to the Baltic Sea and international ship traffic).
decrease to 48 % in 2020. The input from countries further away is hence significant, which emphasizes the importance of international agreements within EU and the rest of Eu-rope. The contribution from international ship traffic is also significant and is projected to increase according to the im-plemented emission scenario.
Of the bordering countries, the main contributors to Baltic Sea nitrogen deposition were Germany, Poland, Denmark and Russia in 2007. Using the projected 2020 emissions, Russia is anticipated to become the second largest contrib-utor. When calculated as a percentage of the present day deposition, the change in deposition is between−23 % and −35 % for all countries except Russia. Only in Russia is an increase in the emissions of nitrogen components expected, which, according to the model runs, will lead to a 23 % in-crease in the deposition from Russia. The response between changes in national nitrogen emissions and resulting deposi-tions to the Baltic Sea has been analysed and factors like ge-ographical distribution of emissions/emission type, distance to the Baltic Sea combined with the prevailing wind and pre-cipitation patterns in the region have a significant impact on the response. A∼one-to-one relationship between national emission changes and resulting changes in depositions over the Baltic Sea is therefore only seen for some of the countries bordering the Baltic Sea.
Within the Baltic Sea Action Plan, the countries around the Baltic Sea have agreed to share the nutrient reduction burden via a provisional country allocation scheme. This scheme is based on the land-based input of nutrients to the Baltic Sea that reaches the sea via, e.g. runoff. Our results show that 21 % of the BSAP nitrogen reductions can be reached if the suggested NEC-II targets are reached in 2020. The current study demonstrates that future updates of the Baltic Sea Ac-tion Plan need to include both estimates of the overall input of nitrogen from the atmosphere as well as more detailed in-formation on country allocation and projected changes. We recommend using a CTM with tagging options to provide the required information on: (1) an assessment of the total at-mospheric input of nitrogen and the projected future changes and (2) assessments of the contribution from individual coun-tries to the deposition to the Baltic Sea and the projected fu-ture changes in these contributions.
Our study also showed that the interannual variations in the annual nitrogen deposition due to variability in meteoro-logical parameters are considerable (±17 %). It is therefore important that evaluations of, for example, planned emis-sion reductions take such interannual variations into account. This can be done either by making deposition assessments covering several years or by applying a representative mete-orological deposition year like in this study.
Overall, our results show that the emission changes from 2007 to 2020 alone lead to changes in the deposition on the same order of magnitude as the deposition changes due to in-terannual variation in the meteorological forcing. A previous study (Langner et al., 2009) showed only small changes due
to future climate changes (SRES A2 scenario); however, the possible non-linear effects in air chemistry due to changes in both climate and emissions were not included in that study. Therefore, the combined effect of emission changes, interan-nual variability in meteorological forcing as well as general changes in climate still needs to be assessed to improve the understanding of the future developments in the nitrogen de-position to the Baltic Sea.
Supplementary material related to this article is available online at:
http://www.atmos-chem-phys.net/12/2615/2012/ acp-12-2615-2012-supplement.pdf.
Acknowledgements. This work was performed as part of the Baltic Nest Institute, funded by Aarhus University, Denmark. Some of the authors also received funding from the Nordic Council of Ministers. We thank Cordula G¨oke, Department of Bioscience, Aarhus University, for GIS support. We would also like to thank the editor and the anonymous referees for their careful, detailed review and constructive comments.
Edited by: L. Ganzeveld
References
Amann, M., Bertok, I., Cofala, J., Heyes, C., Klimont, Z., Rafaj, P., Sch¨opp, W., and Wagner, F.: National Emission Ceilings for 2020 based on the 2008 Climate & Energy Package. NEC Sce-nario Analysis Report #6, International Institute for Applied Sys-tem Analysis (IIASA), Laxenburg, Austria, 2008.
Andersen, J., Axe, P., Backer, H., Carstensen, J., Claussen, U., Fleming-Lehtinen, V., J¨arvinen, M., Kaartokallio, H., Knuuttila, S., Korpinen, S., Kubiliute, A., Laamanen, M., Lysiak-Pastuszak, E., Martin, G., Murray, C., Møhlenberg, F., Nausch, G., Norkko, A., and Villn¨as, A., Getting the measure of eutrophication in the Baltic Sea: towards improved assessment principles and meth-ods, Biogeochemistry, 106, 137–156, 2011.
Bartnicki, J., Semeena, V. S., and Fagerli, H.: Atmospheric depo-sition of nitrogen to the Baltic Sea in the period 1995–2006, Atmos. Chem. Phys., 11, 10057–10069, doi:10.5194/acp-11-10057-2011, 2011.
Bouwman, A. F., Lee, D. S., Asman, W. A. H., Dentener, F. J., Van der Hoek, K. W., and Olivier, J. G. J.: A global high-resolution emission inventory for ammonia, Global Biochem. C., 11, 561– 587, 1997.
Brandt, J., Christensen, J. H., Frohn, L. M., Palmgren, F., Berkow-icz, R., and Zlatev, Z.: Operational air pollution forecasts from European to local scale, Atmos. Environ., 35, S91–S98, 2001. Brandt, J., Christensen, J. H., Frohn, L. M., and Berkowicz, R.:
Air pollution forecasting from regional to urban street scale – implementation and validation for two cities in Denmark, Phys. Chem. Earth, 28, 335–344, 2003.
Hemi-spheric Model with focus on intercontinental transport of air pol-lution, Atmos. Environ., doi:10.1016/j.atmosenv.2012.01.011, in press, 2012.
Brandt, J., Silver, J. D, Christensen, J. H., Andersen, M. S., Bønløkke, J. H., Sigsgaard, T., Geels, C., Gross, A., Hansen, A. B., Hansen, K. M., Hedegaard, G. B., Kaas, E., and Frohn, L. M.: Assessment of Health-Cost Externalities of Air Pollution at the National Level using the EVA Model System, CEEH Sci-entific Report No 3, Centre for Energy, Environment and Health Report series, 1–98, 2011.
Chaparro-Suarez, I. G., Meixner, F. X., and Kesselmeier, J.: Ni-trogen dioxide (NO2)uptake by vegetation controlled by
atmo-spheric concentrations and plant stomatal aperture, Atmos. Env-iron., 45, 5742–5750, 2011.
Christensen, J. H.: The Danish Eulerian hemispheric model – A three-dimensional air pollution model used for the Arctic, At-mos. Environ., 31, 4169–4191, 1997.
Christensen, J. H., Brandt, J., Frohn, L. M., and Skov, H.: Modelling of Mercury in the Arctic with the Danish Eule-rian Hemispheric Model, Atmos. Chem. Phys., 4, 2251–2257, doi:10.5194/acp-4-2251-2004, 2004.
Cooter, E. J., Bash, J. O., Walker, J. T., Jones, M. R., and Robarge, W., Estimation of NH3bi-directional flux from managed agricul-tural soils, Atmos. Environ., 44, 2107–2115, 2010.
Dorsey, J. R., Duyzer, J. H., Gallagher, M. W., Coe, H., Pilegaard, K., Weststrate, J. H., Jensen, N. O., and Walton, S.: Oxidized nitrogen and ozone interaction with forests. I: Experimental ob-servations and analysis of exchange with Douglas fir, Q. J. Roy. Meteor. Soc., 130, 1941–1955, 2004.
Ellermann, T., Andersen, H. A., Bossi, R., Christensen, J. H., Løfstrøm, P., Monies, C., Grundahl, L., and Geels, C.: Atmo-spheric deposition 2009 NOVANA (In Danish: Atmosfærisk de-position 2009 NOVANA), National Environmental Research In-stitute, Aarhus University, 1–95, 2010.
Emberson, L. D., Ashmore, M. R., Cambridge, H. M., Simpson, D., and Tuovinen, J. P.: Modelling stomatal ozone flux across Europe, Environ. Pollut., 109, 403–413, 2000.
Fisher, J. A., Jacob, D. J., Purdy, M. T., Kopacz, M., Le Sager, P., Carouge, C., Holmes, C. D., Yantosca, R. M., Batchelor, R. L., Strong, K., Diskin, G. S., Fuelberg, H. E., Holloway, J. S., Hyer, E. J., McMillan, W. W., Warner, J., Streets, D. G., Zhang, Q., Wang, Y., and Wu, S.: Source attribution and in-terannual variability of Arctic pollution in spring constrained by aircraft (ARCTAS, ARCPAC) and satellite (AIRS) observa-tions of carbon monoxide, Atmos. Chem. Phys., 10, 977–996, doi:10.5194/acp-10-977-2010, 2010.
Forsius, M., Posch, M., Aherne, J., Reinds, G. J., Christensen, J., and Hole, L.: Assessing the Impacts of Long-Range Sulfur and Nitrogen Deposition on Arctic and Sub-Arctic Ecosystems, Am-bio, 39, 136–147, 2010.
Frohn, L. M., Christensen, J. H., and Brandt, J.: Development of a high-resolution nested air pollution model – The numerical ap-proach, J. Comput. Phys., 179, 68–94, 2002.
Frohn, L. M., Hansen, K. M., Hasler, B., Gross, A., Geels, C., Christensen, J. H., Brandt, J., Skjøth, C. A., Hedegaard, G. B., Hansen, A. B., and Zare, A.: Nitrogen deposition to the Baltic Sea – who are the main contributors?, Aquat. Ecosyst. Health, in preparation, 2012.
Ganzeveld, L. N., Lelieveld, J., Dentener, F. J., Krol, M. C.,
Bouw-man, A. J., and Roelofs, G.-J.: Global soil-biogenic NOx
emis-sions and the role of canopy processes, J. Geophys. Res., 107, 4298, doi:10.1029/2001JD001289, 2002a.
Ganzeveld, L. N., Lelieveld, J., Dentener, F. J., Krol, M. C., and Roelofs, G.-J.: Atmosphere-biosphere trace gas exchanges sim-ulated with a single-column model, J. Geophys. Res., 107, 4297, doi:10.1029/2001JD000684, 2002b.
Geels, C., Doney, S. C., Dargaville, R., Brandt, J., and Christensen, J. H.: Investigating the sources of synoptic variability in atmo-spheric CO2measurements over the Northern Hemisphere
con-tinents: a regional model study, Tellus B, 56, 35–50, 2004. Geels, C., Brandt, J., Christensen, J., Frohn, L., and Hansen, K.:
Long-Term Calculations with a Comprehensive Nested Hemi-spheric Air Pollution Transport Model, edited by: Farag´o, I., Georgiev, K., and Havasi, ´A., Springer Netherlands, 185–196, 2005.
Geels, C., Gloor, M., Ciais, P., Bousquet, P., Peylin, P., Vermeulen, A. T., Dargaville, R., Aalto, T., Brandt, J., Christensen, J. H., Frohn, L. M., Haszpra, L., Karstens, U., R¨odenbeck, C., Ra-monet, M., Carboni, G., and Santaguida, R.: Comparing at-mospheric transport models for future regional inversions over Europe – Part 1: mapping the atmospheric CO2 signals,
At-mos. Chem. Phys., 7, 3461–3479, doi:10.5194/acp-7-3461-2007, 2007.
Genualdi, S., Harner, T., Cheng, Y., MacLeod, M., Hansen, K. M., van Egmond, R., Shoeib, M., and Lee, S. C.: Global Distribution of Linear and Cyclic Volatile Methyl Siloxanes in Air, Environ. Sci. Technol., 45, 3349–3354, 2011.
Graedel, T. F., Bates, T. S., Bouman, A. F., Cunnold, D., Dignon, J., Fung, I., Jacob, D. J., Lamb, B. K., Logan, J. A., Marland, G., Middleton, P., Pacyna, J. M., Placet, M., and Veldt, C.: A com-pilation of inventories of emissions to the atmosphere, Global Biochem. Cy., 7, 1–16, 1993.
Grell, G. A., Dudhia, J., and Stauffer, D. R.: A description of the fifth-generation Penn State NCAR Mesoscale Model (MM5), Mesoscale and Microscale Meteorology Division, National Cen-ter for Atmospheric Research, Boulder, Colorado, 122, 1–22, 1995.
Gyldenkærne, S., Ambelas Skjøth, C., Hertel, O., and Ellermann, T.: A dynamical ammonia emission parameterization for use in air pollution models, J. Geophys. Res.-Atmos., 110, D07108, doi:10.1029/2004JD005459, 2005.
Hansen, K. M., Christensen, J. H., Brandt, J., Frohn, L. M., Geels, C., Skjoth, C. A., and Li, Y. F.: Modeling short-term variability of alpha-hexachlorocyclohexane in North-ern Hemispheric air, J. Geophys. Res-Atmos., 113, D02310, doi:10.1029/2007JD008492, 2008.
Hedegaard, G. B., Brandt, J., Christensen, J. H., Frohn, L. M., Geels, C., Hansen, K. M., and Stendel, M.: Impacts of climate change on air pollution levels in the Northern Hemisphere with special focus on Europe and the Arctic, Atmos. Chem. Phys., 8, 3337–3367, doi:10.5194/acp-8-3337-2008, 2008.
Hedegaard, G. B., Gross, A., Christensen, J. H., May, W., Skov, H., Geels, C., Hansen, K. M., and Brandt, J.: Modelling the impacts of climate change on tropospheric ozone over three centuries, At-mos. Chem. Phys. Discuss., 11, 6805–6843, doi:10.5194/acpd-11-6805-2011, 2011.
Commis-sion, 1–24, 2005.
Hertel, O., Christensen, J., Runge, E. H., Asman, W. A. H., Berkow-icz, R., Hovmand, M. F., and Hov, Ø.: Development and Testing of A New Variable Scale Air-Pollution Model – Acdep, Atmos. Environ., 29, 1267–1290, 1995.
Hertel, O., Ambelas Skjøth, C., Brandt, J., Christensen, J. H., Frohn, L. M., and Frydendall, J.: Operational mapping of at-mospheric nitrogen deposition to the Baltic Sea, Atmos. Chem. Phys., 3, 2083–2099, doi:10.5194/acp-3-2083-2003, 2003. Hertel, O., Skjøth, C. A., Lofstrom, P., Geels, C., Frohn, L. M.,
Ellermann, T., and Madsen, P. V., Modelling nitrogen deposition on a local scale – A review of the current state of the art, Environ. Chem., 3, 317–337, 2006.
Hertel, O., Ellermann, T., Palmgren, F., Berkowicz, R., Lofstrom, P., Frohn, L. M., Geels, C., Skjoth, C. A., Brandt, J., Christensen, J., Kemp, K., and Ketzel, M.: Integrated air-quality monitoring – combined use of measurements and models in monitoring pro-grammes, Environ. Chem., 4, 65–74, 2007.
Hole, L. R., Christensen, J. H., Ruoho-Airola, T., Torseth, K., Ginzburg, V., and Glowacki, P.: Past and future trends in concen-trations of sulphur and nitrogen compounds in the Arctic, Atmos. Environ., 43, 928–939, 2009.
Hongisto, M. and Joffre, S.: Meteorological and climatological fac-tors affecting transport and deposition of nitrogen compounds over the Baltic Sea, Boreal Environ. Res., 10, 1–17, 2005. Horii, C. V., Munger, J. W., Wofsy, S. C., Zahniser, M., Nelson,
D., and McManus, J. B.: Fluxes of nitrogen oxides over a tem-perate deciduous forest, J. Geophys. Res-Atmos., 109, D08305 doi:10.1029/2003JD004326, 2004.
Hov, O. and Hjollo, B. A.: Transport Distance of Ammonia and Ammonium in Northern Europe: 2. Its Relation to Emissions of SO2and NOx, J. Geophys. Res.-Atmos., 99, 18749–18755,
1994.
Hov, O., Hjollo, B. A., and Eliassen, A.: Transport Distance of Ammonia and Ammonium in Northern Europe: 1. Model De-scription, J. Geophys. Res.-Atmos., 99, 18735–18748, 1994. Karthikeyan, S., He, J., Palani, S., Balasubramanian, R., and
Burger, D.: Determination of total nitrogen in atmospheric wet and dry deposition samples, Talanta, 77, 979–984, 2009. Krishnamurthy, A., Moore, J. K., Mahowald, N., Luo, C., and
Zender, C. S.: Impacts of atmospheric nutrient inputs on ma-rine biogeochemistry, J. Geophys. Res-Biogeo., 115, G01006, doi:10.1029/2009JG001115, 2010.
Lamarque, J.-F., Bond, T. C., Eyring, V., Granier, C., Heil, A., Klimont, Z., Lee, D., Liousse, C., Mieville, A., Owen, B., Schultz, M. G., Shindell, D., Smith, S. J., Stehfest, E., Van Aardenne, J., Cooper, O. R., Kainuma, M., Mahowald, N., Mc-Connell, J. R., Naik, V., Riahi, K., and van Vuuren, D. P.: His-torical (1850–2000) gridded anthropogenic and biomass burning emissions of reactive gases and aerosols: methodology and ap-plication, Atmos. Chem. Phys., 10, 7017–7039, doi:10.5194/acp-10-7017-2010, 2010.
Langner, J., Andersson, C., and Engardt, M., Atmospheric input of nitrogen to the Baltic Sea basin: present situation, variability due to meteorology and impact of climate change, Boreal Environ. Res., 14, 226–237, 2009.
Langner, J., Engardt, M., Baklanov, A., Christensen, J. H., Gauss, M., Geels, C., Hedegaard, G. B., Nuterman, R., Simpson, D., Soares, J., Sofiev, M., Wind, P., and Zakey, A.: A
multi-model study of impacts of climate change on surface ozone in Europe, Atmos. Chem. Phys. Discuss., 12, 4901–4939, doi:10.5194/acpd-12-4901-2012, 2012.
Lerdau, M. T., Munger, J. W., and Jacob, D. J.: The NO2flux
co-nundrum, Science, 289, 2291–2293, 2000.
Massad, R.-S., Nemitz, E., and Sutton, M. A.: Review and param-eterisation of bi-directional ammonia exchange between vegeta-tion and the atmosphere, Atmos. Chem. Phys., 10, 10359–10386, doi:10.5194/acp-10-10359-2010, 2010.
McLachlan, M. S., Kierkegaard, A., Hansen, K. M., van Egmond, R., Christensen, J. H., and Skjøth, C. A.: Concentrations and Fate of Decamethylcyclopentasiloxane (D5) in the Atmosphere, Environ. Sci. Technol., 44, 5365–5370, 2010.
Olesen, H. R., Winther, M., Ellermann, T., Christensen, J. H., and Plejdrup, M. S.: Ship emissions and air pollution in Denmark: Present situation and future scenarios, The Danish Environmen-tal Protection Agency, 2009.
Olson, J. S.: World Ecosystems (WE1.4). Digital Raster Data on a 10-minute Cartesian Orthonormal Geodetic 1080×2160 grid, in: Global Ecosystems Database, Version 2.0 Boulder, CO: National Geophysical Data Center, 1992.
Pul, A. v., Hertel, O., Geels, C., Dore, A. J., Vieno, M., Jaarsveld, H. A. v., Bergstr¨om, R., Schapp, M., and Fagerli, H.: Modelling the Atmospheric Transport and Deposition of Ammonia at a Na-tional and regional Scale in: Atmospheric Ammonia, Detecting emission changes and environmental impacts, edited by: Sutton, M. A., Reis, S., and Baker, S. M. H., Springer, 464 pp., 2009. Schultz, M. G., Heil, A., Hoelzemann, J. J., Spessa, A.,
Thon-icke, K., Goldammer, J. G., Held, A. C., Pereira, J. M. C., and van het Bolscher, M.: Global wildland fire emis-sions from 1960 to 2000, Global Biochem. Cy., 22, GB2002, doi:10.1029/2007GB003031, 2008.
Seinfeld, J. H. and Pandis, S. N.: Atmospheric Chemistry and Physics : From Air Pollution to Climate Change: John Wiley & Sons Inc., New York, 1203 pp., 2006.
Simpson, D., Fagerli, H., Jonson, J. E., Tsyro, S., Wind, P., and Tuovinen, J.-P: Transboundary Acidification, Eutrophication and Ground Level Ozone in Europe, PART I, Unified EMEP Model Description, 1-104, 2003.
Skjøth, C. A., Hertel, O., Gyldenkærne, S., and Ellermann, T.: Im-plementing a dynamical ammonia emission parameterization in the large-scale air pollution model ACDEP, J. Geophys. Res.-Atmos., 109, 1–13, 2004.
Skjøth, C. A., Geels, C., Berge, H., Gyldenkærne, S., Fagerli, H., Ellermann, T., Frohn, L. M., Christensen, J., Hansen, K. M., Hansen, K., and Hertel, O.: Spatial and temporal variations in ammonia emissions – a freely accessible model code for Europe, Atmos. Chem. Phys., 11, 5221–5236, doi:10.5194/acp-11-5221-2011, 2011.
Sorensen, L. L., Hertel, O., Skjoth, C. A., Lund, M., and Pedersen, B.: Fluxes of ammonia in the coastal marine boundary layer, At-mos. Environ., 37, S167–S177, 2003.
MEAD: An interdisciplinary study of the marine effects of at-mospheric deposition in the Kattegat, Environ. Pollut., 140, 453– 462, 2006.
Sutton, M. A., Nemitz, E., Theobald, M. R., Milford, C., Dorsey, J. R., Gallagher, M. W., Hensen, A., Jongejan, P. A. C., Eris-man, J. W., Mattsson, M., Schjoerring, J. K., Cellier, P., Loubet, B., Roche, R., Neftel, A., Hermann, B., Jones, S. K., Lehman, B. E., Horvath, L., Weidinger, T., Rajkai, K., Burkhardt, J., L¨opmeier, F. J., and Daemmgen, U.: Dynamics of ammonia ex-change with cut grassland: strategy and implementation of the GRAMINAE Integrated Experiment, Biogeosciences, 6, 309– 331, doi:10.5194/bg-6-309-2009, 2009.
van Vuuren, D. P., den Elzen, M. G. J., Lucas, P. L., Eickhout, B., Strengers, B. J., van Ruijven, B., Wonink, S., and van Houdt, R.: Stabilizing greenhouse gas concentrations at low levels: an assessment of reduction strategies and costs, Climatic Change, 81, 119–159, 2007.
WMO: The role of Climatological normals in a changing climate, 2007.
WMO: Guide to Climatological Pratices, 2010.
Wu, Q. Z., Wang, Z. F., Gbaguidi, A., Gao, C., Li, L. N., and Wang, W.: A numerical study of contributions to air pollution in Bei-jing during CAREBeiBei-jing-2006, Atmos. Chem. Phys., 11, 5997– 6011, doi:10.5194/acp-11-5997-2011, 2011.