A
N
A
DVANCED
Q
OS
A
NALYSIS
A
ND
E
VALUATION
M
ETHOD
F
OR MOBILE
I
NTERNET
A
CCESS
F. Beritelli, C. Rametta, A. Raspanti*, M. Russo°, F. Scaglione° and G. Spallina*
Dipartimento di Ingegneria Elettrica, Elettronica e Informatica,University of Catania, V.le A. Doria, 6 – 95125 Catania, Italy
* HELILAB S.R.L. Via IV Novembre, 130 F – 95022 Aci Catena (CT) - Italy ° VICOSYSTEMS S.R.L. V. le O. Da Pordenone, 33 -95128 Catania - Italy
ABSTRACT
The paper proposes a new method for the analysis and evaluation of the Quality of Service (QoS) in a mobile Internet access scenario. In particular, the paper proposes a throughput evaluation method based on PathChirp algorithm. The end-to-end bandwidth was estimated by means of the Self Loading of Periodic Streams (SloPS) technique. The obtained measurements were then analyzed by estimating the degree of correlation with other parameters that characterize the data transmission such as power, round trip time, etc. Finally, in order to have greater spatial resolution performance guaranteed by an Internet service provider, a 3D reconstruction method based on using drones is proposed and some preliminary results are discussed.
KEYWORDS
Radio Access Evaluation; 3G-4G Networks, Throughput Evaluation Algorithms; RAN KPIs Correlation.
1.
I
NTRODUCTIONMobile Internet is growing rapidly due to low setup costs and decrease in price. We live in a wireless world, where the demand for the Internet on our laptops, tablets and smart phones is a necessity anywhere we go. However, not everyone has access to the data speed they require. The main reason for slow Internet speed is weak signal strength due to inadequate radio coverage in critical areas such as those in the suburbs.
The paper proposes a new method for the analysis and evaluation of the Quality of Service (QoS) in a mobile Internet access scenario. In particular, the paper proposes a throughput evaluation method based on PathChirp algorithm [1]. The end-to-end bandwidth was estimated by means of the Self Loading of Periodic Streams (SLoPS) technique [2][3].
To this end, we have analyzed the PathLoad [2] and PathChirp techniques, both techniques based on a client-server paradigm, and able to provide an estimate of the available bandwidth end-to-end.
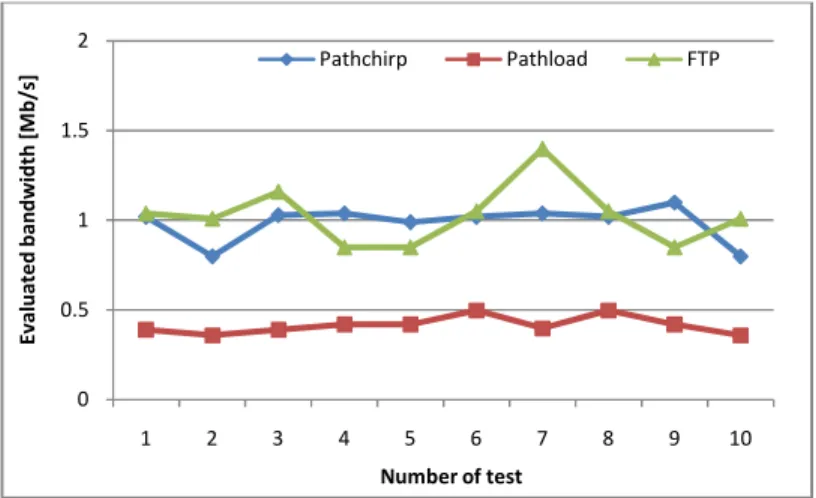
By comparing these techniques with the FTP technique, it was found that the data rate of the measured values with PathChirp are very close to the measured values with the FTP technique, but with the advantage of significantly faster convergence time.
Once the technique to derive the throughput estimates was identified, measurements on certain KPIs (Key Performance Indicators) were taken and presented in Section III. Following these measurements, the correlation values were also calculated between the received signal strength and other parameters measured, in order to assess how the latter were influenced by the signal strength level received.
In order to estimate the QoS in a Mobile Internet context, nowadays many measurements are carried out in motion on board a motor vehicle by identifying various test points along the route in which the measurements are taken. Obviously there are limitations: the measurements are limited only to areas accessible by a motor vehicle and they provide estimates of the QoS offered to a preset altitude from ground level, thus not providing any suggestions as to the possible variations in height.
The final idea is to apply this measuring mechanism aboard a drone, with the considerable advantage of being able to take measurements in areas not easily accessible and above all provide an overview of QoS in a 3D scene, with drone being able to take measurements even in height.
2.
STATE
O
FA
RTOn the one hand, recently we have been assisting to a relevant increase in the drone use in many different scenarios: inspection of large infrastructure for remote damage assessment and monitoring purposes [4], support for emergency operations, such as finding missing persons [5], support in rapid and effective organization of disaster recovery operations [6][7][8], applications for smart city contexts [9][10], and many other scenarios.
On the other hand, mobile networks are gradually becoming the predominant source of Internet access, so developers, researchers, network operators, and regulatory communities have taken an increased interest in measuring end-to-end mobile network performance [11][12].
The first approach to the use of drones in mobile network performance evaluation was already taken by employing drones carrying smartphones with network testing applications to analyze the KPIs and estimate the offered QoS [13].
In this paper, however, we propose a new method of network mobile performance evaluation, which is not based on a simple smartphone, but rather on a dedicated and optimized prototype installed on a drone.
3.
D
RONE-I
NTERNETT
ECHNOLOGYetc.As is well known, while our increasingly hyperconnected world brings many benefits, it also exacerbates inequalities for the share of the global population that has limited or no Internet access.
In some scenarios it is also essential to ensure Internet access as a backup to traditional solutions, consider, for special events such as earthquakes, the ground war actions, etc. where it is vital to ensure immediate coverage of Internet access.
Another equally important application area covers the drone as a multi-sensor mobile system that allows measurement of a parameter set. The benefit is a completely innovative spatial sampling method that becomes fundamental in many applications in which a greater spatial resolution of the measured data may be necessary.
Figure 1. Drone for civilian applications
Recently, much has been said of the drone-Internet combination as an innovative technology to expand Internet access in areas not reached by the traditional radio coverage for the delivery of services via Internet. Think of Google's top-secret Project SkyBender testing the viability of millimeter wave technology beamed from solar-powered Titan drones, in order to deliver 5G internet and other internet-over-the-air projects.
Mountain View has reportedly been experimenting with millimeter wave-based Internet. Millimeter waves are believed to be capable of transmitting data 40 times faster than LTE and could become the technology behind 5G internet.
Lately, though, two initiatives — Google Project Loon and Mark Zuckerberg’s internet.org — have drawn widespread attention to the challenge of using alternative delivery platforms to bring low cost broadband access to unserved or underserved parts of the world.
Project Loon plans to bring Internet access to remote locations via the network of high-altitude balloons. As Google describes it, “People can connect to the balloon network using a special Internet antenna attached to their building.”
Internet.org offers a similar approach, except instead of balloons, it envisions using drones as the delivery platform.
4.
D
ESCRIPTIONO
FT
HEP
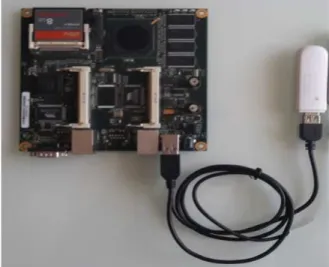
ROTOTYPETo perform our tests we developed a prototype by using a small form factor system boards optimized for wireless routing and network applications, an ALIX2D2 board [14], equipped with a 500 MHz AMD Geode LX800 CPU and 256 MB DDR DRAM on board; a USB Internet key has been used to provide cellular connectivity [15][16]; ZeroShell[17] has been used as the operative system whereas proprietary scripts have been developed by using bash and python language [18] to evaluate the available end-to-end bandwidth between the prototype and a remote server acting as the end point of the communication, RSSI, Round Trip Time (RTT) and standard deviation of RTT. A picture of the hardware employed to realize our prototype is shown in Figure 2.
Two algorithms have been implemented on board the prototype: PathLoad and PathChirp. Both algorithms evaluate the end-to-end bandwidth by means of the Self Loading of Periodic Streams (SloPS) technique and they are based on a client-server paradigm: the sender process runs on the mobile equipment whereas the receiver process runs on a remote host.
Figure 2. The prototype employed for our test bed.
The working principle of the Self Loading of Periodic Streams is very simple: it is based on the periodic transmission of packet streams from the source to the destination and on the consequent measurement of the One Way Delay (OWD), which is the time interval between the transmission of the data packet and its reception at the receiver side.
The number of packets transmitted increases until the growing one way delay; when this happens it means that the packet transmission rate is greater than the available bandwidth provided by the radio access network.
Figure 3. One way delay values of the ith packet train in the SloPS technique[3].
In PathLoad the measurement is obtained by iterative sending of a series of K packets of L bit each of which is transmitted during an interval of T seconds. In such a way the transmission rate is equal to R = L/T [bit/s]. Each packet of the series has a timestamp to indicate when the data packet has been created and sent to the receiver node. Once the destination node receives the packets stream it compares the arrival time (Ai) and the sending time (Si) of the packets in order to calculate the one way delay of the ith stream, i.e. Di = Ai – Si.
The sender and the receiver communicate according to the client-server paradigm in order to establish the available bandwidth. When one way delay at the destination side increases, in fact, the receiver process notifies the sender that behaves as follows:
a. If R(i) < A, the source process will send the following packets stream at R(i+1) > R(i) b. If R(i) > A, the source process will send the following packets stream at R(i+1) < R(i)
Furthermore, the rate of the stream (i+1) is established as follows [19]:
1. Two start parameters, RminedRmax, are initialized equal to zero and equal to the ideal maximum throughput provided by the connection Rmax;
o If R(i) < A then Rmin = R(i) o If R(i) > A then Rmax = R(i)
2. R(i+1) = (Rmax – Rmin)/2
The iterative process ends when Rmax – Rmin< w, where w indicates the value depending on the precision of the bandwidth evaluation procedure (obviously, the greater the w the less accurate the evaluation but, at the same time, the faster the convergence period required by the algorithm).
PathChirp is based on the same principle but, in this case, the algorithm does not need to send multiple trains of equally spaced data packets increasing at each step the transmission rate. PathChirp is based on the sending of trains of packets, called chirps, characterized by the fact that they are not equally spaced but, vice versa, the interval time between a packet and the next one gradually decreases according to the exponential distribution.
5.
P
ERFORMANCEE
VALUATIONA.Description of the Testbed
Tests have been classified into three scenarios which are considered to be of particular interest, especially for the study of how Throughput, Round Trip Time (RTT) and Standard deviation of RTT are related to the RSSI value: the first results refer to the condition of a high quality of the received signal in a high density of mobile users area; the second scenario, instead, refers to an urban context where the areas of particular concentration of users have not been crossed; finally, the last scenario proposes the measurements carried out in a extra-urban environment, where the received signal levels were very poor.
B.Metrics
The metrics taken into consideration to compare the duplication system and the commonly used single streaming transmissions can be summarized as follows.
To give a first evaluation of the QoS offered by the mobile radio access network, in our analysis, we focused on the measurement of the following parameters:
RSSI (Received Signal Strength Indicator) Throughput
Throughputevaluationlatency Round Trip Time
Mdev (standard deviation of RTT)
C.RSSI
In telecommunications, received signal strength indicator (RSSI) is a measurement of the power present in the received radiosignal. RSSI is usually invisible to a user of the receiving device. However, because signal strength can vary greatly, it has an impact on the functionality in wireless networking.
A mobile phone signal is the signal strength received by a mobile phone from a cellular network (on the downlink). This parameter can depend on several factors, such as the distance from the Base Station, any obstacle such buildings and trees, etc. So the signal strength can vary greatly.
Typically RSSI is measured in dBm. Another way to express RSSI is the Arbitrary Strength Unit (ASU).Arbitrary Strength Unit (ASU) is an integer value proportional to the received signal strength measured by the mobile phone.It is possible to map the real signal strength measured in dBm in ASU by means of mathematical relationship depending on the radio access technologyError! Reference source not found..
D.Throughput:
E.Throughput evaluation latency
In scenarios characterized by high user’s mobility or in other cases where the radio access network performance evaluation is carried out by using high mobility vehicles such as drones, the time needed to evaluate the throughput plays a key role in order to implement an effective and efficient measurement campaign; with this scope two well known throughput evaluation methods have been proposed under this perspective, comparing the time needed to converge with the estimated value and the latter with the value obtained by using the traditional file transfer protocol procedure.
F.RTT
The measurements of the Round Trip Time were carried out using the ICMP protocol. To get a fairly accurate measurement of RTT, each value was obtained by sending 30 packets with an interval of 0.2 sec from each other, for each of them RTT was calculated and finally the average value was estimated.
G.MDEV
It is the standard deviation, essentially the average measurement of how far each ping RTT is situated from the mean RTT. The higher mdev is, the more variable the RTT is (over time).This parameter, calculated using the same set of ICMP packets sent to the calculation of the average RTT, is an indicator of the homogeneity of the measured delays: the lower the value, the higher the homogeneity level of the delays.
A.Results
In this section the results obtained by the prototype are illustrated and the conclusions about the behavior of the measurement system are drawn.
Table 1. PathLoad and PathChirp comparison.
Test PathChirp [Mb/s] PathLoad [Mb/s] FTP [Mb/s] P.Chirp vs FTP [%] P.Load vs FTP [%]
1 1.13 0.45 2.1 46,2 78,6
2 1.17 0.48 1.4 16,4 65,7
3 0.93 0.92 1.02 8,8 9,8
4 0.92 0.5 0.73 26,0 31,5
5 0.87 0.5 1.44 39,6 65,3
6 0.82 0.57 1.09 24,8 47,7
7 0.67 0.47 0.92 27,2 48,9
8 0.96 0.29 1.01 5,0 71,3
9 0.99 0.4 1.21 18,2 66,9
10 0.78 0.67 1.46 46,6 54,1
11 1.02 0.39 1.04 1,9 62,5
12 0.8 0.36 1.01 20,8 64,4
13 1.03 0.39 1.16 11,2 66,4
14 1.04 0.42 0.85 22,4 50,6
15 0.99 0.42 0.85 16,5 50,6
16 1.02 0.5 1.05 2,9 52,4
17 1.04 0.4 1.4 25,7 71,4
18 1.02 0.5 1.05 2,9 52,4
19 1.1 0.42 0.85 29,4 50,6
20 0.8 0.36 1.01 20,8 64,4
Once found that the “Pathchirp” technique best approximates the throughput measured with an FTP session and converges quickly with this value; thus, the following results have been proposed in connection to the three previously mentioned scenarios.
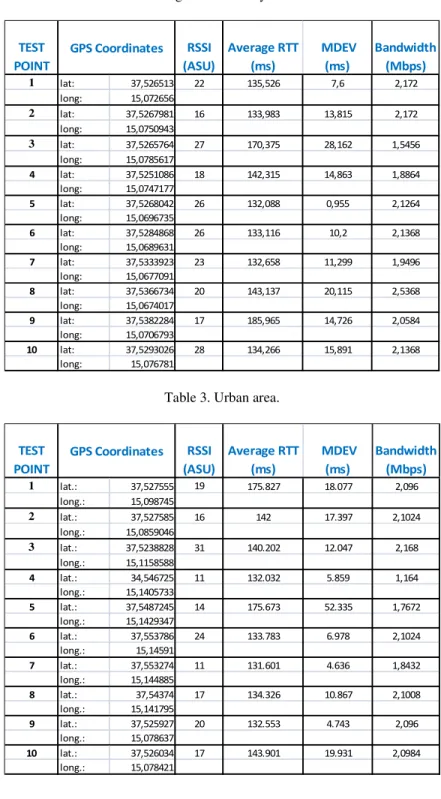
Table 2 shows the results obtained in a scenario with a high level of received signal and high concentration of mobile users. Table 3 shows the results obtained in an urban scenario.
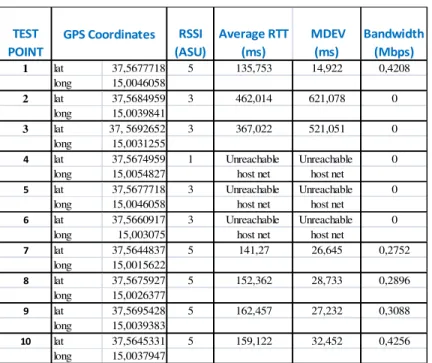
Finally, Table 4 shows the results obtained in an extra-urban scenario where the received signal level was very weak.
Figure 4 (a)Bandwidth evaluation with PathLoad and PathChirp compared with the effective value measured by means of a FTP session for the first 10 test points
0.0 0.5 1.0 1.5 2.0 2.5
1 2 3 4 5 6 7 8 9 10
E v a lu a te d b a n d w id th [ M b /s ]
Number of test
Figure 4 (b) Bandwidth evaluation with PathLoad and PathChirp compared with the effective value measured by means of a FTP session for the last 10 test points
Figure 5 Measurement time for FTP technique 0
0.5 1 1.5 2
1 2 3 4 5 6 7 8 9 10
E
v
a
lu
a
te
d
b
a
n
d
w
id
th
[
M
b
/s
]
Number of test
Pathchirp Pathload FTP
0 30 60 90
1 2 3 4 5 6 7 8 9 10 11 12 13 14 15 16 17 18 19 20
T
im
e
o
f
m
e
a
su
re
[
s]
Table 2. High users density urban area.
Table 3. Urban area.
TEST POINT
RSSI (ASU)
Average RTT (ms)
MDEV (ms)
Bandwidth (Mbps)
1 lat: 37,526513 22 135,526 7,6 2,172 long: 15,072656
2 lat: 37,5267981 16 133,983 13,815 2,172 long: 15,0750943
3 lat: 37,5265764 27 170,375 28,162 1,5456 long: 15,0785617
4 lat: 37,5251086 18 142,315 14,863 1,8864 long: 15,0747177
5 lat: 37,5268042 26 132,088 0,955 2,1264 long: 15,0696735
6 lat: 37,5284868 26 133,116 10,2 2,1368 long: 15,0689631
7 lat: 37,5333923 23 132,658 11,299 1,9496 long: 15,0677091
8 lat: 37,5366734 20 143,137 20,115 2,5368 long: 15,0674017
9 lat: 37,5382284 17 185,965 14,726 2,0584 long: 15,0706793
10 lat: 37,5293026 28 134,266 15,891 2,1368
long: 15,076781
GPS Coordinates
TEST POINT
RSSI (ASU)
Average RTT (ms)
MDEV (ms)
Bandwidth (Mbps)
1 lat.: 37,527555 19 175.827 18.077 2,096 long.: 15,098745
2 lat.: 37,527585 16 142 17.397 2,1024 long.: 15,0859046
3 lat.: 37,5238828 31 140.202 12.047 2,168 long.: 15,1158588
4 lat.: 34,546725 11 132.032 5.859 1,164 long.: 15,1405733
5 lat.: 37,5487245 14 175.673 52.335 1,7672 long.: 15,1429347
6 lat.: 37,553786 24 133.783 6.978 2,1024 long.: 15,14591
7 lat.: 37,553274 11 131.601 4.636 1,8432 long.: 15,144885
8 lat.: 37,54374 17 134.326 10.867 2,1008 long.: 15,141795
9 lat.: 37,525927 20 132.553 4.743 2,096 long.: 15,078637
10 lat.: 37,526034 17 143.901 19.931 2,0984
long.: 15,078421
To facilitate the understanding Indicators (throughput, RTT and with the RSSI.
The level of correlation was calcu
Given two statistical variables, covariance divided by the produc
where σxy is the covariance betw
The Pearson correlation coefficie
Generally, we can distinguish thr
• if ρxy> 0, variables X and Y
• if ρxy= 0, variables X and Y
• if ρxy< 0, variables X and Y
In addition, for direct correlation
• if 0 <ρxy< 0.3 we have a we
• if 0.3 <ρxy< 0.7 we have a m
• if ρxy> 0.7 we have a strong
TEST POINT 1 lat long 2 lat long
3 lat 3
long 4 lat long 5 lat long 6 lat long 7 lat long 8 lat long 9 lat long 10 lat long GPS Coord
Table 4. Suburban area.
g of how the RSSI values influence the other Key nd MDEV) we have calculated as these parameters we
lculated by means of the Pearson correlation coefficien
es, X and Y, the Pearson correlation index is defi uct of the standard deviations of the two variables:
ρxy =
tween X and Y, and σx and σyare the two standard devi
cient always takes values between -1 and 1
-1 ≤ρxy≤ 1
three types of correlation.
are called directly correlated; Y are uncorrelated;
are called inversely correlated.
on (and similarly for inverse correlation) we can distin
eak correlation; moderate correlation; ng correlation. RSSI (ASU) Average RTT (ms) MDEV (ms) Bandwidth (Mbps)
37,5677718 5 135,753 14,922 0,4208 15,0046058
37,5684959 3 462,014 621,078 0 15,0039841
37, 5692652 3 367,022 521,051 0 15,0031255
37,5674959 1 Unreachable Unreachable 0 15,0054827 host net host net
37,5677718 3 Unreachable Unreachable 0 15,0046058 host net host net
37,5660917 3 Unreachable Unreachable 0 15,003075 host net host net
37,5644837 5 141,27 26,645 0,2752 15,0015622
37,5675927 5 152,362 28,733 0,2896 15,0026377
37,5695428 5 162,457 27,232 0,3088 15,0039383
37,5645331 5 159,122 32,452 0,4256 15,0037947
oordinates
y Performance were correlated
ient.
efined as their
viations.
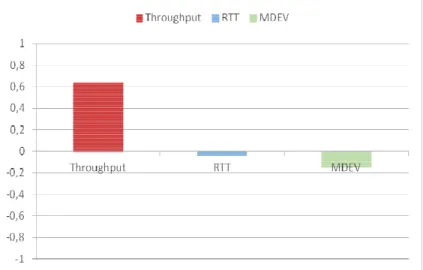
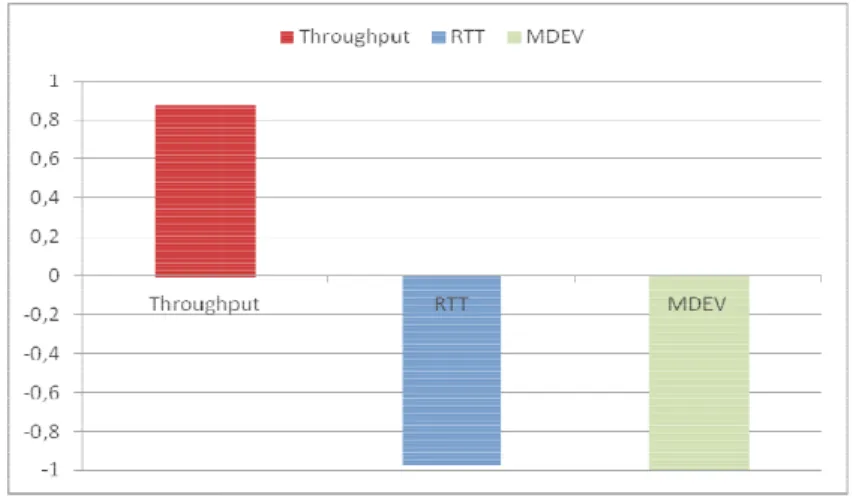
Figure 6: Correlation coefficie From the results obtained we can what was expected, there seem bandwidth.As already mentioned RSSI values and, especially, in a of a high level of commitment of should consider some additional the measured parameters.
Figure 7: Correlation coefficie
ient between RSSI and Throughput, RTT and MDEV for sc can evince how, in the case of the first test (Figure 6 eems to be no correlation between the values of
ed, these measurements were carried out in correspond n an area with a high concentration of mobile users, in of the Mobile Network resources. Consequently, in th
al variables not foreseeable in advance that considera
ient between RSSI and Throughput, RTT and MDEV for sc scenario 1
6), contrary to of power and ndence of high , in a condition these cases, we rably influence
Figure 8: Correlation coefficie These results certainly deserve fu it is not the signal strength receiv Round Trip Time values and their
Instead, by analyzing the results 7), we can see that, in this cas Available Bandwidth. In this cas crossing particularly "crowded" experience a range of variability decline to relatively low values considerably. It is evident that w value of available bandwidth.
As regards the values of RTT an results proposed are related to a s one can evince from the RSSI va
Due to the poor conditions of co measurement took too long. B bandwidth to zero when the mea low RSSI values (<= 3 ASU) lead
In this scenario, by observing th between RSSI and Available Ba available bandwidth, inverse corr
From the results obtained from t there is a correlation between th when the RSSI values drop to gra
In good received signal level co case, it was determined that it parameters measured but othe congestion, number of mobile us
ient between RSSI and Throughput, RTT and MDEV for sc further study, but seem to be enough to indicate that, eived to limit the available bandwidth, and neither to
eir deviation standard.
lts obtained in relation to the second series of measurem case, a higher correlation value was reached betwee
ase, the tests were carried out in a normal urban scen d" or "isolated" areas. Along the route, in additio ility of the much larger RSSI. As we can see, when the es (test points 4, 5, and 7), the measured bandwidth t when the RSSI drops below certain values it especial
and standard deviation, they are still clearly uncorrelate a suburban area with very poor cell coverage (Figure values, the received signal levels are very scarce.
coverage, measurements often failed, and at times th By convention, it was decided to put the value
easurement time exceeded 300 sec. It is also quite cl lead to a significant instability of Internet connectivity.
the correlation values we can see that there is a stron andwidth, RTT and MDEV (direct correlation betwe orrelation between RSSI and RTT and between RSSI a
the three series of proposed measurements we can c the RSSI and the measured parameters which beco gradually lower values.
conditions, the variables are decidedly uncorrelated t it is certainly not the signal power to influence ther parameters (e.g. traffic conditions, momenta users in the cell, etc.).
scenario 3 at, in this case, to influence the
rements (Figure een RSSI and enario, without ition, we could the RSSI values th value drops ially affects the
lated.The latest re 8). In fact, as
the bandwidth e of available clear that very ty.
ong correlation tween RSSI and I and MDEV).
n conclude that comes stronger
6.
C
ONCLUSIONSA
NDF
UTUREW
ORKSThe present paper provides an extended performance evaluation method of Quality of Service in mobile Internet access. In particular, the paper proposes an algorithm for the throughput estimate based on PathChirp technique, which we have seen to be preferable to PathLoad technique as it is able to better approximate measurements using the FTP technique and converges with the desired values in a significantly more rapid way. The convergence speed is a decisive factor especially if applied to a context in which the measurements are taken by the use of drones. The use of drones definitely has several advantages:
• possibility of moving in 3 dimensions and consequently greater spatial resolution of the measurements;
• ability to record measurements in not easily accessible areas; • carrying out measurements near the radio base station.
In contrast, a problem arises from the autonomy of the drone. Measurements must therefore be carried out respecting certain timing constraints precisely due to the autonomy of the drone in flight.During a single flight session it is possible to obtain several measurement points and therefore have a more precise estimate of the QoS and increased spatial resolution.
ACKNOWLEDGMENT
We would like to thank HELI-LAB S.r.l., drone aerial filming company, and VICOSYSTEMS S.r.l., company of telecommunications equipment design that has provided the modem-router multi-sensor on board the drone.
REFERENCES
[1] Vinay J. Ribeiro, Rudolf H. Riedi, Richard G. Baraniuk Jiri Navratil, Les Cottrell, “pathChirp: Efficient Available Bandwidth Estimation for Network Paths”, in Passive and Active Measurement Workshop, April2003
[2] Manish Jain, ConstatninosDovrolis, “Pathload: a measurement tool for end-to-end availabla bandwidth”, in Proc. Of Passive and Active Measurements (PAM) Workshop, 2002.
[3] R.S. Prasad, M.Murray, C.Dovrolis, K.Claffy, “Bandwidth Estimation: metrics, measurement techniques and tools”, IEEE Network, Nov 2003
[4] C. Eschmann, C.-M. Kuo, C.-H. Kuo, C. Boller,” High-resolution multisensory infrastructure inspection with unmanned aircraft systems”, International Archives of the Photogrammetry, Remote Sensing and Spatial Information Sciences, Volume XL-1/W2, 2013 UAV-g2013, 4 – 6 September 2013, Rostock, Germany
[5] Md. Arafatur Rahman, “Enabling drone communications with WiMAX Technology”, Information, Intelligence, Systems and Applications, IISA 2014, The 5th International Conference on
[6] LudovicApvrille, Yves Roudier, Tullio Joseph Tanzi, “Autonomous drones for disasters management: Safety and security verifications”,Radio Science Conference (URSI AT-RASC), 2015 1st URSI Atlantic
[7] Daniel Câmara, “Cavalry to the rescue: Drones fleet to help rescuers operations over disasters scenarios”, Antenna Measurements & Applications (CAMA), 2014 IEEE Conference on
[8] LudovicApvrille, TullioTanzi ; Jean-Luc Dugelay, “Autonomous drones for assisting rescue services within the context of natural disasters”, General Assembly and Scientific Symposium (URSI GASS), 2014 XXXIth URSI
[10] AislanGomideFoina Raja Sengupta ; Patrick Lerchi ; Zhilong Liu ; Clemens Krainer, “Drones in smart cities: Overcoming barriers through air traffic control research”, 2015 Workshop on Research, Education and Development of Unmanned Aerial Systems (RED-UAS)
[11] UtkarshGoel, Mike P. Wittie, Kimberly C. Claffy, and Andrew Le , “Survey of End-to-End Mobile Network Measurement Testbeds, Tools, and Services”, IEEE Communications Surveys & Tutorials (Volume:18 , Issue: 1 ), Ott. 2015
[12] AshkanNikravesh, David R. Choffnes, Ethan Katz-Bassett, Z. Morley Mao, and Matt Welsh, “Mobile Network Performance from User Devices: A Longitudinal, Multidimensional Analysis”, 15th International Conference, PAM 2014, Los Angeles, CA, USA, March 10-11, 2014, Proceedings [13]
http://company.nokia.com/en/news/press-releases/2015/07/07/nokia-networks-du-first-in-uae-to-use-telco-drones-for-better-network-planning-faster-optimization [14] http://www.pcengines.ch/alix.htm
[15] F. Beritelli, A. La Corte, C. Rametta and F. Scaglione “A Cellular Bonding and Adaptive Load Balancing based Multi-SIM Gateway for Mobile ad Hoc and Sensor Network” International Journal on Ad Hoc Networking Systems (IJANS), Vol. 5, No. 3, July 2015
[16] F. Beritelli, A. La Corte, G. Lo Sciuto, C. Rametta, F. Scaglione, “Adaptive VPN BondingTechnique for Enhancing Dual-SIM Mobile Internet Access”. Proc. of the International Symposium for Young Scientists in Technology, Engineering and Mathematics (SYSTEM) 2015, Catania, Italy, September 27-29, 2015.
[17] http://www.zeroshell.net [18] http://www.python.org/
[19] Manish Jain, ConstantinosDovrolis, “End-to-end Available Bandwidth: Measurements, Methodology, Dynamic and Relation with TCP Throughput”, IEEE/ACM Transactions on Networking, Ago 2003. [20] 3GPP TS 27.007 version 8.5.0 Release 8
AUTHORS
Francesco Beritelli received the Laurea degree in electronic engineering and the Ph.D. degree in electronics, computer science, and telecommunications engineering from the University of Catania, Catania, Italy, in 1993 and in 1997, respectively. From 1997 to 2000 in collaboration with CSELT (now Telecom Italia LAB) took an active part in international ITU-T standardization meetings. From 1998 he is founding member of the “Multimedia Technologies Institute - MTI”, applied research laboratory operating in DSP (Digital Signal Processor) and CTI (Computer Telephony Integration) applications. Currently, from 2002, he is Assistant Professor in the Department of Electric, Electronic and Computer Science Engineering at the
University of Catania. His main research activities are in the area of robust audio and speech signal classification and recognition, variable bit-rate speech coding, and adaptive-rate voice and dual stream transmission for mobile IP telephony applications, QoS in mobile Internet access and drone communications. His interests also include the field of biometric identification and cardiac signal processing. He is member of the Institute of Electrical and Electronic Engineers (IEEE) and the “IEEE Signal Processing Society” since 1996 and has 120 scientific publications, mainly in international journals, books and conference proceedings.
Antonio Raspanti founder of Heli-Lab,drone aerial filming company. His research interests include drone communications and performance evaluation techniques for mobile Internet access.
Michele Russo received the Laurea degree in Computer Science Engineering from the University of Catania, Italy, in 2010. His research interests include IoT systems, VoIP Gateway (SIP compliant) and ICT technologies for environmental control and monitoring.
Francesco Scaglionereceived the Laurea degree in Telecommunications Engineeringfrom the University of Catania in 2011. His research interests include embedded systems,VoIP communications and ICT technologies for environmental control and monitoring.

![Figure 3. One way delay values of the i th packet train in the SloPS technique [3] .](https://thumb-eu.123doks.com/thumbv2/123dok_br/16405865.194001/5.918.303.619.129.313/figure-way-delay-values-packet-train-slops-technique.webp)
![Table 1. PathLoad and PathChirp comparison. Test PathChirp [Mb/s] PathLoad [Mb/s] FTP [Mb/s] P.Chirp vs FTP [%] P.Load vs FTP [%] 1 1.13 0.45 2.1 46,2 78,6 2 1.17 0.48 1.4 16,4 65,7 3 0.93 0.92 1.02 8,8 9,8 4 0.92 0.5 0.73 2](https://thumb-eu.123doks.com/thumbv2/123dok_br/16405865.194001/8.918.274.654.157.582/table-pathload-pathchirp-comparison-test-pathchirp-pathload-chirp.webp)