DOI : 10.5121/ijcsit.2011.3404 45
Archana.S
1and Sridhar.S
21
Department of Information Science and Technology, College of Engineering, Guindy
2
Department of Information Science and Technology, College of Engineering, Guindy
A
BSTRACTThis paper proposes a complete framework based on fuzzy logic, for the retrieval of MRI images of the brain. In our system, the MRI image is segmented using the fuzzy local information c means (FLICM) algorithm. Region, location and shape properties are extracted from each region. These properties are represented as fuzzy features. Thus each image is represented by a set of fuzzy features corresponding to the various regions obtained after segmentation. To compute the overall similarity between two images, unified feature matching (UFM) is used. This measure integrates the properties of all the regions in an image. Our system can be applied to distinguish between the tumor and normal magnetic resonance images. Also the location feature of each region, especially of the tumor region, obtained after segmentation can be used to determine the type and symptoms of the brain tumor. Images from the brain web were used for experimentation.
K
EYWORDSFuzzy logic, Segmentation, Clustering, Feature Matching, Fuzzy Similarity
1. INTRODUCTION
These days, the amount of medical data generated in the form of images is increasing tremendously. These images of various imaging modalities like computer tomography and Magnetic Resonance Imaging are generated daily. They are used by researchers and doctors for decision making. The development of systems for managing and archiving of these data is becoming a strenuous job. These data if organized properly can be used for aiding the doctors in diagnosis procedures.
Magnetic Resonance Imaging is an imaging technique that is useful for distinguishing the various soft tissues of the body. This technique is used for imaging brain, heart and other muscles. While this technique is advantageous compared to Computed Tomography (CT) and X ray techniques, there arise certain issues.
46
For effective organization these MR images are stored in databases. The existing databases make use of a simple keyword based querying techniques. These databases are dependent on data entry. There may be manual errors in these databases. This kind of retrieval is highly insufficient. In order to make the database more useful we need a content based retrieval system (CBIR). The content based retrieval systems make use of the properties in the images for indexing and retrieval. The features of the images need to be used rather than simply labels for efficient diagnosis.
The aim is to develop a fuzzy framework for effective retrieval of images.The first step in any kind of image analysis is the image segmentation. The segmentation of the brain MRI to distinguish between the tumour and normal tissues has been under research for long years. To automate the entire system unsupervised clustering [2] is used for the segmentation of the brain MRI images. This partitions the image into different regions. After segmentation the features are extracted from each region and a fuzzy representation of the image is obtained. Then the unified feature matching [3] is used for integrating the properties of all the regions in the image.
2. FUZZY FRAMEWORK
The main aim is to develop an operational fuzzy framework for the retrieval of brain MR Images. This framework helps to distinguish between tumour and non tumour images. Also retrieves tumour images based on the location of the tumour. This location information is very useful to the diagnosis as the symptoms, type and treatment of the tumour varies with the location of the tumour.
The framework consists of the following stages: 2.1 Image Pre-processing and Segmentation 2.2 Feature Extraction
2.3 Fuzzy Feature Representation 2.4 Unified Feature Matching
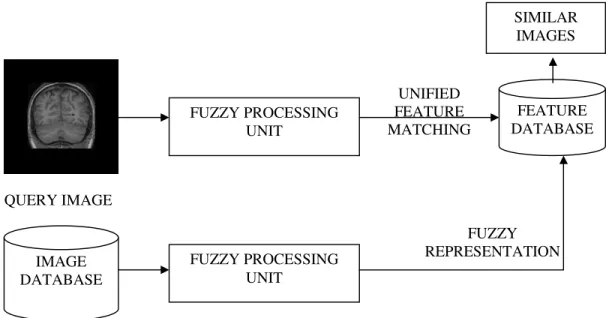
The system architecture is given below:
QUERY IMAGE
Figure 1.System Architecture FUZZY PROCESSING
UNIT
FEATURE DATABASE UNIFIED
FEATURE MATCHING
IMAGE DATABASE
FUZZY PROCESSING UNIT
SIMILAR IMAGES
47
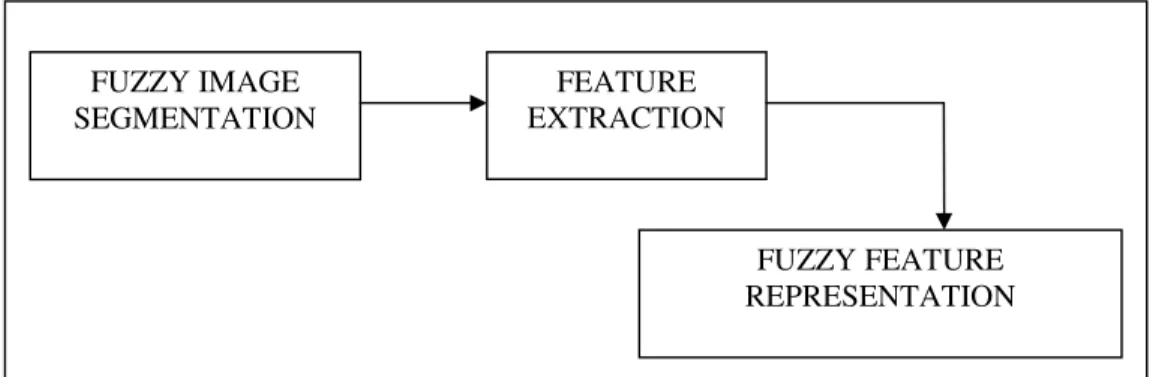
The Fuzzy Processing Unit is given below:
Figure 2. Fuzzy Processing Unit
2.1. Image Pre Processing and Segmentation
2.1.1 Image Pre Processing
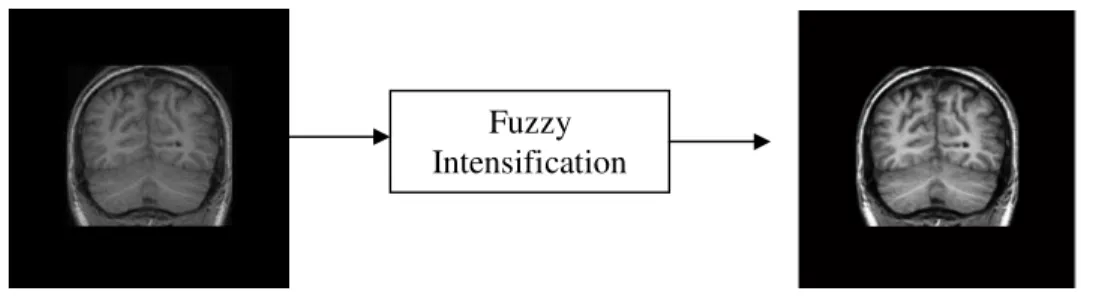
The pre processing is done to improve the contrast of the brain MR image. This is done using a Fuzzy Intensification operator [4]. For an image I, the grey level at (m, n) is given by gmn , and the maximum and minimum value of the grey level is given by gmaxand gmin. The membership function is defined as
max
m 1
e F mn n
d
g g
F
µ
−
−
= +
Where Fdand Feare the denominational and the exponential fuzzifiers respectively that controls the amount of greyness ambiguity. The membership values are modified using the intensification operator,
[
]
2 '2
2 , 0 0.5
= 1-2[1- ] , 0.5 1
mn mn mn
mn mn
µ
µ
µ
µ
µ
= ≤ ≤
≤ ≤
Once the membership values are modified, modified grey values are transformed to spatial domain using an inverse function,
' 1 '
( )
mn mn
g G−
µ
=
Where,
1 '
( mn)
G−
µ
1 '
max [( ) 1]
e F d mn
g F
µ
= − −
FUZZY IMAGE SEGMENTATION
FEATURE EXTRACTION
48
Brain MR Image Contrast Enhanced Image
Figure 3. Contrast Enhancement
2.1.2 Fuzzy Segmentation
The segmentation of the contrast enhanced image is done using five algorithms, Fuzzy C Means, Enhanced Fuzzy C Means, Suppressed Fuzzy C Means, Fast Generalized Fuzzy C Means and Fuzzy Local Information C Means. The algorithms differ by their objective functions. All the algorithms, except fuzzy c means, incorporate the local and spatial information into their objective functions. The results of segmentation are compared with the manually segmented images from the Internet Brain Segmentation Repository.
Of the five algorithms considered the Fuzzy Local Information C Means is found to be the most effective in terms of the Correlation Index and Mean Squared Error.
The correlation index is given by,
2 2
( )( )
( ( ) )( ( ) )
mn mn
m n
mn mn
m n m n
A A B B
r
A A B B
− −
=
− −
Table 1. Correlation Index of various images
Image # FCM EnFCM FCM_S FGFCM FLICM
1 0.5117 0.6568 0.6569 0.6971 0.8234
2 0.5665 0.6490 0.6565 0.7012 0.7980
3 0.5521 0.6321 0.6754 0.7080 0.8010
4 0.5612 0.6540 0.6901 0.7122 0.8011
5 0.5211 0.6321 0.7010 0.7432 0.8760
The above table indicates that the Fuzzy Local Information C Means is superior to the other algorithms under consideration. Thus we use the same for the segmentation module.
49
Normal Image
Segmented Regions of the Image
Figure 4. Fuzzy Local Information C Means Segmentation of normal image
Tumour Image
Segmented Regions
Figure 5. Fuzzy Local Information C Means Segmentation of the Tumour Image Fuzzy Local
Information C Means
50
2.2. Feature Extraction
The regions of the image are then subject to feature extraction. The features such as the Hu moments [7], normalized inertia and location features [8] are extracted. Normalized inertia of order
γ
is calculated for each region Rj given as,(
) (
2)
2 /2( , )
( , ) 1 /2
( )
j j
x y R R
j
x x y y
I V R γ γ γ ∈ + − + − =
Where ( , )x y is the centroid of Rj, V(Rj) is the volume of Rj. The normalized inertia is invariant to rotation and scaling.
2.3. Fuzzy Feature Representation
The feature vectors obtained above are very long since each region is subjected to feature extraction. Also the features are subjected to segmentation related uncertainties. To overcome these drawbacks we develop a fuzzy feature representation based on the Cauchy membership function. The segmented image can be viewed as a collection of regions {R1, R2, .., Rn}. Equivalently in the feature space as {F1, F2, .., Fn}.
Each region Rj is represented by the centre (fj) of the corresponding feature set (Fj) with (fj) defined as
( ) ( ) j f F j j f f V F ∈ =
Which is essentially the mean of all elements of (Fj). Accordingly, region is represented by fuzzy feature Fj whose membership function,
( ) 1
1 ( )
j F j f f f f d α
µ
= − + Where, 1 1 1 2 ( 1) C Cf i k
i k i
d f f
C C
−
= = +
= −
−
51
2.4. Unified Feature Matching
The UFM scheme characterizes the resemblance between images by integrating the properties of all the regions in the images.
Let us assume we have 2 fuzzy feature sets A and B with Cauchy membership functions
1 ( )
1 ( )
A x x u d α α
µ
= − + And 1 ( )1 ( )
B b x x v d α
µ
= − +The fuzzy similarity can be written as,
( ) ( , ) ( ) a b a b d d
S A B
d d u v
α α α + = + + −
Having the similarity measure, the similarity vector is constructed. For every Ai∈A, we define the similarity measure for it and B as
, 1 ( ) b C B i i j j
l S A B
−
=
Combining we get a vector,
1 2
[ , ,..., ] a B B B B T
C
l = l l l
Similarly for every ,Bj∈B,the similarity measure for it and A as,
, 1 ( ) a C A j j i i
l S B A
−
=
Combining we get a vector,
1 2
[ , ,..., ] b A A A A T
C
l = l l l
Thus, we define a similarity vector for A and B denoted by ( , ) B A B A l L l = .
52
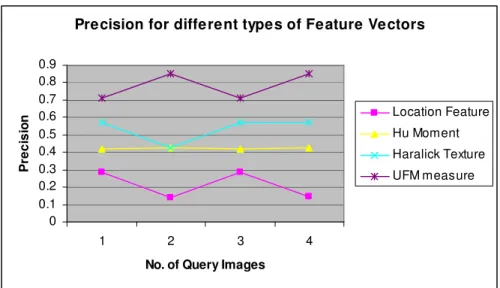
It can be analysed by the following graphs:
Precision for different types of Feature Vectors
0 0.1 0.2 0.3 0.4 0.5 0.6 0.7 0.8 0.9
1 2 3 4
No. of Query Images
P
re
c
is
io
n Location Feature
Hu Mom ent
Haralick Texture
UFM m eas ure
Figure 6. Precision Graph of UFM and other feature vectors
3. EXPERIMENTAL RESULTS
In order to test the frame work the MR image slices from the Internet Brain Segmentation Repository and the Brain Web are used. Around 400 image slices of resolution 256x256 are used.
The system is implemented using MATLAB on a 1.6Ghz Intel(R) Core(TM) 2Duo CPU with 3GB of RAM. The Matlab is a Matrix laboratory and it is a high-performance language for technical computing integrates computation, visualization, and programming in an easy-to-use environment.
We evaluate the system using the standard precision and recall measures. Precision is defined as the proportion of the relevant documents in a set of documents retrieved by the search.
of Relevant Images No of Retrieved Images
No P=
Recall is defined as the number of relevant documents retrieved as fraction of all relevant documents.
No of relevant images retrieved R=
Total No. relevant images in Database
53
PRECISION RECALL GRAPH
0 0.1 0.2 0.3 0.4 0.5 0.6 0.7 0.8 0.9
0.5 0.6 0.4 0.3
RECALL
P
R
E
C
IS
IO
N
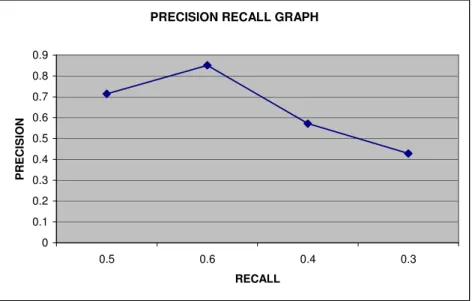
Figure 7. Precision Recall Graph Table 2. Precision Recall Values
Image Query Precision Recall
1 0.714 0.5
2 0.851 0.6
3 0.571 0.4
4 0.428 0.3
Query Image with Tumour on the left
Output containing best six results with tumour on the left
54
4. CONCLUSIONS AND FUTURE WORK
Thus the system was implemented successfully in MATLAB. The database contains 250 normal and 150 tumour images. The resolution of these images is 256x256.A query by example scheme of retrieval was used. Since the location feature of each region is given more importance, the similar images with tumour on the same side as the test image are retrieved. The location of the tumour is very important in determining the type, treatment and symptoms of the tumour.
The system uses fuzzy logic at all stages in the framework. The Fuzzy Local Information C Means (FLICM) algorithm used for segmentation yielded an average correlation index of 0.80. This was higher than the rest of the segmentation algorithms considered. The combination of various features for matching yielded better results than individual features. The precision factor was as high as 80 percentage. The experimental results at each stage (from segmentation to feature matching) show that the fuzzy logic yields better results than the conventional techniques. The Unified Feature Matching technique helps us in giving more importance to specific features while including all the features.
The system can help or aid in the diagnosis if the profile information of the patient and the report of the MR image are included in the database along with the images. Also the fuzzy clustering algorithms may be improved by using the features of the MR images rather than just intensity alone. Other membership functions can be used in place of the Cauchy membership function for the feature matching. Weights can be varied for different features depending on the application. Our system gives importance to the location of the tumour. Another application may give importance to size of tumour.
REFERENCES
[1] L. Zadeh , “Fuzzy sets”, IEEE Transactions on Information Control, vol. 8,1965, pp. 338–353.
[2] Zheru Chi, Hong Yan, Tuan Pham, “Fuzzy algorithms: with applications to image processing and pattern recognition”, World Scientific Publishing Co. Pvt. Ltd, vol. 10,1996, pp. 85-91.
[3] Yixin Chen, James Z. Wang , “ A region based Fuzzy Feature Matching Approach to Content Based Image Retrieval”, IEEE Transactions on Pattern Analysis and Machine Intelligence,vol. 24,2002,pp. 1252-1266.
[4] Tamalika Chaira, Ajoy Kumar Ray, “ Fuzzy Image Processing and Applications with MATLAB”, CRC Press, vol. 1, 2010,pp. 47-55.
[5] Stelios Krinidis and Vassilios Chatzis, “A robust fuzzy local information C-Means Algorithm”, IEEE Transactions on Image Processing, vol.19,2010,pp. 1328- 1337.
[6] Robert.M.Haralick, K.Shanmugam,Its’hak Dinstein,”Textural Features for Image Classification”,IEEE Transactions on Systems, Man and Cybernetics,vol. 6,1973,pp.610-621.
[7] Hu, M. K., “Visual pattern recognition by moments Invariants”, IRE Trans. Information Theory,vol. 8,1962,pp. 179-187.
[8] B.G.Prasad, K.K.Biswas and S.K. Gupta, “Region-based image retrieval using integrated color, shape, and location index”, Computer Vision and Image Understanding, vol. 94, (2003),pp 193-233.
[9] Images:http://www.bic.mni.mcgill.ca/brainweb/
55
[11] Images-http://www.cma.mgh.harvard.edu/ibsr/ Authors
[1] S.Archana has completed her Post Graduation in Multimedia Technology. Her area of interest includes Image processing and Data Structures.