MRI Brain Image Tissue Segmentation
analysis using Possibilistic Fuzzy C-means
Method
*
A.Rajendran
Professor, Department of ECE, Sriguru institute of Technology Coimbatore,Tamilnadu, India
E-mail: [email protected]
Dr.R.Dhanasekaran
Professor, Director-Research, Syed Ammal Engineering College Ramanathapuram, Tamilnadu, India
E-mail:[email protected]
*
Corresponding author: Email: [email protected]
Abstract - In this paper, we analyzed the segmentation of MRI brain image into different tissue types on brain image using Possibilistic fuzzy c-means (PFCM) clustering. Application of this method to MRI brain image gives the better segmentation result in compare with Fuzzy c-mean (FCM) and fuzzy possibilistic c-means (FPCM). The results are verified quantitatively using similarity metrics, false positive volumes function (FPVF) and false negative volume functions (FNVF).These values are shows that PFCM segments the tumor class effectively. This is achieved by effectively utilizing the membership and possibility (typicality) function in the PFCM.
Key words: Image Segmentation, Brain image, MRI, Fuzzy c-means, Volume metrics
I. INTRODUCTION
The task of segmentation is to partition a digital image into multiple segments [1] and to simplify and/or change the representation of an image to be more meaningful and easier to analyze more precisely. Image segmentation is the process of assigning a label to pixel in an image such that pixels with same label share similar visual characteristics and properties[2].In medical image segmentation ,structures of interest for segmentation include organs, parts of pathology, abnormalities (such as brain tumors) and normal brain tissues, namely, white matter (WM),gray matter(GM), cerebrospinal fluid(CSF).
We divide MRI brain image segmentation methods into eight categories based on [3]: Thresholding approaches, Region growing approaches, classifiers, clustering approaches, Markov random field models, artificial neural networks, deformable models, and atlas guided approaches.
Due to the above problems, those methods are not used for MRI brain image segmentation. So, in this paper, we applied the medical images to Possibilistic fuzzy c-means (PFCM) clustering method to segment the brain into different tissue effectively. In this method effect of noise is overcome by incorporating possibility (typicality) function in addition with membership function. Consideration of these constraints can greatly control the noise in the image as shown in our experiments.
II. PFCM METHOD FOR MRI BRAIN TISSUE SEGMENTATION
First, we discuss about FCM, PCM, FPCM clustering algorithm then we analyzed the PFCM method for MRI image segmentation.
Clustering is the partitioning of unlabeled data set X = {x1, x2, ..., xn} into 1 < c < n classes, by assigning labels to the vectors in X. A c-partition of X is a set of (cn) values uij that can be represented as a (c × n) matrix U = [uij] .The value uij denotes the membership degree of sample xj to class i.
One of the most widely used clustering methods is the FCM algorithm [13]. The FCM algorithm assigns memberships to xj which are related to the relative distance of xj to the c points prototypes V = {vi} that
are class centers in the FCM. This relative distance metric is
D
2(
x
j,
v
i)
D
ij2
x
j
v
i 2 .FCM algorithm has some problems that have limited its application. They are, very sensitive to noise and membership functions are not decreasing with respect to the distance to the class center. To overcome this problem, a new clustering method named possibilistic c -mean (PCM) was proposed by [10-11].In this algorithm the objective function is modified and the normalization constraint,
c 1
i ij 1, j , is not considered and each element of j’th column can be any number between 0 and 1 (at least one of them is non zero). The authors named the value µij as typicality (typicality of xj relative to cluster i). In fact each row of U is a possibility distribution over X. However this algorithm also has some problems. It is very sensitive to initialization and sometimes coincident clusters will occur. In addition it is very sensitive to additional parameters in this model.
To address the problems of FCM and PCM a new fuzzy possibilistic c-mean (FPCM) algorithm was proposed in [12] by combining these two algorithms. In data classification, both membership and typicality are mandatory for data structures interpretation and FPCM computes these two factors simultaneously. FPCM solves the noise sensitivity defect of FCM and overcomes the problem of coincident clusters of PCM. The objective function of FPCM is written as:
2ij
c
1 i
n
1 j
ij m ij
m
(U,
T,
V;
X)
(
t
)
D
J
(1)Where m>1, િ>1, 0≤µij≤1, 0≤tij≤1,
c
1 i
ij
1
,
n
1 j
ij
1
t
andD
2(
x
j,
v
i)
D
2ij
x
j
v
i 2
(║.║ is any inner product norm). Here T = [tik] is the typicality matrix. Although FPCM is less prone to the problems of FCM and PCM, in the case of a large data set such as medical MRI image, this algorithm does not work properly (it operates such as FCM), because FPCM normalizes the possibility values, so that the sum of typicality of all data points in each row of U is one. Hence the typicality values are very small in large data sets.
To address the problems of FPCM a new possibilistic fuzzy c-mean (PFCM) algorithm was proposed in [14].In this algorithm the constraint of the typicality values has been relaxed to overcome the problem of FPCM. So, we have been taken PFCM method for analysis of MRI brain images for tissue segmentation .The objective function of PFCM is written as:
c1 i
n
1 j
ij 2
ij c
1 i
n
1 j
ij m ij
m
(U,
V,
T;
X)
(a
bt
)
D
i
(
1
t
)
J
(2)Where
D
2(
x
j,
v
i)
D
ij2
x
j
v
i 2
c
1
defined by the constants a and b. If a = 1, b = 0 and γi = 0,
j
,
PFCM reduces to FCM and if a = 0 and b = 1, it reduces to PCM.The necessary condition for Jm in Equation(2) to reach a minimum can be found by taking first derivative of it with respect to µ,v,t and set it to zero. Then three necessary conditions are as follows,
The membership function:
1 1 / 2 1
m c k kj ij ij D D (3)
Typicality: 1 1 2 ij i ij
D
b
1
1
t
(4)Cluster center:
n 1 j ij m ij j n 1 j ij m ij i)
bt
(a
x
)
bt
(a
v
(5)In [15] the following equation is suggested to compute typicality deciding parameter γi:
1
>
,
Κ
μ
D
μ
Κ
γ
n 1 j m ij n 1 j 2 ij m ij i
(6)III. PFCM ALGORITHM FOR MRI BRAIN IMAGE TISSUE SEGMENTATION
The algorithm for carrying out PFCM for segmentation of MRI brain images can now be stated from the following steps,
1. Select the number of clusters ‘C’ and fuzziness factor ‘m’
2. Select initial class center prototypes v={vi};i=1,2….C, randomly and ε ,a very small number 3. Update membership function µij using equation (3)
4. Update the value of . γi using equation (6) 5. Update typicality using equation (4)
6. Update cluster centre using equation (5)
7. Repeat steps 3 to 6 until termination. The termination criterion is as follows
║vt+1-vt║≤ ε, where‘ t’ is the iteration steps, ║.║ is the Euclidean distance norm. IV. EXPERIMENTAL RESULTS AND DISCUSSION
The PFCM algorithm has been implemented in MATLAB under Windows XP system. We applied this algorithm on the simulated MRI image obtained from the brain web simulated brain database and brain images with tumor for testing. We compared the algorithm with FCM and FPCM results shows that PFCM algorithm performs better, because of inclusion of membership, typicality.
A. Testing on Simulated MRI Brain Image
We have applied the method to simulated T1-weighted normal brain MR image obtained from brain web. The segmentation results into four tissue classes, which corresponds to background, CSF, WM and GM obtained by FCM, FPCM and PFCM as shown in Figure 1d , Figure 1e and Figure 1f.The original image, original image corrupted with 9% Gaussian noise and ground truth image shown in Figure 1a, Figure 1b and Figure 1c. Visually segmentation result by PFCM method is better than other two methods.
The evaluation of segmentation performance is also carried out quantitatively by employing three volume metrics namely, the similarity index(S), false positive volume function (FPVF), false negative volume function (FNVF) in our experiment.
The similarity index is an intuitive and clear index to consider the matching pixel between Ai and Bi, and defined as
i i
i i
B A
B A 2 S
Similarity index S> 70% indicates an excellent similarity[16].
The false positive volume function (FPVF) represents the error due to the misclassification in class i and the false negative volume function (FNVF) represents the error due to the loss of desired pixels of class i, they are defined as follows,
Figure 1: Comparison results of segmentation of image into 4 classes on a simulated T1-weighted normal brain MR image :(a) Original image (b) One axial slice of the original image with 9% Gaussian noise (c) Ground truth image; Segmentation results using (d) FCM (e) FPCM (f)Our PFCM
i i i i
A B A B
FPVF
i i i i
A B A A
FNVF
Higher value of S, and lower value of FPVF, FNVF gives better segmentation result.
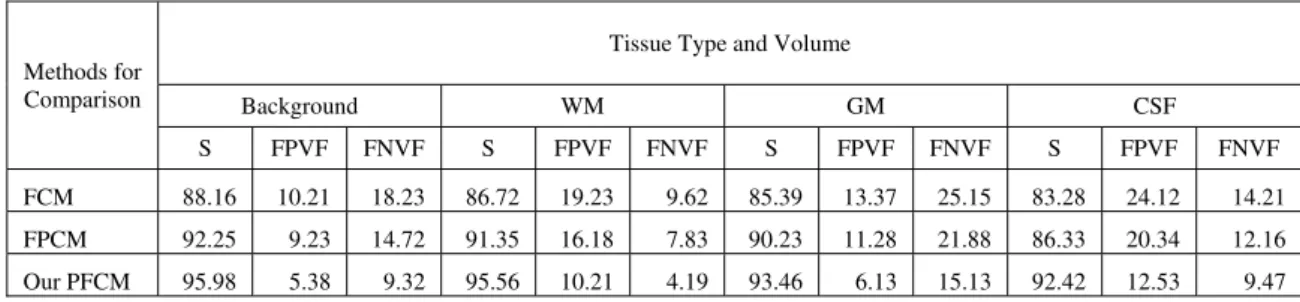
The comparison result of three volume metrics for four tissue classes, which corresponds to background, CSF, WM, GM as shown in Table 1. This Table 1compares the PFCM method with FCM and FPCM method. From this table, we can see that the similarity metrics of PFCM method is greater than other two methods for all 4 tissue types. Hence, the overlap degree between segmentation result and the ground truth is higher. FPVF and FNVF values also very less in comparisons with other two method. It shows misclassification and loss of desired pixels of tissue classes (background, CSF, WM, GM) is reduced. It clearly demonstrates that PFCM method has a better a segmentation performance than other two.
TABLE 1. QUANTITATIVE COMPARISON RESULT OF THREE VOLUME METRICS FOR FOUR TISSUE CLASSES
B. Testing on MRI Brain tumor Image
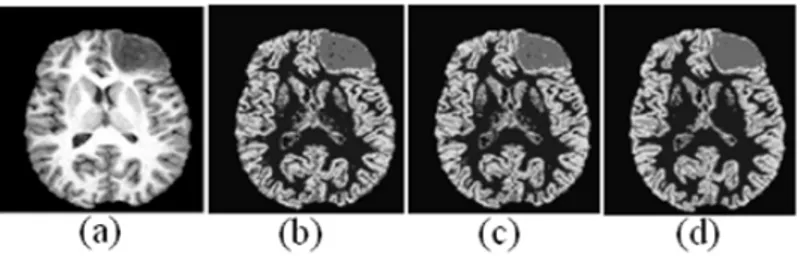
We applied our proposed algorithm to segment non-enhanced tumor on contrast enhanced T1-weighted image (Pathological brain image). In this case, we segmented the brain into five classes: namely, CSF, WM, GM, tumor and background. The results obtained by FCM, FPCM and PFCM are as shown in Figure 2b and Figure 2c and Figure 2d. One axial slice of the original contrast enhanced T1-weighted image with
non-Methods for Comparison
Tissue Type and Volume
Background WM GM CSF
S FPVF FNVF S FPVF FNVF S FPVF FNVF S FPVF FNVF
FCM 88.16 10.21 18.23 86.72 19.23 9.62 85.39 13.37 25.15 83.28 24.12 14.21
FPCM 92.25 9.23 14.72 91.35 16.18 7.83 90.23 11.28 21.88 86.33 20.34 12.16
enhanced tumor shown in Figure 2a. The images are removed of extra-cranial tissues prior to segmentation using morphological operations [1].Visually segmentation result by PFCM is better.
Figure 2: Comparison results of segmentation of image into 5 classes on a contrast enhanced T1-weighted image with non-enhanced tumor: (a) one axial slice of the original contrast enhanced T1-weighted image with non-enhanced tumor; Segmentation results using (b) FCM (c) FPCM (d)Our PFCM
V. CONCLUSION
We tested the algorithm on simulated MRI Brain image and finally pathological brain image affected by non enhanced tumor. We compared our experimental result with FCM and FPCM to demonstrate superiority of our algorithm. The quantitative validation is applied to segmentation results to evaluate the performance of the method. From the quantitative evaluation and the visual inspection, we can conclude that PFCM algorithm yields more superior segmentation result than other two methods for all tested images.
REFERENCES
[1] Gonzalez, R. C., Woods, R. E. Digital Image Processing, 2nd Edition. Prentice Hall (2002). [2] Shapiro, L. G., Stockman, G. C. Computer Vision. Prentice Hall (2001).
[3] Pham DL, Xu CY, Prince JL. A survey of current methods in medical image segmentation. Ann Rev Biomed Eng, 2 (2000), pp.315–37 [Technical report version, JHU/ECE 99-01, Johns Hopkins University].
[4] Ahmed, M. N., Yamany, S. M., Mohamed, N., Farag, A. A., and Moriarty, T. (2002). A modified fuzzy C-means algorithm for bias field estimation and segmentation of MRI data. IEEE Transactions on Medical Imaging, 21(3), pp.193–199.
[5] Ma, L. and Staunton, R. C. (2007). A modified fuzzy c-means image segmentation algorithm for use with uneven illumination patterns. Pattern Recognition, 40(11), pp.3005–3011.
[6] Shen, S., Sandham, W., Granat, M., and Sterr, A. (2005). MRI fuzzy segmentation of brain tissue using neighborhood attraction with neural-network optimization. IEEE Transactions on Information Technology in Biomedicine, 9(3), pp.459–467.
[7] Chuang, K. S., Tzeng, H. L., Chen, S., Wu, J., Chen, T. J.(2006). Fuzzy c-means clustering with spatial information for image segmentation. Computerized Medical Imaging and Graphics,30, pp.9-15.
[8] Liu KC-R, Yang M-S, Liu H-C, Lirng J-F, Wang P-N (2003). Generalized Kohonen’s competitive learning algorithm for ophthalmological MR image segmentation. Magnetic Resonance Imaging 21, pp.863– 70.
[9] Hou Z, Qian W, Huang S, Hu Q, Nowinski WL (2007). Regularized fuzzy cmeans method for brain tissue clustering. Pattern Recognition Letters 28, pp.1788–94.
[10] Krishnapuram, R. and Keller, J. M. (1993). A possibilistic approach to clustering. IEEE Transactions on Fuzzy Systems, 1(2), pp.98– 110.
[11] Krishnapuram, R. and Keller, J. M. (1996). The possibilistic c-means algorithm:insights and recommendations. IEEE Transactions on Fuzzy Systems, 4, pp.385–393.
[12] Pal, N. R., Pal, K., and Bezdek, J. C. (1997). A mixed c-means clustering model. In IEEE International Conference on Fuzzy Systems, volume 1, pages 11–21.
[13] Bezdek, J. C., Hall, L. O., Clark, M. C., Goldgof, D. B.,Clarke, L. P. (1997). Medical image analysis with fuzzy models. Statistical Methods in Medical Research, 6, pp.191-214.
[14] Pal, N. R., Pal, K., Keller, J. M., and Bezdek, J. C. (2005). A possibilistic fuzzy c-means clustering algorithm. IEEE Transactions on Fuzzy Systems, 13(4), pp.517–530.
[15] Krishnapuram, R. and Keller, J. M. (1996). The possibilistic c-means algorithm:insights and recommendations. IEEE Transactions on Fuzzy Systems, 4, pp.385–393.