©2013 Science Publication
doi:10.3844/ajassp.2013.1439.1447 Published Online 10 (11) 2013 (http://www.thescipub.com/ajas.toc)
Corresponding Author: Bridget Nirmala, J., Department of Computer Science and Engineering, St. Michael College of Engineering
and Technology, Kalayarkoil, Tamil Nadu, India
1439
Science Publications AJAS
AMELIORATE FUZZY C-MEANS: AN AMELIORATE
FUZZY C-MEANS CLUSTERING ALGORITHM
FOR CT-LUNG IMAGE SEGMENTATION
1
Bridget Nirmala, J. and
2S. Gowri
1Department of Computer Science and Engineering,
St. Michael College of Engineering and Technology, Kalayarkoil, Tamil Nadu, India
2Director, Educational Multimedia Research Centre, Anna University, Chennai, Tamil Nadu, India
Received 2013-06-03, Revised 2013-08-02; Accepted 2013-10-01
ABSTRACT
Effective and efficient image segmentation acts as a preliminary stage for the computer-aided diagnosis of medical images. For image segmentation, many FCM-based clustering techniques have been proposed. Regrettably, the existing FCM technique does not generate accurate and standardized segmentation results. This is due to the noise present in the image as well as the random initialization of membership values for pixels. To address this issue, this study has enhanced the existing FCM technique and proposed a technique named Ameliorate FCM (AFCM). Initially, the given image is preprocessed to remove the noise using the Contrast Limited Adaptive Histogram Equalization (CLAHE) technique. The preprocessed image is given as input to a Bayesian classifier to classify the images into two set namely normal and abnormal using a Hybrid feature selection method. The classified images are given as input to the proposed segmentation technique, which overcomes the drawbacks of existing FCM technique. Here, the membership value of the pixels of an image is standardized and clustered to segment the regions. Experiments are carried out using lung images to determine the efficiency of the proposed technique. Results of the experiment show that the proposed technique outperforms the existing FCM technique.
Keywords: Noise Removal, Hybrid Method, Feature Selection, Image Segmentation, Standardized
Membership Value
1. INTRODUCTION
Lungs are the most important part of the human body, which contracts and relaxes thousands of times daily in order to expel the carbon dioxide and to inhale the oxygen. Disorder in breathing usually refers to the lung disease. With the emergence of CT digital imaging technique, diagnosis of lung disease becomes easier. The CT digital image of lung is broadly used in clinical practice for post-treatment evaluation and diagnostic imaging. Due to the cost-effectiveness of CT lung imaging over other diagnostic imaging, a plenty of research work has been carried out in CT medical image segmentation. Numerous methods are available for image segmentation.
Segmentation is a function, which subdivides the given image into different objects or regions based on the valuable information regarding the objects present in imaging data.This segmenting process helps separate the interested component from their background. However, the CT medical image segmentation is often difficult and challenging, due to the existence of noise and artifacts, weak contrast and poor resolution.
1440
Science Publications AJAS
medical image segmentation have shown that Markov model functions are better than the artificial intelligence techniques. In the last decade, Fuzzy C-Means (FCM) algorithm has been widely used in image segmentation. FCM uses the clustering method to retain higher information about the original image than the hard or crisp image segmentation methods.
The clustering process is used to group a set of image pixels into clusters such that the members of the same cluster have similar characteristics as the components of other clusters. Generally, the number of clusters is predefined, which depends on the requirement of the application where the segmentation process is carried. The significance of the FCM in segmentation is that it can retain higher information from the original image than other techniques. A notable advantage of FCM is that it allows a pixel to belong to multiple clusters with the reasonable degree of membership grades. Nevertheless, there exists no standardized assignment of initial values for membership that causes inaccurate segmentation, which is the major drawback faced by the FCM.
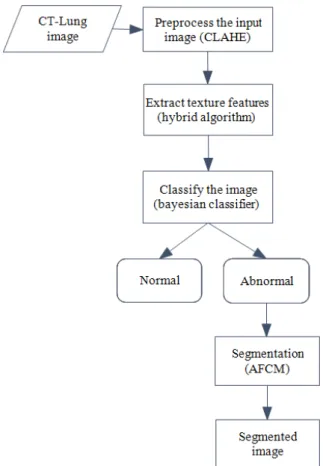
Here, the images present in the database are preprocessed using a technique termed Contrast Limited Adaptive Histogram Equalization (CLAHE) to remove the noise and classified into two groups namely normal and abnormal through Bayesian classifier. The classification step is carried to minimize the time required for segmentation whereas the preprocessing step helps to improve the accuracy of the segmentation process. For effective classification, texture features are used, which plays a major role in image processing. The effectiveness of classification depends on finding a set of texture features with a good discriminating power. Tamura and Laws features are elected using a hybrid feature selection technique. After classification, the abnormal images are segmented depending on the requirement. In the proposed AFCM algorithm, the drawbacks of the aforementioned problems that are associated with the classical FCM technique is overcome through standardization of membership value. Along with the standardization method, a weight associated with each pixel is computed to improve the performance of segmentation. The process of proposed technique is shown in the Fig. 1.
Rest of this study is structured as follows. The next section gives the related works on medical image classification and segmentation. The proposed AFCM method for segmentation is elaborately discussed in the section 3. Section 4, reports the effectiveness of the
proposed algorithm through experiment. Finally, section 5 concludes the study with a summary of the proposed technique along with the discussion on future work.
1.1. Related Works
The most important operations in computer vision are classification and segmentation. This section reviews the different classification and segmentation articles that have been proposed in the last six years.
1.2. Classification
Texture plays an important role in classifying the medical images. Numerous techniques have been developed based on texture features. Liu et al. (2012), Adaptive Local Binary Patterns (ALBP) were proposed for image classification, which was based on the texture features for local binary patterns. Here, neighborhood pixel values were considered to classify the image. Similarly, in the article (Rehman et al., 2012), a software system was generated to classify the images, which uses dominant run length and co-occurrence texture features for classification. This study incorporated both Support Vector Machine (SVM) and Probabilistic Neural Network (PNN) classifier to classify the images. The accuracy of the aforementioned classification techniques depend on texture extraction. Therefore, it is essential to extract the best set of texture features for classification.
1441
Science Publications AJAS
Fig. 1. Overall flow of proposed segmentation technique
1.3. Segmentation
A robust algorithm was proposed in (Tosun and Gunduz-Demir, 2011) for the segmentation of histopathological tissue image. The proposed algorithm combined the background knowledge of tissue organization into segmentation. The spatial relationship between the cytological tissues components was quantified by the graph construction to acquire background knowledge. The constructed graphs provided the necessary details about texture features, which help to segment the given image. Another robust model named Student’s-MIXture Model (SMM) for medical image segmentation was proposed in the proposal (Wu, 2012). This technique incorporated the local spatial constraints through exploiting the Dirichlet law and the Dirichlet distribution. The model parameters were estimated directly through the Student’s-t distribution. It adopted the gradient method to optimize the parameter. The main advantage of this technique was that it reduces the complexity present in the existing student model. A
novel image segmentation technique was proposed in the study (Li et al., 2011) based on the non-parametric clustering procedure in discretised color space. Here, the segmentation was employed by mapping the revealed range domain cluster to the spatial image domain. Pixel classification based color image segmentation was proposed in the study (Yang et al., 2012) with the Least Squares Support Vector Machine (LS-SVM). A new algorithm named Graph-Cut Active Contour Model (GC-ACM) was proposed in (Chen et al., 2013) for medical image segmentation. This technique was proposed by using graph-cut with the model-based Active Shape Model (ASM) method.
Many techniques that have been proposed for image segmentation in the last six years have used the FCM technique. Some of the proposal that uses the FCM technique for segmentation is given here. Dermoscopy images were segmented using intelligent Fuzzy clustering technique in the study (Joshi et al., 2012). The process of subdividing the cluster was continued until no erroneous clusters were found. The images were clustered through specified cluster centers. A new fuzzy level set algorithm was proposed in (Lin et al., 2012) for segmenting the medical image. The proposed algorithm enhances the existing fuzzy level set algorithm with locally regularized evolution. Usually, the FCM uses the Euclidean distance on feature space using new hyper tangent function. However, the proposal (Krstinic et al., 2011) derived a new hyper tangent, which clusters the image strongly. Lo and Wang (2012), the medical images were segmented based on the FCM clustering and bilateral filtering.
The above discussion on image segmentation reveals that the FCM technique was used widely to segment the image. Though it is widely used, it suffers from accuracy in segmenting the images. This is due to the problem in initializing the membership value. This problem is addressed in this postulate. A detailed explanation of the proposed segmentation technique is presented in the subsequent section.
1.4. Proposed Method
This section describes the process of proposed image segmentation technique AFCM. The following subsections describe the techniques used in this study to enhance the accuracy of the segmentation process.
1.5. Preprocessing
1442
Science Publications AJAS
information from low quality images, i.e., the image which is affected by noise. Medical images are usually in poor quality in terms of contrast. Therefore, it becomes mandatory to enhance the image before segmentation since the low quality image may affect the segmentation accuracy. In this study, CLAHE technique is used to enhance the local contract of a CT-Lung image. This technique is a generalization of Adaptive Histogram Equalization (AHE) and ordinary Histogram Equalization (HE). Unlike ordinary HE technique, the CLAHE technique operates on tiles, i.e. a small area in the given image. CLAHE enhances each tile’s contrast and the adjacent tiles are then incorporated through bilinear interpolation. The contrast in homogenous area is limited in order to evade amplifying the noise. This technique limits the slope associated with the gray level assignment scheme, which prevents the saturation. Following steps are carried out by the CLAHE technique to enhance the image quality:
• The CT-Lung image is alienated into conceptual regions that are non-overlapping and continuous
• Contextual region’s histogram is computed
• The histogram of every contextual regions are clipped
The aforementioned steps are computed to remove the noise thereby improves the quality of image. The CLAHE has the following advantages, (1) ease of use, (2) computational requirement is modest and (3) highly improves the quality of the image.
1.6. Feature Extraction
The preprocessed image is given as input to the feature extraction algorithm. Here, spatial features are extracted using Laws and Tamura feature extraction algorithm. This study uses the Law’s mask by convolving together just three basic 1×5 masks as given in Equation (1-3):
L5 = [1 4 6 4 1] (1)
E5 = [-1 - 2 0 2 1] (2)
S5 = [-1 0 2 0 -1] (3)
The starting letters of the aforementioned masks represents the local averaging, edge detection and spot detection. This study uses matrix multiplication to combine the 1×5 and similar set of 5×1 to obtain nine 5×5 masks. The nine 5×5 matrix are computed by multiplying
L5T L5, L5T E5, L5T S5, E5T L5, E5T E5, E5T S5, S5T E5
and S5T S. Consider the following illustration for
computing the 5×5 masks from the 1×5 and 5×1 mask. L5T, E5T, S5T represent the number transpose matrix:
-1 -1 -4 -6 -4 -1
-2 -2 -8 -12 -8 -1
* 1 4 6 4 1 =
0 0 0 0 0 0
2 2 8 12 8 2
1 1 4 6 4 1
Local magnitudes of the quantities are determined at this stage. These magnitudes are then smoothed over fair-sized region. With this the image is converted into vector image. Here, absolute and squared magnitudes are used to estimate the texture energy. The former is useful as it requires less computation while the latter corresponds to true energy. The texture energy is computed through summing the absolute values of filtering the results in local neighbors around each pixel. Finally, the features are combined to achieve rotational invariance.
In addition to Laws features, this study also considers three different Tamura features namely coarseness, contrast and directionality. The most fundamental feature is coarseness that has direct relationship to repetition rate and scale. The objective of the coarseness is to determine the prevalent size at which the texture exists. For computational purpose the average of every point over neighborhoods is manipulated using the Equation (4):
( )
( )
k
k-1 k-1
l+2 -1 m+2 -1 2k
k-1 k-1
i =l-2 j= m-2
f i, j 2
S l,m = ∑ ∑ (4)
The difference between pairs of averages is computed for each point that is related to the non-overlapping neighborhoods on opposite sides of the point in both the horizontal and vertical orientations. For horizontal case it can be computed using the Equation (5):
( )
(
k -1) (
k -1)
k,n k k
P l,m = S l + 2 ,m - S l - 2 ,m a (5)
From this, highest output value is picked where k maximizes P in either direction. The coarseness measure is then the average of opt
( )
kopt A l,m = 2 .
1443
Science Publications AJAS
that are in dynamic range presented in an image. The contrast can be measured using the Equation (6):
( )
4 xF γ
Con =
β (6)
where, 4
4 4 β =
γ and the µ4 and γ
4 are the fourth
moment about the mean and the variance respectively. Similarly, directionality feature is used to represent the global property over a region, which measures the total degree of directionality. The edges in the images are determined using two simple masks. Magnitude and angles are computed at each pixel. Edge probabilities of a histogram is built up by counting all the points whose magnitude are greater than a threshold andthereby quantifying the edge angle. The degree of directionality is reflected by histogram. The sharpness of the peaks is computed to extract a measure form histogram from their second moments.
1.7. Feature Selection
From the above section a feature set FS = {f1,f2, f3, f4, f5, f6, f7, f8, f9, f10, f11, f12, f13} is obtained. These feature values are computed for a trained dataset. The computed feature values for the trained samples are converted into feature matrix. The feature matrix is given as input to the genetic algorithm, which generates subset of features. The number of features in the subset depends on the user requirement. In this postulate number of feature in the subset is considered three. Therefore, GA initially subdivides the feature set sequentially as follows F1 = {f1, f2, f3} F2 = {f4, f5, f6,} F3 = {f7, f8, f9} F4 = {f10, f11, f12} f5 = {f13}.The Bayesian classifier classifies the samples for the aforementioned feature subset and computes the classification accuracy and error rate. Here, an error value, X which represents the minimum error rate that the classification system can tolerate to generate better classification results for given input images. The error rate and X is compared, if the error rate is lesser than the X, then that feature subset is selected as the best feature set. In case if none of the above feature subset satisfies the minimum error rate then single point cross over is carried. The process is continued till a feature subset is framed, which satisfies the minimum error rate. Mutation process is carried when none of the feature subset fulfills the above criteria during crossover. Therefore, as a result a best feature subset {fx,fy,fz}is selected.
1.8. Image Classification
This section enables to decide whether the given input image is normal or abnormal on the basis of feature value. Here, given image instance is considered 3-dimensional vector of feature values, which is mathematically represented as I = (i1,i2,i3) where the i1,
i2, i3 denotes the values for the fx,fy,fz features
respectively. The classifier assigns each image instance to either normal class (C1) or abnormal class (C2) for
which the instance has highest posterior probabilities of the classes and the image I. That is, I is assigned to a class (Ci) if and only if it satisfies the Equation (7):
j
i C
C
P I > P I "jSuch that1£j£2, j¹i
(7)
The prior probability of the classes can be estimated from their frequencies in the sample training dataset using the Equation (8 and 9):
(
)
( )
1 NormalTN P normal = P C =
TN (8)
(
)
( )
2 AbnormalTN P Abnormal = P C =
TN (9)
In the Equation (8) and (9), TN Normal and TN Abnormal represents the total number of images that are normal and abnormal in the trained dataset. TN denotes the total number of samples present in the trained dataset. In order to classify the given image, P (I/Cx)
should be calculated but it is computationally expensive. Therefore, in order to simplify the calculation, the attributes are assumed to be independent. With the assumption Equation (10) is derived, which classifies the samples into the respective class:
( )
x(
k i)
n
k =1
P I C = Õ P i C (10)
1.9. Image Segmentation
1444
Science Publications AJAS
computed UF and the cluster centroids V are given as input
to the AFCM algorithm, which is based on minimizing an objective function as shown in Equation (11):
(
)
( )
x F i i
N NP C
x 2 yz z=1 y=1
S U ,V =∑ ∑u d i , v (11)
In the above Equation P = {p1, p2,..., pz,….., pN} is a
I×N data matrix, where l denotes the dimension of each pz feature vector and Np represents the number of pixels
in the image, i.e., number of feature vector. NC represents
the number of clusters. The membership function of vector pz to the yth cluster is expressed
asU ÍU p × N × Nyz
(
p C)
that satisfies U Î 0,1yz and(
)
NC
yz p
y=1∑= u = 1 z = 1,2,...., N . The membership function can be mathematically expressed using the Equation (12):
(
)
(
zz yk)
yz 2 (x-1) NC k=1 1 u =
d p , v d p , v
∑ (12)
In Equation (12), v = {v1,v2,..,vj…vNc}, i.e., matrix
and expresses the cluster feature center Equation (13):
( )
( )
(
)
yz
y x C
yz xp
NP z
z=1 NP z=1
u
v = y = 1,2,…, N
u
å
å
(13)( )
xÎ 1, ¥ which is a weighting exponent on each fuzzy membership that controls the degree of fuzziness. d2(p
z,vy) is a measurement of similarity between pz and
vyas represented in Equation (14):
(
)
2 2
z y z y
d p , v = p - v (14)
2. EXPERIMENTAL RESULTS
The dataset used for the experiment is poised from the Early Lung Cancer Action Program (ELCAP) public lung image database, which has CT lung image of 50 subjects. Number of lung images for different subject varies on an average there exist 260 images for one subject. The results shown in this postulate is for the case
W0001-20090909 that has 176 low-dose CT image. The results of the proposed method are compared with the technique presented in the article (Amer et al., 2011), which uses the artificial neural network for image classification. The results are computed based on the following five major parameters:
• Correct rate
• Error rate
• Sensitivity
• Specificity
• Accuracy
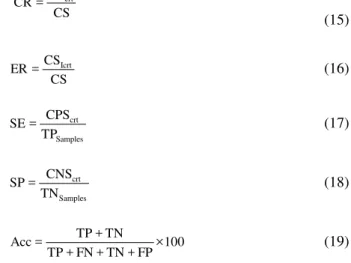
Above parameters are computed from the Equation (15), (16), (17), (18) and (19). Where the CScrt, CSIcrt,
CS, CPScrt, zTNSamples, CNScrt and TNSamples represents the
correctly classified samples, incorrectly classified samples, classified samples, correctly classified positive samples, True positive samples, correctly classified negative samples and true negative samples respectively:
crt CS CR = CS (15) Icrt CS ER = CS (16) crt Samples CPS SE = TP (17) crt Samples CNS SP = TN (18)
TP + TN
Acc = ×100
TP + FN + TN + FP (19)
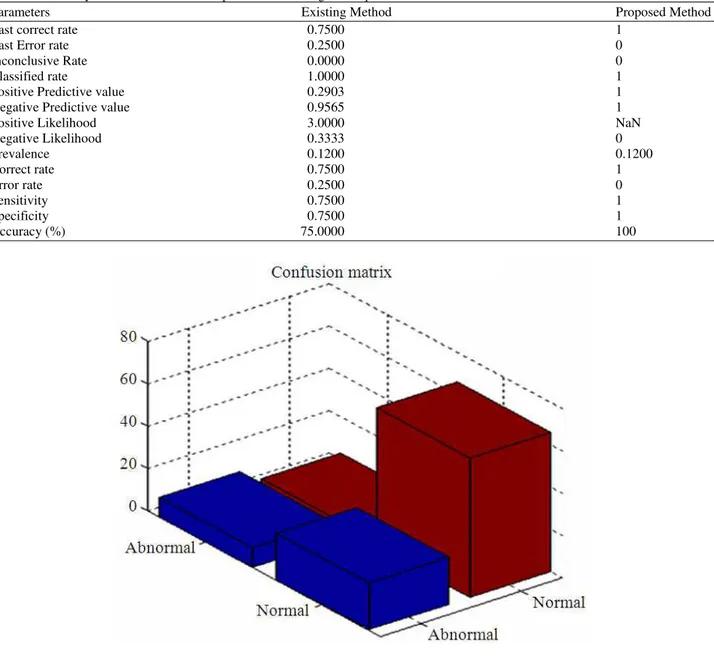
In Equation (19) TP, TN, FP and FN denotes the true positive, true negative, false positive and false negative respectively. The computed values for these parameters for the dataset images based on the proposed and existing technique is as shown in Table 1. In addition to
the major parameters, Table 1 also gives additional
parameters that are useful in determining the efficiency of the proposed technique.
Table 1 expresses that the proposed method
1445
Science Publications AJAS
the details about the predicted and actual classification done by the classification technique.
Similar to classification, the performance of proposed segmentation technique is compared with the benchmark technique FCM and with a technique proposed in (Devi et al., 2011) named modified FCM in terms of time it has taken to segment the image. Table 2 denotes the
time taken by the FCM, modified FCM and the AFCM techniques to segment the given image.
Table 2 represents that the proposed AFCM
technique requires very less time than the conventional FCM technique and the modified FCM. In addition to that, AFCM technique generates static segmentation results since the initial membership values are static whereas the conventional FCM technique generates dynamic segmentation results since its membership value is dynamic. The static segmentation results are highly useful for diagnosis.
Table 1. Accuracy of classification for Proposed and Existing technique
Parameters Existing Method Proposed Method
Last correct rate 0.7500 1
Last Error rate 0.2500 0
Inconclusive Rate 0.0000 0
Classified rate 1.0000 1
Positive Predictive value 0.2903 1
Negative Predictive value 0.9565 1
Positive Likelihood 3.0000 NaN
Negative Likelihood 0.3333 0
Prevalence 0.1200 0.1200
Correct rate 0.7500 1
Error rate 0.2500 0
Sensitivity 0.7500 1
Specificity 0.7500 1
Accuracy (%) 75.0000 100
1446
Science Publications AJAS
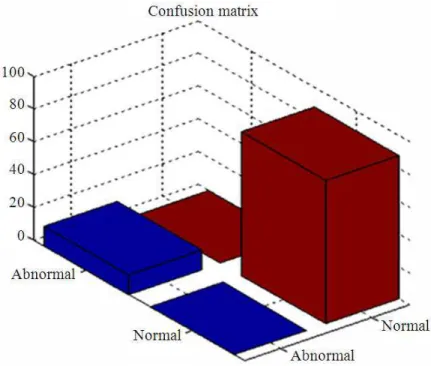
Fig. 3. Confusion matrix for proposed technique Table 2. Timing results for CT-Lung image segmentation
Image FCM (sec) Modified FCM (sec) AFCM (sec)
1 1249.34 284.44 4.8704
2 1249.34 128.77 3.4921
3 1249.34 68.84 3.6221
4 1249.34 24.12 4.3805
5 1249.34 5.72 3.6311
3. CONCLUSION
This study has addressed the problem present in the conventional FCM technique. Initially, the images are preprocessed using CLAHE technique to remove the noise present in the image thereby to enhance the accuracy of segmentation. The preprocessed images are then given as input to the classifier, which classifies the images into either normal or abnormal class. The classified images are then fed into the AFCM technique where the initial membership value is standardized thereby to generate static segmentation results. The results generated from the AFCM technique are highly useful for the diagnosing an image. Experimental results prove that the classifier accurately classifies the images as well as the proposed AFCM technique outperforms the conventional FCM and the modified FCM. In future
this work is made adaptable for Content Based Retrieval (CBIR) technique in order to improve the efficiency of CBIR process.
4. REFERENCES
Amer, H.M., F.E. Abou-Chadi and M.I. Obayya, 2011. A Computer-aided system for classifying computed Tomographic (CT) lung images using artificial neural network and data fusion. Int. J. Comput. Sci. Network Sec., 11: 70-75.
Chen, X., J.K. Udupa, A. Alavi and D.A. Torigian, 2013. GC-ASM: Synergistic integration of graph-cut and active shape model strategies for medical image segmentation. Comput. Vis. Image
Understand., 117: 513-524. DOI:
1447
Science Publications AJAS
Devi, R.S., L.P. Suresh and K.L. Shunmuganathan, 2011. Intelligent fussy system based dermoscopic image segmentation for melanoma detection. Proceedings of the International Conference on Sustainable Energy and Intelligent Systems, Jul.
20-22, Chennai, pp: 739-743. DOI:
10.1049/cp.2011.0461
Joshi, A.J., F. Porikli and N.P. Papanikolopoulos, 2012. Scalable active learning for multiclass image classification. IEEE Comput. Soc., 34: 2259-2273. DOI: 10.1109/TPAMI.2012.21
Kannan, S.R., S. Ramathilagam, R. Devi and A. Sathya, 2011. Robust kernel FCM in segmentation of breast medical images. Expert Syst. Appl. Int. J., 38: 4382-4389. DOI: 10.1016/j.eswa.2010.09.107
Krstinic, D., A.K. Skelin and I. Slapnicar, 2011. Fast two-step histogram-based image segmentation. Instit. Eng. Technol., 5: 63-72. DOI: 10.1049/iet-ipr.2009.0107
Li, B.N., C.K. Chui, S. Chang and S.H. Ong, 2011. Integrating spatial fuzzy clustering with level set methods for automated medical image segmentation. Comput. Biol. Med., 41: 1-10. DOI: 1016/j.compbiomed.2010.10.007
Lin, C.H., C.W. Liu and H.Y. Chen, 2012. Image retrieval and classification using adaptive local binary patterns based on texture features. Instit. Eng. Technol., 6: 822-830. DOI: 10.1049/iet-ipr.2011.0445
Liu, Y., K. Xiao, A. Liang and H. Guan, 2012. Fuzzy c-means clustering with bilateral filtering for medical image segmentation. Proceedings of the 7th International Conference on Hybrid Artificial Intelligent Systems, Mar. 28-30, Springer Berlin Heidelberg, Salamanca, Spain, pp: 221-230. DOI: 10.1007/978-3-642-28942-2_20
Lo, C.S. and C.M. Wang, 2012. Support vector machine for breast MR image classification. Comput. Mathem. Appl., 64: 1153-1162.
Nanthagopal, A.P. and R. Sukanesh, 2013. Wavelet statistical texture features-based segmentation and classification of brain computed tomography images. Instit. Eng. Technol., 7: 25-32. DOI: 10.1049/iet-ipr.2012.0073
Rehman, A., Y. Gao, J. Wang and Z. Wang, 2012. Image classification based on complex wavelet structural similarity. Signal Proc. Image Commun., 28: 984-992 DOI: 10.1016/j.image.2012.07.004
Shasidhar, M., V.S. Raja and B.V. Kumar, 2011. MRI brain image segmentation using modified fuzzy c-means clustering algorithm. Proceedings of the International Conference on Communication Systems and Network Technologies, Jun. 3-5, Katra, pp: 473-478. DOI: 10.1109/CSNT.2011.102
Strzelecki, M., P. Szczypinski, A. Materka and A. Klepaczko, 2013. A software tool for automatic classification and segmentation of 2D/3D medical images. Nucl. Instruments Methods Phys. Res. Section A: Accelerators, Spectrometers, Detectors Assoc. Equipment, 702: 137-140. DOI: 10.1016/j.nima.2012.09.006
Tosun, A.B. and C. Gunduz-Demir, 2011. Graph run-length matrices for histopathological image segmentation. IEEE Eng. Med. Biol. Soc., 30: 721-732. DOI: 10.1109/TMI.2010.2094200
Wu, J., 2012. Efficient HIK SVM learning for image classification. IEEE Trans. Image Proc., 21: 4442-4453. PMID: 22801508