Estimating Mortality Derived from Indoor
Exposure to Particles of Outdoor Origin
Wenjing Ji, Bin Zhao*
Department of Building Science, School of Architecture, Tsinghua University, Beijing, 100084, China
Abstract
Following an extensive review of the literature, we further analyze the published data to ex-amine the health effects of indoor exposure to particulate matter (PM) of outdoor origin. We obtained data on all-cause, cardiovascular, and respiratory mortality per 10μg/m3increase in outdoor PM10or PM2.5; the infiltration factors for buildings; and estimated time spent
out-doors by individuals in the United States, Europe, China, and globally. These data were combined log-linear exposure–response model to estimate the all-cause, cardiovascular, and respiratory mortality of exposure to indoor PM pollution of outdoor origin. Indoor PM pol-lution of outdoor origin is a cause of considerable mortality, accounting for 81% to 89% of the total increase in mortality associated with exposure to outdoor PM pollution for the stud-ied regions. The findings suggest that enhancing the capacity of buildings to protect occu-pants against exposure to outdoor PM pollution has significant potential to improve public health outcomes.
Introduction
Associations between exposure to particulate matter (PM) pollution and increased morbidity and mortality have been observed in both population-based [1–3] and cohort-based [4–9] re-search. PM is associated with negative health impacts, including cerebrovascular disease (stroke), respiratory infections, cardiopulmonary disorders, ischemic heart disease, and lung cancer [10–16]. Weichenthal et al. [17] examined the relationship between PM2.5and
non-accidental and cardiovascular mortality in the U.S. Agricultural Health Study cohort. Rural PM2.5exposure may be associated with cardiovascular mortality in men; however, similar
asso-ciations were not observed among women. Chen et al. [18] and Brook et al. [19] conducted population-based cohort studies, which indicated that long-term exposure to PM2.5is
associat-ed with increasassociat-ed risk of mortality attributable to diabetes. Burnett et al. [13] developed a fine particulate mass-based relative risk model for estimating the global burden of disease attribut-able to ambient exposure to fine particulate matter, which was found to be a superior predictor of relative risk (RR) compared with seven other forms previously used in burden assessments. Wu et al. [14] examined the cardiopulmonary health effects of PM2.5from different pollution
sources in China. They repeatedly examined for a series of cardiopulmonary health indicators among a panel of 40 healthy university students, while simultaneously collecting daily ambient
a11111
OPEN ACCESS
Citation:Ji W, Zhao B (2015) Estimating Mortality Derived from Indoor Exposure to Particles of Outdoor Origin. PLoS ONE 10(4): e0124238. doi:10.1371/ journal.pone.0124238
Academic Editor:Qinghua Sun, The Ohio State University, UNITED STATES
Received:September 28, 2014
Accepted:March 5, 2015
Published:April 10, 2015
Copyright:© 2015 Ji, Zhao. This is an open access article distributed under the terms of theCreative
Commons Attribution License, which permits
unrestricted use, distribution, and reproduction in any medium, provided the original author and source are credited.
Data Availability Statement:All relevant data are within the paper.
Funding:This study was funded by the special fund of the Key Laboratory of Eco Planning & Green Building, Ministry of Education (Tsinghua University), China and Tsinghua National Laboratory for Information Science and Technology (TNList) Cross-discipline Foundation. The funders had no role in study design, data collection and analysis, decision to publish, or preparation of the manuscript.
PM2.5mass samples and measuring for 29 chemical constituents in the laboratory throughout
the study. Their results indicated that different sources of PM2.5may play important roles in
different aspects of PM2.5related cardiopulmonary health effects.
However, a limitation of most of these studies is that only outdoor PM pollution exposure was measured. In many buildings, high concentrations of ambient PM pollution enter the in-door environment [20–23], where people spend approximately 90% of their time [24]. There are two scenarios for personal exposure to outdoor PM pollution. The first is that individuals are directly exposed while outdoors. The second is that people remain indoors, but are exposed to particles that enter the building by means of infiltration or ventilation. The infiltration fac-tor, defined as the fraction of the outdoor concentration that penetrates indoors and remains suspended, is a potential source of exposure variation but is often overlooked in epidemiologi-cal studies [25]. Infiltration depends on the air exchange rate, PM loss rate (the rate at which PM is removed from the air by deposition, filtration, and so forth), and penetration efficiency (the fraction of PM that penetrates the building envelope as outdoor air moves indoors) [26–27].
Many studies have examined the association between outdoor particles and mortality, and these existing epidemiological data are implicitly influenced by the fact that people spend ap-proximately 90% of their time [24] indoors. Moreover, previous studies did not differentiate outdoor exposure from indoor exposure to particles of outdoor origin. Wilson et al. [28] dis-cussed the legal and scientific importance of assessing personal exposure in terms of ambient particles outdoors and the fraction that infiltrates indoors. This discrete assessment of indoor exposure to indoor particles of outdoor origin is especially important for developing appropri-ate strappropri-ategies for controlling indoor air quality. Therefore, the present study focuses on indoor exposure to particles of outdoor origin.
Although Wilson et al. [28] pointed out that it is important to estimate mortality associated with indoor exposure to particles of outdoor origin, to date, no such studies have been pre-sented. For the purpose of controlling aerosol pollution, we are eager to learn from the epide-miological data, e.g. mortality derived from indoor exposure to particles of outdoor origin, in order to support strategies for managing indoor air quality (IAQ).
The study utilizes existing epidemiological data on the mortality of outdoor PM, combined with a physical model of aerosol mechanisms, to estimate mortality associated with indoor ex-posure to PM of outdoor origin. To the best of our knowledge, this is the first attempt to quan-tify this relationship for PM exposure.
Methods
Analytical model
Most epidemiological studies on the health effects of PM pollution use increased mortality or hospital admissions per 10μg/m3increase in PM exposure as the health endpoint [6–7,
29–31]. Daniels et al. [29] indicated that log-linear models are appropriate for assessing the ef-fect of PM pollution on daily mortality. They examined the hypothesis of linearity in relation to PM-mortality by comparing the Akaike information criterion (AIC) values obtained under the linear-, threshold-, and spline dose-response models. Their results indicated that a log-linear model is preferable to the threshold and spline models, and so a log-log-linear analytical model is used here. This approach involves several assumptions: a) Outdoor air pollution is not affected by indoor sources; b) There are no interactions with indoor sources, including aller-gens and various chemicals; c) The health effects of particle exposure are a function of PM2.5
mass concentration. The toxicity of PM2.5is assumed to differ only with mass exposure and
model used for estimating the health effects of indoor exposure to outdoor-originated PM can be represented as:
DlogMin;j¼
DCout intin DCouttoutþDCout intin
DlogMall;j ð1Þ
WhereΔlogMall,jis the increase in mortality due to the jthoutcome associated with total PM exposure for each 10μg/m3increase in PM10or PM2.5outdoors. j represents three major health
outcomes: all-cause, cardiovascular, and respiratory mortality.
ΔCoutis the increase in outdoor PM10or PM2.5concentrations, which is set as 10μg/m3. ΔCout-inis the increase in outdoor-originated PM10or PM2.5concentrations found in the
indoor environment.
toutis the duration of direct exposure to outdoor PM pollution.
tinis the duration of indoor exposure to PM of outdoor origin.
ΔlogMin,jestimates the increase in mortality due to the jthoutcome associated with indoor exposure to outdoor-origin PM for each 10μg/m3increase in PM10or PM2.5. A relatively low
value ofΔlogMin,jsuggests low probability of morbidity or mortality. This implies that build-ings adequately shield occupants against outdoor-origin PM pollution and, thus, investment in further reducing the indoor concentrations of such PM would have minimal benefits for public health outcomes. However, a high value ofΔlogMin,jsuggests high possibility of morbidity or mortality with increased exposure to outdoor-origin PM, emphasizing the importance of pre-venting ambient PM from entering the indoor environment.
When an epidemiologic study is performed, the observed mortality rate is lower than that in other places with higher infiltration factors, and this can be falsely interpreted that the dose-response slope (ΔlogMin,j) is less steep. When this mortality estimate was combined with the lower exposure estimate (due to low infiltration) inEq (1), we would get too low estimation for the mortality due to indoor exposure to outdoor PM. Therefore, the local infiltration factor should be used to adjust the observed mortality rate. We assume that the logarithms of the ob-served probabilities (or rates) of disease have the probability distributions as:
logðMÞ ¼aþbC ð2Þ
WhereMis the probability of disease,ais a constant describing the background probability,b
is a risk coefficient for the exposure, andCis the exposure concentration in the population. The differences in the probability of disease are caused by the differences in exposureC. The observedCitself (the actual exposure concentration) is only the surrogateCobs, which in this case is the outdoor concentration of PMCout. With a given difference in the probability of dis-ease between the exposed and non-exposed groups, a biased probability of disdis-ease could be de-scribed as:
logðMEÞ logðM0Þ ¼ ðaþbCEÞ ðaþbC0Þ ¼bðCE C0Þ ¼bobsðCE;obs C0;obsÞ ð3Þ
whereEis the exposed group,0is the non-exposed group, andobsis the biased observed vari-able (in contrast to the actual varivari-able we would observe if all measurements were correct). Then the ratio of the biased and correct risk estimates is:
bobs
b ¼
CE C0
CE;obs C0;obs
¼
P
iCE;iti P
iC0;iti CE;out
24 C0
;out
24 ð4Þ
microenvironmentsI(in this case of only indoor and outdoor microenvironments,Fiis 1 for outdoor and equal to infiltration factor (Finf) for indoor), then
bobs
b ¼
X
iFiCE;outti
X
iFiC0;outti CE;out
24 C0
;out
24 ¼
ðCE;out C0;outÞ
X
iFiti
ðCE;out C0;outÞ
24 ¼
X
iFiti
24 ð5Þ
The observedbis biased downward if the population spends a lot of time in microenviron-ments with low infiltration factor. TheΔlogMall,jcan be calculated as follows:
DlogMall;j¼
24DlogM obs;j
X
iFiti
ð6Þ
Combine theEq (1)andEq (6), we can get:
DlogMin;j¼
DCout intin DCouttoutþDCout intin
24DlogM obs;j
X
iFiti
ð7Þ
Epidemiological data
The epidemiological data for all-cause, cardiovascular, and respiratory mortality attributable to outdoor PM exposure (PM10or PM2.5) are based on meta-analyses published in the U.S.,
Eu-rope, China, and globally between 2000 and 2012. All of the parameters used in the model are summarized inTable 1.
We selected meta-analyses by Anderson et al. [31] that formed part of the World Health Or-ganization’s“Systematic Review of Health Aspects of Air Pollution in Europe”project. The data were drawn from time-series (ecological and individual) estimates of the effects of PM10
on all-cause mortality in 33 European cities or regions. The majority of these estimates
Table 1. Parameters used to evaluate of the effects on mortality of indoor exposure to particulates of outdoor origin.
Location Reference Values Remarks
DlogMobs
;j Overall world Anderson et al. [31] 0.9% (0.6%, 1.3%) Mean (95%CI) all-cause mortality; PM2.5. 1.3% (0.5%, 2.2%) Mean (95%CI) cardiovascular mortality; PM2.5.
1.1% (0.2%, 2.0%) Mean (95%CI) respiratory mortality; PM2.5.
United States Daniels [29] 0.54% (0.33%, 0.76%) Mean (95%CI) all-cause mortality; PM10.
Zanobetti and Schwartz [34] 0.98% (0.75%, 1.22%) Mean (95%CI) all-cause mortality; PM2.5.
0.85% (0.46%, 1.24%) Mean (95%CI) cardiovascular mortality; PM2.5.
1.68% (1.04%, 2.33%) Mean (95%CI) respiratory mortality; PM2.5.
Europe Anderson et al. [31] 0.6% (0.4%, 0.8%) Mean (95%CI) all-cause mortality; PM10.
0.9% (0.5%, 1.3%) Mean (95%CI) cardiovascular mortality; PM10.
1.3% (0.5%, 2.0%) Mean (95%CI) respiratory mortality; PM10.
China Chen et al. [35] 0.35% (0.18%, 0.52%) Mean (95%CI) all-cause mortality; PM10.
0.44% (0.23%, 0.64%) Mean (95%CI) cardiovascular mortality; PM10.
0.56% (0.31%, 0.81%) Mean (95%CI) respiratory mortality; PM10.
Cao et al. [36] 0.20% (0.1%, 0.3%) Mean (95%CI) all-cause mortality; PM2.5.
0.3% (0.1%, 0.40%) Mean (95%CI) cardiovascular mortality; PM2.5.
0.4% (0.2%, 0.6%) Mean (95%CI) respiratory mortality; PM2.5.
DCout 10μg/m3 Each 10μg/m3 increased in outdoor PM10or PM2.5.
originated from multi-city studies conducted in France, Italy, and Spain in 2003–2004. The Eu-ropean exposure–response coefficient for all-cause mortality was 0.6% (95% CI: 0.4%, 0.8%), referring to the percentage change in the number of deaths with each 10μg/m3increase in
out-door PM10. The corresponding summary estimates for cardiovascular and respiratory
mortali-ty were 0.9% (95% CI: 0.5%, 1.3%) and 1.3% (95% CI: 0.5%, 2.0%) respectively.
The meta-analysis of Anderson et al. [31] was used to estimate all-cause, cardiovascular, and respiratory mortality attributable to outdoor PM2.5exposure for the U.S., Canada, and
globally in 2003–2004. Studies from North and South America as well as other areas of the world were identified in the database and used to conduct meta-analyses for each mortality group. The global exposure–response coefficients for all-cause, cardiovascular and respiratory mortality for a 10μg/m3increase in outdoor PM2.5were 0.9% (95% CI: 0.6%, 1.3%), 1.3% (95%
CI: 0.5%, 2.2%), and 1.1% (95% CI: 0.2%, 2.0%), respectively.
We used results from Daniels et al. [29] to estimate all-cause mortality due to outdoor PM10
exposure in the U.S. Their analysis used a database developed for the“National Morbidity, Mortality, and Air Pollution Study”for the 20 largest metropolitan areas in the U.S. over a 7-year period (1987–1994). These data were obtained from the Aerometric Information Re-trieval System database maintained by the U.S. Environmental Protection Agency (EPA). Their estimates for all-cause, mortality with a 10μg/m3increase in outdoor PM10in the U.S. were
0.54% (95% CI: 0.33%, 0.76%).
In the U.S., Zanobetti and Schwartz [34] conducted a national, multi-city time-series study of the acute effects of PM2.5on risk of death from all causes, cardiovascular disease, myocardial
infarction, stroke, and respiratory mortality for the years 1999–2005. They found a 0.98% in-crease (95% CI, 0.75%, 1.22%) in total mortality, a 0.85% inin-crease (95% CI, 0.46%, 1.24%) in cardiovascular deaths, and a 1.68% increase (95% CI, 1.04%, 2.33%) in respiratory deaths for a 10μg/m3increase in two-day averaged PM2.5.
After reviewing studies published in both English and Chinese, on the health effects of PM10
in China, we chose the meta-analysis conducted by Chen et al. [35], on the association between PM10and daily mortality in 16 Chinese cities between 1996 and 2008. Their results showed
ex-posure–response coefficients of 0.35% (95% CI: 0.18%, 0.52%), 0.44% (95% CI: 0.23%, 0.64%), and 0.56% (95% CI: 0.31%, 0.81%) for all-cause, cardiovascular, and, respiratory mortality, re-spectively, resulting from a 10μg/m3increase in outdoor PM10in China.
For China, we used results from Cao et al. [36] on the short-term association between PM2.5
constituents and daily mortality in Xi’an, a heavily polluted Chinese city. Those authors ob-tained daily mortality data and daily concentrations of PM2.5for 1 January 2004 through 31
December 2008. Their results show that the exposure–response coefficients for all-cause, car-diovascular, and respiratory mortality for a 10μg/m3increase in outdoor PM2.5in China were
0.20% (95% CI: 0.1%, 0.3%), 0.3% (95% CI: 0.1%, 0.4%), and 0.4% (95% CI: 0.2%, 0.6%), respectively.
Outdoor-originated particles in the indoor environment
The infiltration factor,Finf, is used to determine the relationship between outdoor PM
concen-tration and indoor PM derived from outdoor sources. The indoor PM2.5concentration can be calculated as:
dCin
dt ¼lpCout ðlþbPMÞCinþS
:
ð8Þ
(μg/m3),pis PM penetration rate,λis hourly air exchange rate (h-1),βPMis particle deposition rate (h-1), andS:
is the volume-averaged indoor PM2.5source strength (μg/(h•m3)).
According to the steady-state assumption [37], the rates of penetration (P), deposition (βPM), and air exchange (λ) remain constant over a given time.Eq (8)can then be solved as:
Cin¼
lp
ðlþbPMÞCoutþ
S
ðlþbPMÞ ð9Þ
Thefirst item on the right side ofEq (9)represents the contribution of outdoor-originating particles, which is the infiltration definition, and the second item represents the contribution of indoor-emitted particles.
Therefore, infiltration factor is defined as:
Finf ¼
lp
ðlþbPMÞ ð10Þ
The infiltration factor for PM2.5is typically higher than that of PM10, due to the stronger effect
of the deposition mechanism on gravity setting for coarse particles, which ultimately results in greater particle loss in the cracks of building envelopes and on indoor surfaces for PM10.
Fur-thermore, since the infiltration factor is a function of a building’s crack geometry as well as its air exchange rate, particle deposition rate and penetration factor (the fractional penetration of particles from outdoors), the mean infiltration factors measured in these studies show considerable variation.
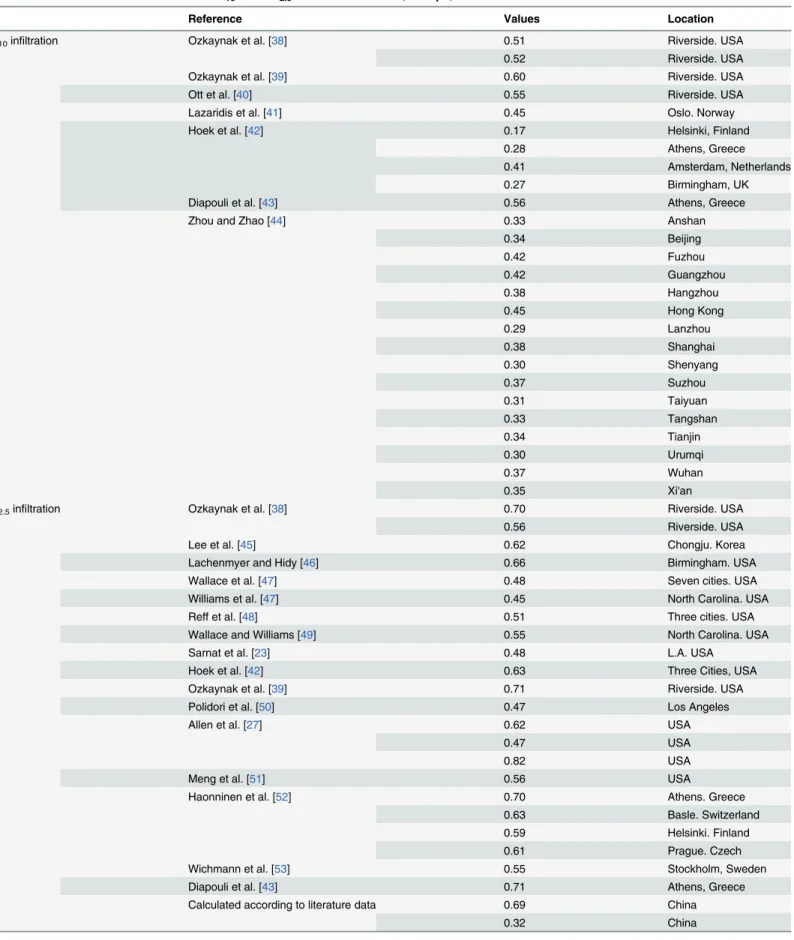
The literature was reviewed to determine the PM10and PM2.5infiltration factors reported
for European, North American, Chinese, and global residences (seeTable 2). We calculate mean infiltration factors of PM10and PM2.5in each region, and the maximum and minimum
values for each region were also used in sensitivity analysis to study the effect of infiltration fac-tor on mortality and particle infiltration (seeTable 3). For the PM2.5infiltration in China, there
is no available data in literature, therefore, we calculated it according to theEq (4). The maxi-mum infiltration air exchange rate was 0.55 h-1and the minimum infiltration air exchange rate was 0.06 h-1according to Zhou and Zhao [44] study of Beijing region. The PM2.5penetration
rate was 0.8 and the deposition rate of PM2.5was 0.09 h-1according to the systematic review by
Chen and Zhao [26]. Therefore, the PM2.5infiltration in China was set 0.69 (maximum) and
0.32 (minimum).
Duration of exposure
The time spent by U.S. individuals in outdoor and indoor environments was determined from the National Human Activity Pattern Survey (NHAPS). NHAPS is a nationally representative survey (n = 9,386) conducted between September 1992 and October 1994 [24]. Based on self-reported time-activity budgets, people in the U.S. spend an average of 1.8 h outdoors per day [24]. Due to the lack of data on daily activity patterns for Europe, we extrapolated the results from the NHAPS to European populations.
Zhou and Zhao [44] reviewed time-activity patterns for both urban and rural Chinese resi-dents and fitted log-normal distributions. The fitted distributions were then repeatedly sam-pled to generate a set of mean standard deviation (SD) pairs that could match the mean SD pattern of all individual studies in a mean SD plot. According to this analysis, Chinese adults spend an average of 1.6 (0.6, SD) hours outside per day.
Table 2. Review of infiltration factors for PM10and PM2.5in the United States, Europe, and China.
Reference Values Location
PM10infiltration Ozkaynak et al. [38] 0.51 Riverside. USA
0.52 Riverside. USA
Ozkaynak et al. [39] 0.60 Riverside. USA
Ott et al. [40] 0.55 Riverside. USA
Lazaridis et al. [41] 0.45 Oslo. Norway
Hoek et al. [42] 0.17 Helsinki, Finland
0.28 Athens, Greece
0.41 Amsterdam, Netherlands
0.27 Birmingham, UK
Diapouli et al. [43] 0.56 Athens, Greece
Zhou and Zhao [44] 0.33 Anshan
0.34 Beijing
0.42 Fuzhou
0.42 Guangzhou
0.38 Hangzhou
0.45 Hong Kong
0.29 Lanzhou
0.38 Shanghai
0.30 Shenyang
0.37 Suzhou
0.31 Taiyuan
0.33 Tangshan
0.34 Tianjin
0.30 Urumqi
0.37 Wuhan
0.35 Xi'an
PM2.5infiltration Ozkaynak et al. [38] 0.70 Riverside. USA
0.56 Riverside. USA
Lee et al. [45] 0.62 Chongju. Korea
Lachenmyer and Hidy [46] 0.66 Birmingham. USA
Wallace et al. [47] 0.48 Seven cities. USA
Williams et al. [47] 0.45 North Carolina. USA
Reff et al. [48] 0.51 Three cities. USA
Wallace and Williams [49] 0.55 North Carolina. USA
Sarnat et al. [23] 0.48 L.A. USA
Hoek et al. [42] 0.63 Three Cities, USA
Ozkaynak et al. [39] 0.71 Riverside. USA
Polidori et al. [50] 0.47 Los Angeles
Allen et al. [27] 0.62 USA
0.47 USA
0.82 USA
Meng et al. [51] 0.56 USA
Haonninen et al. [52] 0.70 Athens. Greece
0.63 Basle. Switzerland
0.59 Helsinki. Finland
0.61 Prague. Czech
Wichmann et al. [53] 0.55 Stockholm, Sweden
Diapouli et al. [43] 0.71 Athens, Greece
Calculated according to literature data 0.69 China
0.32 China
Sensitivity analysis was conducted to study the effect of time-activity pattern on mortality, which used a ±50% range of the mean time spent outside (seeTable 3).
Results and Discussion
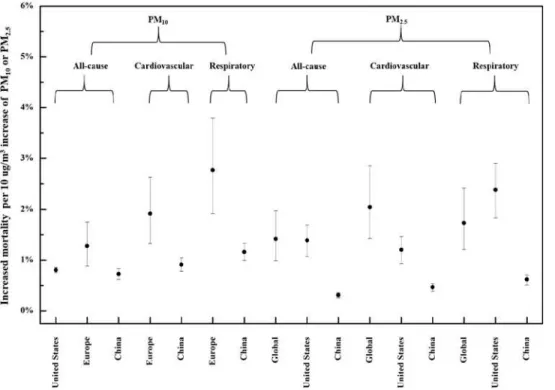
Fig 1shows the increased mortality attributable to each 10μg/m3increase in indoor exposure
to PM of outdoor origin. Each 10μg/m3increase in outdoor PM10is predicted to result in
0.81%, 1.20%, and 0.73% increase in all-cause mortality in the U.S., Europe, and China, respec-tively. The mean increases in cardiovascular mortality are 1.8% and 0.91% for Europe and Table 3. Parameters used to evaluate the effects on human health of indoor exposure to particulates of outdoor origin.
PM10infiltration factor PM2.5infiltration factor Tout(h)
United States Mean 0.55 0.58 1.8
max 0.60 0.82 2.7
min 0.51 0.45 0.9
Europe Mean 0.36 0.63 1.8
max 0.56 0.71 2.7
min 0.17 0.55 0.9
China Mean 0.36 0.51 1.6
max 0.45 0.69 2.4
min 0.29 0.32 0.8
Global Mean 0.38 0.59 1.7
max 0.60 0.82 2.7
min 0.17 0.32 0.8
doi:10.1371/journal.pone.0124238.t003
Fig 1. Mortality attributable to indoor exposure to particulates of outdoor origin.
China respectively, whereas those for respiratory mortality are 2.60% and 1.16%. For each 10μg/m3increase in outdoor PM2.5, all-cause mortality is predicted to increase by 1.29%,
1.41%, and 0.32% in the globally, U.S. and China, compared with 1.86%, 1.22%, and 0.48%, re-spectively, for cardiovascular mortality, and 1.57%, 2.41% and 0.65% for respiratory mortality. Overall, the predicted increases in all-cause, cardiovascular, and respiratory mortality in China are considerably lower than in other regions.
For PM10, the predicted increases in all-cause, cardiovascular, and respiratory mortality
were all higher in Europe than in the U.S. Although the infiltration factor for PM10in
Europe-an countries was lower thEurope-an in the U.S. Europe-and China in this study, the total increase in mortality is actually predicted to be higher in Europe, which dominates the influence on total increased mortality.
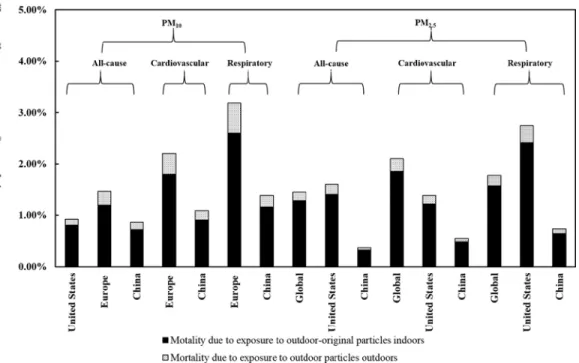
Fig 2shows increased mortality attributed to direct exposure to outdoor particles for every 10μg/m3increase in PM pollution, compared with that predicted for indoor exposure to
outdoor-originated PM. Increased mortality resulting from indoor exposure accounts for 81– 89% of the total increase in mortality.
The results of this study suggest that it is important to account for indoor exposure to outdoor-originated particles in the relationship between air pollution and health. PM infiltra-tion and time-activity patterns are both important factors in human exposure, so a sensitivity analysis was conducted to determine their effects on mortality.
Influence of infiltration
Since particle infiltration differs even between studies conducted in the same region, we con-ducted an extensive review of the literature, from which infiltration values are shown in
Table 2. We selected the maximum and minimum infiltration values for use in the sensitivity analysis, shown inFig 1.
Fig 2. Comparison of mortality due to direct exposure to outdoor particles versus indoor exposure to particulates of outdoor origin.
For each 10μg/m3increase in outdoor PM10a range of indoor infiltration values is
calculat-ed; based on these data, there is no remarkable increase in all-cause mortality associated indoor exposure in the U.S. and China (increase of 0.10–0.21%); however, all-cause mortality in Eu-rope showed a much larger increase of approximately 0.87%. Similarly to the findings for all-cause mortality, considerable increases were observed in mean cardiovascular and respiratory mortality for Europe but not for China. For each 10μg/m3increase in outdoor PM2.5,all-cause,
cardiovascular, and respiratory mortalities due to indoor exposure all showed little increase in mean mortality in China; in the U.S, all-cause and cardiovascular mortalities due to indoor ex-posure in mean mortality increased 0.62% and 0.54%, respectively, the exception was respirato-ry mortality in the U.S., which showed increases of 1.07% in respiratorespirato-ry mortality. The each 10μg/m3increase in outdoor PM2.5,all-cause, cardiovascular, and respiratory mortalities due
to indoor exposure increase 0.98%, 1.42% and 1.20% respectively for the global region, which is large compare with U.S. and China. There are two explanations for this finding. One is that the mortality values of all three forms of mortality are very small, and are therefore not sensitive to the infiltration value; another is that the infiltration we reviewed in the literature is relatively comprehensive, whereas the infiltration values in the different studies differ slightly.
Influence of exposure time
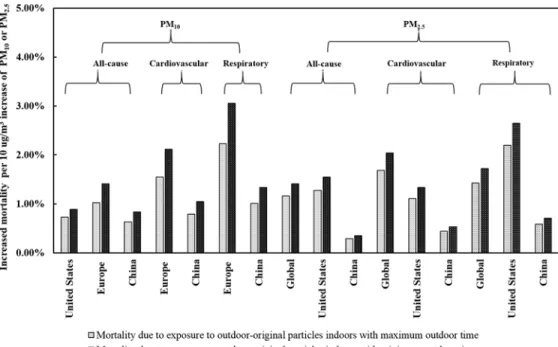
Since personal activity patterns can be highly variable, the exposure duration in indoor and outdoor environments may show frequent fluctuation. We therefore varied the duration of outdoor activity within a range of 50% when conducting the sensitivity analysis. The results are shown inFig 3.
For each 10μg/m3increase in outdoor PM10,changes in the duration of outdoor exposure
are associated with remarkable changes in all-cause mortality in the U.S., Europe, and China, respectively, which derive from a reciprocal shift in the duration of indoor exposure. The mean increases in all-cause mortality associated with indoor exposure range from 0.73% to 0.89%,
Fig 3. Comparison of mortality due to indoor exposure to particles of outdoor origin, according to maximum/minimum duration of outdoor exposure.
1.03% to 1.41%, and 0.63% to 0.84% for the United States, Europe, and China, respectively. The mean increases in cardiovascular mortality range from 1.54% to 2.11%, and from 0.79% to 1.05% for Europe and China respectively. The mean increases in respiratory mortality range from 2.23% to 3.05%, and from 1.01% to 1.34% for Europe and China respectively.
For each 10μg/m3increase in outdoor PM2.5, the change in duration of outdoor exposure
also shows a remarkable increase in all-cause mortality and respiratory and cardiovascular mortality associated with indoor exposure. Mean all-cause, cardiovascular and respiratory mortality due to indoor exposure to outdoor-originated PM2.5show approximately increases
of 0.24%, 0.35% and 0.30% globally and 0.26%, 0.22% and 0.44% for the United States when outdoor activity time decreased by two-thirds. However, when outdoor activity time decreases by two-thirds, all-cause, cardiovascular and respiratory mortality due to indoor exposure to outdoor-originated PM2.5in China increase no more than 0.12% for each 10μg/m3increase in
outdoor PM2.5.
These results indicate that outdoor-derived PM has considerable effects on human health arising from exposure within the indoor environment. Enhancing the capacity of buildings to exclude outdoor particles, and the installation of air purifiers in indoor environments are both important measures for protection of public health.
Limitations
This study has several limitations. Since most studies on the effects of outdoor particles on human health were conducted in the U.S., Europe, and China, the data used in our models may not be representative of all regions of the world, especially Africa, South America, and Oceania, where almost no data are available the published references.
This study was also limited by a lack of infiltration factor data for much of Asia (except China), Africa, South America, and Oceania in our study (work sites and bars/restaurants). However, since detailed analysis of measured data shows that the infiltration factor is not strongly region-dependent [21–23,37–38,41–42,45–46,48–49,52,54–57], the assumed infiltra-tion factors used in this study are not likely to deviate significantly from the actual measure-ments. Rare infiltration factors were studied at the same time for most of the epidemiologic studies, so further study need to be conducted to obtain the detailed and systematic infiltration factors. This is also what we want to do in the future work. For accurately estimate as possible, we conducted the literature review to determine the PM10and PM2.5infiltration factors for
Eu-ropean, North American, Chinese, and global residences, try to apply local infiltration factors we could obtain for the corresponding regions (seeTable 2). We also calculated mean infiltra-tion factors of PM10and PM2.5in each region, and the maximum and minimum values for
each region were further used in sensitivity analysis to study the effect of infiltration factor on mortality and particle infiltration. We think such treatment of infiltration factors represents the state of the art approach for such study.
Parameters such as particle size, the crack geometry of building envelopes, differences in in-door/outdoor air pressure, and the efficiency of mechanical filtration can affect particle infiltra-tion; however, such factors are highly complex and require further study. After analyzing these factors, we were able to account for the relationship between mortality and indoor exposure to PM of outdoor origin.
Perspectives
The limited scientific knowledge on the health effects of exposure to airborne particles in the indoor environment represents a major barrier to establishing limit values or guidelines that protect public health [58]. One explanation for the lack of studies on the health effects of in-door exposure to outin-door-originated PM is the expense, in addition to the logistical and tech-nological constraints inherent in measuring direct personal PM exposure. This study
introduces an innovative method for quantifying the relationship between outdoor PM and in-door PM originating from outin-doors, based on a known set of physical principles. For example, based on existing knowledge of aerosol physics, we know that this relationship is affected by the particle penetration factor through building envelopes, in conjunction with the rates of in-door particle deposition and air exchange. Reducing the need for conducting personal PM ex-posure measurements may facilitate further studies on this topic so that guidelines on indoor exposure to ambient PM can be established.
This method for estimating mortality derived from indoor exposure to particles of outdoor origin has some disadvantages (e.g., the composition issue). Wilson et al. [28] suggested a rea-sonable, epidemiological approach to estimate such mortality. For the purpose of controlling aerosol particle pollution, we are eager to learn from the epidemiological data, e.g. mortality de-rived from indoor exposure to particles of outdoor origin, from the method suggested by Wil-son et al. [28] in order to support strategies for managing indoor air quality. However, to date, no such studies have been presented. Therefore, through this paper, we also wish to encourage epidemiologists to further consider this important issue.
Acknowledgments
This study was funded by the special fund of the Key Laboratory of Eco Planning & Green Building, Ministry of Education (Tsinghua University), China; and by Tsinghua National Lab-oratory for Information Science and Technology (TNList) Cross-discipline Foundation.
Author Contributions
Conceived and designed the experiments: BZ. Analyzed the data: WJ. Contributed reagents/ materials/analysis tools: WJ. Wrote the paper: BZ WJ.
References
1. Lave LB, Seskin EP. Air pollution and human health. Science. 1970; 169: 723–733. PMID:5432570
2. Evans JS, Tosteson T, Kinney PL. Cross-sectional mortality studies and air pollution risk assessment. Environ Int. 1984; 10: 55–83.
3. Özkaynak H, Thurston GD. Associations between 1980 U.S. mortality rates and alternative measures of airborne particle concentration. Risk Anal. 1980; 7: 449–461.
4. Dockery DW, Pope CA, Xu X, Spengler JD, Ware JH, Fay ME, et al. An association between air pollu-tion and mortality in six US cities. New England journal of medicine. 1993; 329(24): 1753–1759. PMID:
8179653
5. Pope CA III, Thun MJ, Namboodiri MM, Dockery DW, Evans JS, Speizer FE, et al. Particulate air pollu-tion as a predictor of mortality in a prospective study of US adults. American journal of respiratory and critical care medicine. 1995; 151: 669–674. PMID:7881654
6. Pope CA III, Burnett RT, Thun MJ, Calle EE, Krewski D, Ito K, et al. Lung cancer, cardiopulmonary mor-tality, and long-term exposure to fine particulate air pollution. Jama. 2002; 287(9): 1132–1141. PMID:
11879110
8. Krewski D, Burnett RT, Goldberg MS, Hoover K, Siemiatycki J, Jerrett M, et al. Reanalysis of the Har-vard Six Cities Study and the American Cancer Society Study of particulate air pollution and mortality. Cambridge, MA: Health Effects Institute. 2000.
9. Jerrett M, Burnett RT, Ma R, Pope CA III, Krewski D, Newbold KB, et al. Spatial analysis of air pollution and mortality in Los Angeles. Epidemiology. 2005; 16(6): 727–736. PMID:16222161
10. Van Donkelaar A, Martin RV, Brauer M, Kahn R, Levy R, Verduzco C, et al. Global estimates of ambient fine particulate matter concentrations from satellite-based aerosol optical depth: development and ap-plication. Environmental health perspectives. 2010; 118(6): 847. doi:10.1289/ehp.0901623PMID:
20519161
11. Brauer M, Amann M, Burnett RT, Cohen A, Dentener F, Ezzati M, et al. Exposure assessment for esti-mation of the global burden of disease attributable to outdoor air pollution. Environmental science & technology. 2012; 46(2): 652–660.
12. Lim SS, Vos T, Flaxman AD, Danaei G, Shibuya K, Adair-Rohani H, et al. A comparative risk assess-ment of burden of disease and injury attributable to 67 risk factors and risk factor clusters in 21 regions, 1990–2010: a systematic analysis for the Global Burden of Disease Study 2010. The lancet. 2013; 380(9859): 2224–2260.
13. Burnett RT, Pope CA, Ezzati M, Olives C, Lim SS, Mehta S, et al. An Integrated Risk Function for Esti-mating the Global Burden of Disease Attributable to Ambient Fine Particulate Matter Exposure.” Envi-ronmental Health Perspectives. 2014; 122(4): 397–403. doi:10.1289/ehp.1307049PMID:24518036
14. Wu S, Deng F, Wei H, Huang J, Wang X, Hao Y, et al. Association of Cardiopulmonary Health Effects with Source-Appointed Ambient Fine Particulate in Beijing, China: A Combined Analysis from the Healthy Volunteer Natural Relocation (HVNR) Study. Environmental science & technology. 2014; 48(6): 3438–3448
15. Pope CA, Burnett RT, Krewski D, Jerrett M, Shi Y, Calle EE, et al. Cardiovascular mortality and expo-sure to airborne fine particulate matter and cigarette smoke shape of the expoexpo-sure-response relation-ship. Circulation. 2009; 120(11): 941–948. doi:10.1161/CIRCULATIONAHA.109.857888PMID:
19720932
16. Anenberg SC, Horowitz LW, Tong DQ, West J. An estimate of the global burden of anthropogenic ozone and fine particulate matter on premature human mortality using atmospheric modeling. Environ-mental health perspectives. 2010; 118(9): 1189–1195. doi:10.1289/ehp.0901220PMID:20382579
17. Weichenthal S, Villeneuve PJ, Burnett RT, van Donkelaar A, Martin RV, Jones RR, et al. Long-Term Exposure to Fine Particulate Matter: Association with Nonaccidental and Cardiovascular Mortality in the Agricultural Health Study Cohort. Environ Health Perspect. 2014; 122(6): 609–615. doi:10.1289/ ehp.1307277PMID:24633320
18. Chen H, Burnett RT, Kwong JC, Villeneuve PJ, Goldberg MS, Brook RD, et al. Risk of incident diabetes in relation to long-term exposure to fine particulate matter in Ontario, Canada. Environmental health perspectives. 2013; 121(7): 804–810. doi:10.1289/ehp.1205958PMID:23632126
19. Brook RD, Cakmak S, Turner MC, Brook JR, Crouse DL, Peters PA, et al. Long-term fine particulate matter exposure and mortality from diabetes in Canada. Diabetes care. 2013; 36(10): 3313–3320. doi:
10.2337/dc12-2189PMID:23780947
20. Abt E, Suh HH, Catalano P, Koutrakis P. Relative contribution of outdoor and indoor particle sources to indoor concentrations. Environmental science & technology. 2000; 34(17): 3579–3587.
21. Long CM, Suh HH, Catalano PJ, Koutrakis P. Using time- and size-resolved particulate data to quantify indoor penetration and deposition behavior. Environ Sci Technol. 2001; 35: 2089–2099. PMID:
11393992
22. Allen R, Larson T, Sheppard, L, Wallace L, Liu LJS. Use of real-time light scattering data to estimate the contribution of infiltrated and indoor-generated particles to indoor air. Environ Sci Technol. 2003; 37: 3484–3492. PMID:12953856
23. Sarnat SE, Coull BA, Ruiz PA, Koutrakis P, Suh HH. The influences of ambient particle composition and size on particle infiltration in Los Angeles, CA, residences. J Air Waste Manage Assoc. 2006; 56: 186–196. PMID:17063859
24. Klepeis NE, Nelson WC, Ott WR, Robinson JP, Tsang AM, Switzer P, et al. The National Human Activi-ty Pattern Survey (NHAPS): a resource for assessing exposure to environmental pollutants. Journal of exposure analysis and environmental epidemiology. 2001; 11(3): 231–252. PMID:11477521
25. Sarnat JA, Wilson WE, Strand M, Brook J, Wyzga R, Lumley T. Panel discussion review: session one—exposure assessment and related errors in air pollution epidemiologic studies. J Expo Sci Env Epid. 2007; 17:S75–S82.
27. Allen RW, Adar SD, Avol E, Cohen M, Curl CL, Larson T, et al. Modeling the residential infiltration of outdoor PM2.5 in the Multi-Ethnic Study of Atherosclerosis and Air Pollution (MESA Air). Environmental health perspectives. 2012; 120(6): 824. doi:10.1289/ehp.1104447PMID:22534026
28. Wilson WE, Mage DT, Grant LD. Estimating separately personal exposure to ambient and nonambient particulate matter for epidemiology and risk assessment: Why and how. J Air Waste Manage Assoc. 2000; 50: 1167–1183. PMID:10939210
29. Daniels MJ, Dominici F, Samet JM, Zeger SL. Estimating particulate matter-mortality dose-response curves and threshold levels: an analysis of daily time-series for the 20 largest US cities. Am J Epide-miol. 2000; 152: 397–406. PMID:10981451
30. Stieb DM, Judek S, Burnett RT. Meta-analysis of time-series studies of air pollution and mortality: ef-fects of gases and particles and the influence of cause of death, age, and season. J Air Waste Manage Assoc. 2002; 52: 470–484. PMID:12002192
31. Anderson HR, Atkinson RW, Peacock JL, Marston L, Konstantinou K. Meta-analysis of time-series studies and panel studies of Particulate Matter (PM) and Ozone (O3). Report of a WHO task group. 2004. Available:http://www.euro.who.int/__data/assets/pdf_file/0004/74731/e82792.pdf. 32. Smith KR. Biofuels, air pollution, and health: a global review. Plenum Press; 1987.
33. Stanek LW, Sacks JD, Dutton SJ, Dubois JJB. Attributing health effects to apportioned components and sources of particulate matter: an evaluation of collective results. Atmos Environ. 2011; 45: 5655–5663.
34. Zanobetti A and Schwartz J. The effect of fine and coarse particulate air pollution on mortality: a nation-al annation-alysis. Environ Henation-alth Perspect. 2009; 117(6): 898–903. doi:10.1289/ehp.0800108PMID:
19590680
35. Chen R, Kan H, Chen B, Huang W, Bai Z, Song G, et al. Association of Particulate Air Pollution With Daily Mortality The China Air Pollution and Health Effects Study. American journal of epidemiology. 2012 June 8. doi:10.1093/aje/kwr425
36. Cao J, Xu H, Xu Q, Chen B, Kan H. Fine particulate matter constituents and cardiopulmonary mortality in a heavily polluted Chinese city. Environmental health perspectives. 2012; 120(3): 373–378. doi:10. 1289/ehp.1103671PMID:22389181
37. Dockery DW and Spengler JD. Indoor-outdoor relationships of respirable sulfates and particles. Atmos Environ. 1981; 15: 335–343.
38. Ozkaynak H, Xue J, Weker R, Butler D, Spengler J. The Particle TEAM (PTEAM) study: analysis of the data. Volume III. Draft Final Report. Contract #68-02-4544. US EPA. Research Triangle Park, NC.1993.
39. Ozkaynak H, Xue J, Spengler J, Wallace L, Pellizzari E, Jenkins P. Personal exposure to airborne parti-cles and metals results from the Particle TEAM study in Riverside, California. J Expos Anal Environ Epi-demiol. 1996; 6: 57–78. PMID:8777374
40. Ott W, Wallace L, Mage D. Predicting particulate (PM10) personal exposure distributions using a ran-dom component superposition statistical model. J Air Waste Manage Assoc. 2000; 50:1390–1406. PMID:11002601
41. Lazaridis M, Aleksandropoulou V, Smolik J, Hansen JE, Glytsos T, Kalogerakis N. Physico-chemical characterization of indoor/outdoor particulate matter in two residential houses in Oslo, Norway: mea-surements overview and physical properties–URBAN–AEROSOL Project. Indoor air. 2006; 16(4): 282–295. PMID:16842609
42. Hoek G, Kos G, Harrison R, de Hartog J, Meliefste K, ten Brink H, et al. Indoor–outdoor relationships of particle number and mass in four European cities. Atmospheric Environment. 2008; 42(1): 156–169. 43. Diapouli E, Chaloulakou A, Koutrakis P. Estimating the concentration of indoor particles of outdoor
ori-gin: A review. Journal of the Air and Waste Management Association. 2013; 63(10): 1113–1129. PMID:
24282964
44. Zhou B, Zhao B. Population inhalation exposure to polycyclic aromatic hydrocarbons and associated lung cancer risk in Beijing region: Contributions of indoor and outdoor sources and exposures. Atmo-spheric Environment. 2012; 62: 472–480.
45. Lee HS, Kang BW, Cheong JP, Lee SK. Relationships between indoor and outdoor or quality during the summer season in Korea. Atmos Environ. 1997; 31: 1689–1693.
46. Lachenmyer C, Hidy GM. Urban measurements of outdoor/indoor PM concentrations and personal 2.5 Exposure in the Deep South. Part I. pilot study of mass concentrations for nonsmoking subjects. Aero-sol Sci Technol. 2000; 32: 34–51.
48. Reff A, Turpin BJ, Porcja RJ Giovennetti R, Cui W, Weisel CP, et al. Functional group characterization of indoor, outdoor, and personal PM2. 5: results from RIOPA. Indoor Air. 2005; 15(1): 53–61. PMID:
15660568
49. Wallace A, William R. Use of personal-indoor-outdoor sulfur concentrations to estimate the infiltration factor and outdoor exposure factor for individual homes and persons. Environ Sci Technol. 2005; 39: 1707–1714. PMID:15819228
50. Polidori A, Arhami M, Sioutas C, Delfino RJ, Allen R. Indoor/outdoor relationships, trends, and carbona-ceous content of fine particulate matter in retirement homes of the Los Angeles basin. J Air Waste Man-age Assoc. 2007; 57:366–379. PMID:17385604
51. Meng QY, Turpin BJ, Korn L, Weise CP, Mosrandi M, Colome S, Zhang J, et al. Influence of ambient (outdoor) sources on residential indoor and personal PM2.5 concentrations: Analyses of RIOPA data. J Expos Anal Environ Epidemiol. 2005; 15:17–28. PMID:15138449
52. Hanninen OO, Lebret E, Ilacqua V, Katsouyanni K, Künzli N, Srám RJ, et al. Infiltration of ambient PM2.5 and levels of indoor generated non-ETS PM2.5 in residences of four European cities. Atmos. Environ. 2004; 38: 6411–6423.
53. Wichmann J, Lind T, Nilsson MA, and Bellander T. PM2.5, soot and NO2 indoor-outdoor relationships at homes, pre-schools and schools in Stockholm, Sweden. Atmos Environ. 2010; 44:4536–4544. 54. Landis MS, Norris GA, Williams RW, Weinstein JP. Personal exposures to PM2.5 mass and trace
ele-ments in Baltimore, MD, USA. Atmos Environ. 2001; 35: 6511–6524.
55. Williams R, Suggs J, Rea A, Sheldon L, Rodes C, Thornburg J. The Research Triangle Park particulate matter panel study: modeling ambient source contribution to personal and residential PM mass concen-trations. Atmos Environ. 2003; 37: 5365–5378.
56. Meng QY, Turpin BJ, Lee JH, Polidori A, Weisel CP, Morandi M, et al. How does infiltration behavior modify the composition of ambient PM2. 5 in indoor spaces? An analysis of RIOPA data. Environmental science and technology. 2007; 41(21): 7315–7321. PMID:18044505
57. Meng QY, Spector D, Colome S, Turpin B. Determinants of indoor and personal exposure to PM2.5 of indoor and outdoor origin during the RIOPA study. Atmos Environ. 2009; 43: 5750–5758. PMID:
20339526