www.nat-hazards-earth-syst-sci.net/13/1913/2013/ doi:10.5194/nhess-13-1913-2013
© Author(s) 2013. CC Attribution 3.0 License.
Natural Hazards
and Earth System
Sciences
Geoscientiic
Geoscientiic
Geoscientiic
Geoscientiic
Modelling the benefits of flood emergency management measures
in reducing damages: a case study on Sondrio, Italy
D. Molinari1, F. Ballio1, and S. Menoni2
1Politecnico di Milano, Dept. of Civil and Environmental Engineering, Milan, Italy 2Politecnico di Milano, Dept. of Architecture and Urban Studies, Milan, Italy
Correspondence to:D. Molinari ([email protected])
Received: 28 March 2012 – Published in Nat. Hazards Earth Syst. Sci. Discuss.: – Revised: 6 May 2013 – Accepted: 31 May 2013 – Published: 1 August 2013
Abstract.The European “Floods Directive” 2007/60/EU has
produced an important shift from a traditional approach to flood risk management centred only on hazard analysis and forecast to a newer one which encompasses other aspects rel-evant to decision-making and which reflect recent research advances in both hydraulic engineering and social studies on disaster risk. This paper accordingly proposes a way of mod-elling the benefits of flood emergency management interven-tions calculating the possible damages by taking into account exposure, vulnerability, and expected damage reduction. The results of this model can be used to inform decisions and choices for the implementation of flood emergency manage-ment measures. A central role is played by expected dam-ages, which are the direct and indirect consequence of the occurrence of floods in exposed and vulnerable urban sys-tems. How damages should be defined and measured is a key question that this paper tries to address. The Floods Direc-tive suggests that mitigation measures taken to reduce flood impact need to be evaluated also by means of a cost–benefit analysis. The paper presents a methodology for assessing the effectiveness of early warning for flash floods, considering its potential impact in reducing direct physical damage, and it assesses the general benefit in regard to other types of dam-ages and losses compared with the emergency management costs. The methodology is applied to the case study area of the city of Sondrio in the northern Alpine region of Italy. A critical discussion follows the application. Its purpose is to highlight the strengths and weaknesses of available mod-els for quantifying direct physical damage and of the general model proposed, given the current state of the art in damage and loss assessment.
1 Introduction
The European “Floods Directive” 2007/60/EU represents the first attempt to develop concerted and coordinated action at the EU level with the aim of improving the overall level of flood protection in Europe. The Floods Directive asks mem-ber states to accomplish three tasks: (i) conduct a prelimi-nary flood risk assessment by 2011, (ii) prepare flood hazard maps and flood risk maps by 2013, and (iii) define flood risk management plans (FRMPs) by 2015. FRMPs, in particular, “shall address all aspects of flood risk management focus-ing on prevention, protection, preparedness, includfocus-ing flood forecasts and early warning systems (. . .)” (EU, 2007).
The Floods Directive not only addresses the need to con-sider the different phases of risk management but also asks for a cost–benefit analysis of the mitigation options that may be taken to manage risk. Whilst these requirements are wel-come in light of the scientific achievements and recent un-derstanding of risk, they charge decision-makers and officials responsible for civil protection and emergency management with new duties and challenges that not only are they not al-ways able to handle but for which scientific and technical de-velopment is still probably insufficient to provide standard-ised methods. In this regard, the content of the Floods Direc-tive may be seen as a work programme for both public ad-ministrations in charge of its application and for researchers, who are increasingly asked to provide support and techni-cal expertise for the complex tasks entailed by the new flood policy.
With the overall aim of supporting the competent authori-ties in their compliance with the Floods Directive, this pa-per focuses on two crucial aspects of the flood risk man-agement cycle: emergency preparedness and manman-agement. Emergency preparedness has been broadly defined as “the readiness of a political jurisdiction to react constructively to threats from the environment in a way that minimises their negative consequences of impact to health and safety of individuals and the integrity and functioning of physical structures and systems” (Perry and Lindell, 2003). Likewise, flood emergency management (FEM) has been defined as “the preparation for and the carrying out of all emergency functions necessary to mitigate, prepare for, respond to, and recover from emergencies and disasters caused by all floods” (EM, 2007).
This paper will consider only preparedness and response activities, specifically related to flood protection measures, including and implying flood early warning systems (EWSs). In fact, where a risk is present, it is impossible to completely protect communities from the likelihood of a disastrous event even in the few cases where appropriate preventative mea-sures have been implemented. Consequently, there is always a residual risk for exposed systems which can be handled by FEM activities, possibly linked to EWSs.
The primary objective of any emergency management pro-cess is to protect people’s lives; secondly, it is to mitigate po-tential damage. Ergo, the purpose of early warning is to en-able “actions to be taken to mitigate potential loss and dam-age (. . .); the usefulness of an EWS should be judged less on whether warnings are issued per se, but rather on the ba-sis of whether the warnings facilitate appropriate and timely decision-making by those people at risk” (Maskrey, 1997). This paper accordingly seeks to answer the following ques-tions: how can expected loss and damage reduction due to FEM measures be estimated? To what extent are the results reliable? What is the value of the knowledge furnished by this kind of analysis in supporting FEM?
The first part of the paper identifies models available for the estimation of damage reduction and organises them into
a procedure to assess the benefits associated with FEM. To be noted is that the objective of the paper is not to develop new models; on the contrary, its aim is to organise available knowledge on damage estimation into a systematic and op-erational procedure as required by the problem investigated. The second part of the paper considers the economic saving due to FEM measures estimated in a case.
2 A possible model for FEM
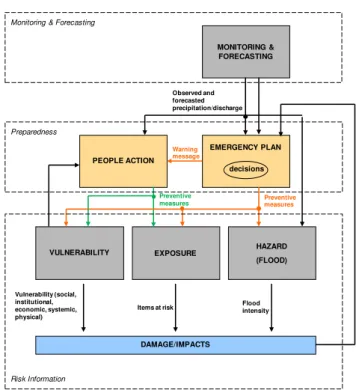
Figure 1 depicts an idealised model of FEM activities linked with EWSs as conceived in this paper. It shows the main tem-poral phases of FEM in detail: (i) when a flood is monitored or forecasted, civil protection personnel (i.e. those in charge of dealing with the emergency) take decisions, doing so ide-ally in accordance with the emergency plans. Decisions are made on the basis of risk thresholds. Hence, when observa-tions and/or forecasts exceed a threshold value, (ii) the cor-responding warning level and mitigation actions are imple-mented. The latter are intended to reduce exposure, vulnera-bility and flood intensity. (iii) Once the warning has been is-sued, people may react to it by implementing mitigation mea-sures. Extensive research (Handmer and Ord, 1986; Sorensen and Mileti, 1989; FLOODsite, 2008) has shown that many aspects shape people’s responses. They include the situa-tional context in which a flood occurs (e.g. the time of the day or the day of the week, lead time), the local context (in-cluding socio-political culture, preparedness, disaster educa-tion, previous experience, community involvement, etc.) and the community context (including people’s age, gender, du-ration of residence, ethnicity, income, education, personality, family context, etc) – this is highlighted in the scheme by the reverse-direction arrow on the left side – the warning charac-teristics (e.g. timing, warning source, mode of communica-tion, warning message) and the disaster’s characteristics (e.g. riverine or flash flood, presence of environmental cues and/or indicators). According to the “values” that such variables as-sume, people may acknowledge (or not) a warning, as well as decide (or not) to react. When present, their reactions are usually aimed at reducing exposure and/or vulnerability. (iv) The extent of the items at risk (after mitigation measures have been implemented), their vulnerability (in all its aspects: so-cial, institutional, functional, and physical), and flood inten-sity define the damage expected.
scheme recognises that, when emergency plans are devel-oped, actions must be linked not only with flood forecasts but also with the “flood intelligence” available for those forecasts (i.e. expected damage).
For the sake of simplicity, the described warning process refers however to a “non-expert” system, meaning when de-cisions on warning/mitigation actions are taken for the first time in the course of a flood emergency. Actually, links (i.e. cause–effect relations) other than those discussed could arise, according to the time of the analysis. For example, once a first warning has been issued, decisions about mitigation measures (as well as further warnings) usually depend not only on monitoring and forecasting data but also on how the flood is unfolding: thus, a link arises between flood and emer-gency response. More generally, whilst the scheme refers only to forecasted data it is possible that, along the warn-ing and the emergency management process, links arise also among observed data (with respect to hazard as well as ex-posure and vulnerability).
The scheme in Fig. 1 is grounded on the “four-phase EWS”, promoted by the International Strategy for Disaster Risk Reduction (ISDR), which is also in line with the concept of a “total warning system” developed by Australian author-ities (EMA, 1999). According to both, in order to transform hazard warning information into effective emergency man-agement (i.e. risk reduction), EWSs must be made up of a number of integrated sub-systems:
– a monitoring and forecasting sub-system to monitor and forecast hazards to produce information about impend-ing events;
– a risk information sub-system to develop risk scenar-ios to figure out the potential impact of an impending event (on specific vulnerable groups and sectors of the society);
– a preparedness sub-system to develop strategies and ac-tions required to reduce the damage from an impending event; and
– a communication sub-system to communicate timely in-formation on an impending event, potential risk scenar-ios and preparedness strategies.
Figure 1 clearly shows how these sub-systems can be mapped on the proposed scheme; the communication sub-system can-not be mapped, however, as communication occurs every-where along the warning chain; involving functions and ac-tors from different sub-systems, it should be seen then as something that is shared between the others components rather than an independent entity.
One feature of the scheme is that it links monitoring and forecasting with emergency response. The two aspects are often considered separately, above all in the hazard assess-ment community (e.g. Basha and Rus, 2007; Haggag and Ya-mashita, 2010; Krzhizhanovskaya et al., 2011; Cools et al.,
Preventive measures
EMERGENCY PLAN
decisions
HAZARD (FLOOD)
Flood intensity MONITORING & FORECASTING
Warning message
PEOPLE ACTION
VULNERABILITY
DAMAGE/IMPACTS EXPOSURE
Preventive measures
Items at risk Vulnerability (social,
institutional, economic, systemic, physical)
Monitoring & Forecasting
Preparedness
Risk Information
Observed and forecasted precipitation/discharge
Fig. 1.Scheme of emergency activities linked to EWS. Coloured arrows represent mitigation measures implemented during a warn-ing, whose effects need to be modelled. The scheme also shows how sub-systems of an EWS can be mapped on the scheme.
2012). The scheme recognises how they affect each other so that emergency planners could not abstract one aspect from another in the design of mitigation strategies.
The main advantage of the scheme with respect to other EWSs’ representation (see e.g. Seng, 2012; FLOODsite, 2008) is to identify links among the various components/sub-systems of an EWS as well as the variety of models (repre-sented by rectangles in the figure) which are required to de-sign EWSs, along with their inputs and outputs (represented by arrows in the graph). This would support the development of more efficient EWSs – that is, the design of better emer-gency measures. In fact, the scheme supports a non-myopic attitude, according to which all actors within the whole sys-tem (being a technician or not) should behave by taking into account that their actions affect not only their “models” but the system as a whole. The general idea is then promoting a systemic vision of the warning problem.
According to the scheme, several models are required for the following purposes:
– to produce flood forecasts, according to observed data;
– for hazard, exposure, and vulnerability assessments, taking into account preventive measures implemented after the warning;
– to evaluate the effect (on potential damage) of FEM measures implemented during the event by both civil protection and lay people.
They supply all the knowledge (on damage data and hazard data) on the bases of which proper warning rules and FEM actions/measures can be defined (see case study, Sect. 3.6).
The models that have until recently received by far the most attention are those needed to monitor and forecast floods. Although it is obviously important to assess whether systems and models correspond to the state of the art and match the specific characteristics of the territories being monitored and for which the forecasting is performed, as suggested by Maskrey (1997), when an alert is issued, the relevant question to ask is whether or not it supports deci-sions that translate into damage and loss reduction compared with the situation in which no action is taken. The answer to this apparently banal question is by no means simple, and it requires consideration of all the crucial steps in Fig. 1 in or-der to define the extent to which the warning system embed-ded in the emergency management process is effective. Even more challenging is answering the question of the extent to which the cost implied by taking measures is balanced by the obtained benefit as stated in the Floods Directive. In fact, the emergency management cost relative to the actions taken (which in the case of floods may range from very simple pre-cautions such as closing access to flooding zones, through suggesting the elevation of goods from ground-level floors, to much more challenging actions like evacuation) must be compared to the benefit relative to the losses and damage avoided.
In the following section, existing models for damage esti-mation are implemented on a case study with the objective of finding answers to previous questions; this actually means (a) specifying models required by the scheme in Fig. 1 among available ones, and (b) evaluating whether their results sup-port the decision-making process. Before analysing the case study, however, flood damage must be identified, and avail-able models need to be described and organised in a workavail-able procedure.
2.1 Potential damage in the case of flood
At present, the literature on the estimation of damage pro-voked by natural hazards does not make it possible to draw up a generally agreed-upon classification and corresponding definitions of the various types of damage associated with natural hazards (see Margottini et al., 2011). The Floods Di-rective seems to avoid the issue by asking for an assess-ment of potential “impacts” on a number of key eleassess-ments; yet the translation into damage is unavoidable for carrying out a cost–benefit analysis.
According to the FLOODsite project (FLOODsite, 2007), flood damages are mostly categorised firstly in direct and in-direct damages and secondly in tangible and intangible dam-ages; however, even this classification is not univocal as
dif-ferences exist among the definitions of damage categories (Parker et al., 1987; Smith and Ward, 1998; Penning-Rowsell et al., 2005; Messner and Meyer, 2005).
What clearly emerges from research and case studies is that different types of impact must be considered: firstly and most importantly, the consequences for people’s lives and health. This is generally considered an intangible type of damage as well as damage to cultural heritage and to the natural environment. Indeed, difficulties arise when an eco-nomic value must be given to loss of life and lost monuments or biotopes. In this paper, the effectiveness of FEM measures associated with early warning will not be evaluated as far as intangibles are concerned. However, as the essential objec-tive of emergency management is to save lives (which is of more primary concern than economic savings), consideration is made concerning the potential of actions implemented in terms of lives saved and the loss of memorabilia prevented (see Sects. 3.6 and 4). Some reference models for the eval-uation of casualties due to flooding, especially as a conse-quence of dam failures, can be found in reports by the US Bureau of Reclamation (USBR, 1999), by the EU SUFRI project (SUFRI, 2011), and by the US Army Corps of En-gineers (Lehman and Needham, 2012).
Another category of damage consequent on the stress pro-voked by natural hazards is labelled “indirect”: this con-cerns potential enchained and ripple effects in different sec-tors of services and the economy. In the case of indirect damages there is no agreed-upon assessment methodology (Cochrane, 2004). Several methods exist, each of which con-siders a different aspect of the economy or services (Rose, 2004; Al-kuwaiti et al., 2006); moreover, there are discrepan-cies among the ways in which different agendiscrepan-cies and differ-ent scholars define indirect damage (Margottini et al., 2011). For example, both emergency costs and losses due to busi-ness/service interruption are considered as indirect damages by the FLOODsite project (FLOODsite, 2007), while they are treated as distinct and specific categories in the ConHaz project (ConHaz, 2012).
Damages (indirect) due to business/service disruption are not considered in the present study. Penning-Rowsell et al. (2005) suggest that “in the majority of cases, indirect losses are unlikely to be significant as the contribution to (na-tional) economic losses is always close to zero (. . .). As a result of these evidences, calculating indirect damage is not recommended unless there is an indication that a property or a sector is likely to contribute significantly to the overall present value of damages”. Quantification of indirect dam-ages can be omitted in the case study presented in this pa-per, at least from the perspective of the key FEM stakeholder that has been chosen, i.e. a mayor or a local floodplain man-ager.
implications of uncertainties in flooding forecasts are consid-ered in the evaluation of the most suitable mitigation strategy for the case analysed.
2.2 Modelling damage reduction
Evaluating damage reduction due to FEM measures is equiv-alent to modelling the effect (on potential damage) of mit-igation actions implemented during the event by both civil protection and lay people. These are represented in Fig. 1 by the coloured continuous arrows. Thus two steps are required, as previously described:
– the assessment/modelling of potential damage; and
– the assessment/modelling of the extent to which mitigation measures are able to mitigate/reduce poten-tial damage.
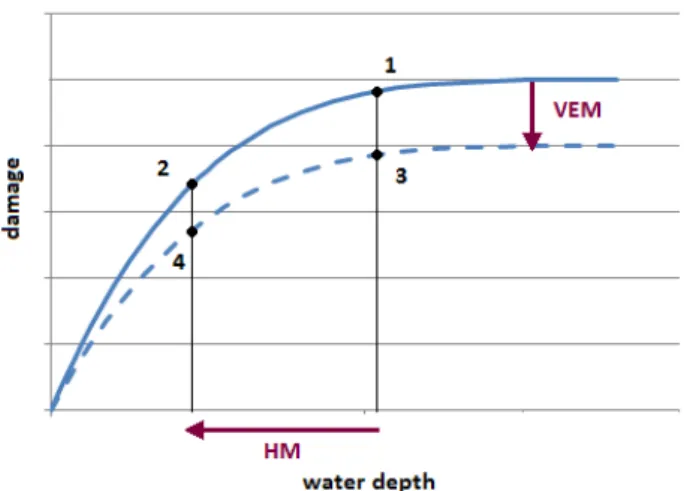
Improving potential physical/direct damage models would fall outside the scope of this paper. A variety of tools are already available in the literature (see e.g. Smith, 1994; Thieken et al., 2005, 2008; Luino et al., 2006; FLOOD-site, 2007; SUFRI, 2011; Lehman and Needham, 2012). Put briefly, potential damages are usually estimated by means of depth–damage curves (which show expected damage to af-fected items against water depth), field surveys or back anal-yses of damage data. Assessments of this kind require knowl-edge about the features of the flood, the extent of the ele-ments at risk (i.e. their exposure), as well as their vulnerabil-ity. Fewer tools are available to model mitigation measures (see e.g. Day, 1970; Chatterton and Farrel, 1977; Handmer and Smith, 1990; Parker et al., 2007), and a standardised method does not exist. In this paper the effects of mitiga-tion measures on potential damage are modelled differently according to the objectives that the measures are designed to achieve. Measures can be grouped as follows (see Fig. 2): (i) those reducing the intensity of the hazard (i.e. the raising of levees and their reinforcement, bridge gates, temporary dikes, etc.), which are usually carried out by civil protection and (ii) those intended to limit exposure and vulnerability (e.g. moving contents, temporary water gates, etc.), which are implemented by both civil protection and individuals. In both cases, the effectiveness of measures depends on the level of preparedness as well as on the time available for their im-plementation. But the effect on the potential damage curve is different.
In the first case, mitigation actions imply that, for a given event, the water depth in the flooded area decreases. Accord-ingly, a shift occurs along the x-axis (identified by HM in Fig. 2) so that if 1 represents the starting point for poten-tial damage, 2 represents the new value for damage after HM mitigation actions.
In the second case, the actions taken are represented in the form of a different curve describing the damage. The latter can be interpreted as the consequence of a shift (identified by
Fig. 2.Effect of hazard mitigation (HM) and vulnerability and ex-posure mitigation (VEM) on potential damages.
VEM in Fig. 2) in the original damage curve so that, for a cer-tain water depth, damage is reduced by mitigating exposure and/or vulnerability. Accordingly, if 1 represents the starting point for potential damages, the new value for damage, after VEM preventive actions, is 3. Clearly, the combination of the two kinds of actions brings the original damage to point 4.
As a matter of fact, at present, whilst the effect of mitiga-tion acmitiga-tions on hazard reducmitiga-tion can always be estimated by means of a hydraulic analysis, how the consequences of mea-sures to mitigate exposure and vulnerability can be evaluated is still an open question (Carsell et al., 2004; FLOODsite, 2008). The most common approach is that of considering a fixed shift in the potential damage curve so that damage re-duction can be considered as a fixed percentage of potential damage, for every water depth. In this regard, the report “Non structural flood plain management – Measures and their ef-fectiveness” by the International Commission of the Protec-tion of the Rhine (ICPR, 2002) indicates reference value for several mitigation measures, including FEM measures. Un-fortunately, it remains unclear which data basis these esti-mates rely on (Kreibich et al., 2005). Reference values can be found also in Pennig-Rowsell at al. (2005), at least with re-spect to people’s action. More reliable estimates would come from survey conducted among affected household after the Elbe flood in 2002, for example by Thieken et al. (2005), Kreibich at al. (2005) and Thieken et al. (2007). Finally, al-though not relevant for the present study, effects of warning systems on life loss evaluations (for dam break scenarios) are considered in Lehman and Needham (2012).
3 Case study
First, the potential direct damage in the case of flood in the area is estimated, followed by assessment of the reduction in such damage if mitigation actions are taken. Second, the ef-fectiveness of emergency management is evaluated by com-bining considerations of reduced direct damages, reduced impact on people’s lives, and emergency management costs. It is important to point out that it is not the case study’s purpose to provide an exact estimate of damages/costs. This would be excessively challenging for two reasons. The first concerns the accuracy of models: the literature highlights that depth–damage curves (and, more generally, damage mod-els) are affected by high degrees of uncertainty (Merz et al., 2004), which influences the reliability of results. The sec-ond reason relates to the context investigated. Generally, spe-cific tools and data for damage estimation are not available for Italy. A few examples of Italian depth–damage curves are provided, for instance, in De Lotto and Testa (2000), Olivieri and Santoro (2000), Luino et al. (2006). Neverthe-less, such methods are site-specific, and therefore valid only for the context in which they have been derived. Hence, tools available from other countries/contexts must often be imple-mented (and assumptions must be made about data required as inputs) in the awareness that their fit with Italian contexts must still be proved (and represents a priority for future re-search). This further reduces the accuracy of results.
3.1 Hazard and FEM in the city of Sondrio
The case investigated is the city of Sondrio, in the Ital-ian Alpine region. The city is located in the river Mallero catchment area, which is situated on the southern flanks of the Alps in northern Italy (see Fig. 3). As the capital city of the homonymous province, the main economic activity in Sondrio is tertiary; all the main services are located in the town (education, health, government, business, entertain-ment, etc.) and cater not only to its approximately 22 000 inhabitants but also to those of the province as a whole (180 000 people).
Sondrio has a long history of flooding; in the last cen-tury alone floods occurred four times. Flash flooding (with a concentration time in the order of three hours) coupled with river bed aggradation is the main hazard for the city. Con-centrated and diffused landslides are also a hazard through-out the region: sediments from these slides are transported downstream, causing aggradation which, in its turn, causes water levels and flood frequency to increase.
The bankfull discharge (i.e. the minimum river discharge above which flooding occurs) for the river Mallero in Sondrio has been estimated at 110 m3s−1(Molinari, 2011); this value takes account of reduced river conveyance due to aggrada-tion. In spite of the rich technical documentation on the haz-ard scenarios (see e.g. Franzetti, 2005; Radice et al., 2013) on which the emergency plan for the city is based, information about the return period of such an event is not available, nor are the authors of the present paper aware of methods with
which to define joint probabilities for discharge values and aggradation conditions. However, the history of floods in the city suggests that a combination of the two effects is not a rare event, and that such a combination may easily generate critical scenarios. Indeed, in the case of flooding, almost the entire city centre may be affected – as shown in Fig. 4, which displays the hazard map for an extremely severe hazard sce-nario (i.e.Q∼=340 m3s−1) (Franzetti, 2005).
FEM in Sondrio is the responsibility of the local authori-ties (i.e. the mayor is the first responder), which have drawn up an emergency plan to deal with flood events. The plan states the actions to be implemented by both civil protection and lay people after a warning is issued. The warning system is based on river discharge thresholds: when flood forecasts exceed one of these thresholds, the corresponding warning level is implemented.
The plan schedules two main mitigation measures in the case of warning:
– the use of temporary gates (henceforth “bridge gates”) to close river bank openings at bridges, which is done by civil protection;
– individual actions by people, such as moving contents, turning the gas off, sandbagging, etc.
Both actions are adopted when forecasts exceed the bankfull discharge value.
3.2 Potential damage assessment if no action is taken
To estimate potential damage in Sondrio, we focused on the following types of damage:
– physical/direct damage to buildings; and
– physical/direct damage to transportation infrastructures. Physical/direct damage to buildings and infrastructures was calculated by means of depth–damage curves; specifically, curves by the US Army Corps of Engineers (USACE, 2003) were implemented for buildings, while the Dutch Standard Method (Kok et al., 2005) was adopted for infrastructures. The methods were selected taking into account their transfer-ability to the context investigated: that is, the correspondence between hazard and vulnerability parameters considered in the methods and available knowledge about the hazard and the vulnerability of exposed items. In this regard, hazard data (i.e. spatial distribution of water depth) were derived by in-terpolating results from a 2-D hydraulic model for the area under investigation. The procedure is described in detail in Molinari (2011). Knowledge on exposure and vulnerability derives instead from previous studies in the investigated ar-eas (Franzetti, 2005; Ballio et al., 2010).
Fig. 3.Map of northern Italy. Sondrio is identified by the red marker A.
Fig. 4.Sondrio hazard map whenQ=340 m3s−1(adapted from Franzetti, 2005).
3.3 Damage avoided thanks to adopted mitigation
measures
As mentioned in Sect. 2.2, estimation of damage reduction consisted in assessing the effect of the mitigation measures scheduled in the emergency plan (i.e. bridge gates and peo-ple’s actions) on potential damage.
1.E+02 1.E+04 1.E+06 1.E+08
0 100 200 300
D
a
m
a
g
e/
c
o
st
[
€
]
River discharge [m3/s]
(a) buildings (b) emergency (c) infrastructures
a
b c
flood discharge threshold
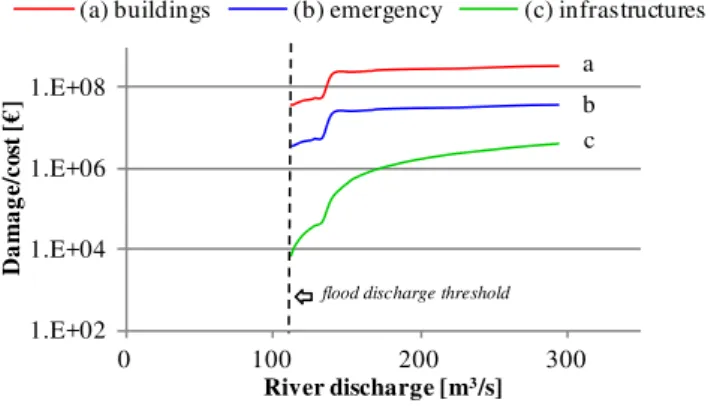
Fig. 5.Results of potential damage assessment and emergency costs estimation: comparison among(a)buildings (structure + contents),
(b)emergency costs, and(c)infrastructures. N.B. The log scale has been assumed for the damage axis.
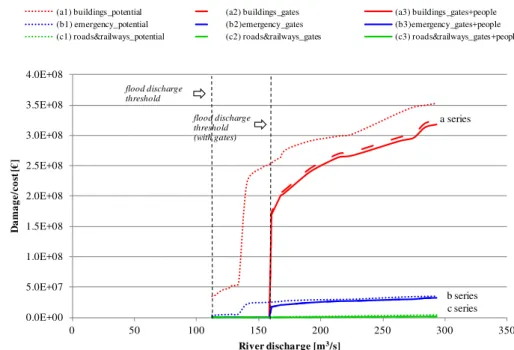
According to the analysis, the bankfull discharge increases up to 160 m3s−1.
People’s actions are instead intended to reduce damage to building contents; these were modelled as a shift in potential depth–damage curves (see Sect. 2.2). In detail, a fixed per-centage of potential damage to building contents was con-sidered for every water depth value. This percentage was 4.5 %, according to the value suggested by the British Multi-Coloured Manual (Penning-Rowsell et al., 2005), for the warning context observed in Sondrio, i.e. a warning lead time of less than eight hours and a population with no previ-ous flood experience. Indeed, a questionnaire survey revealed that people’s preparedness and experience in dealing with floods were low in Sondrio (Ballio et al., 2010) despite the occurrence of four flood events in the last century. This is the result of the community’s loss of memory due to two fac-tors: (a) the significant time lag from the last event, which occurred in 1987, and (b) emigrant and immigrant flows in Sondrio over the past three decades, which have changed the social structure of the community.
Figure 6 compares the results of potential damage estima-tion against river discharge if mitigaestima-tion acestima-tions are imple-mented or not impleimple-mented. To be noted is that the figure distinguishes between the effect of bridge gates only and the joint effect of bridge gates and people’s actions.
3.4 Challenges in modelling emergency management
costs associated with the mitigation measures selected
Emergency costs were not collected in the past for the area under investigation, and existing data at provincial/regional level did not allow inference of estimation tools for the scale under investigation. For this reason, a literature review was carried out. The survey found that few tools are available for emergency costs estimation; among those available, the
model suggested by Penning-Rowsell et al. (2005) was im-plemented in the case study. The model estimates emergency costs as a fixed percentage of the value of physical/direct damage to buildings equal to 10 %. Figure 5 displays the value of emergency costs against river discharge for the case study.
3.5 Quantifying the role of forecasts uncertainty
So far, damage reduction has been computed in the case that a perfect forecast is made and mitigation actions are always implemented, if required. However, because of forecasting errors, it may happen that a flood occurs where no mitigation actions have been applied (i.e. in the case of missed events) or emergency costs (due to warning) are borne even if they are not really necessary (i.e. in case of false warnings). As a consequence, estimation of damage reduction should con-sider forecasting errors as well.
If all the possible combinations between forecasts (f) and observations (o) are taken into account, four warning out-comes are possible (see Table 1). In the case of Sondrio, three different flood forecasts are provided, according to three different hypotheses concerning the precipitation scenario; Forecast Scenario 1 assumes an increase in future precipi-tation (compared to observations), Forecast Scenario 2 sup-poses the normal course of observed precipitation, and Fore-cast Scenario 3 assumes that observed precipitation stops at the beginning of the simulation (for details, see Molinari et al., 2011). The back analysis conducted in Molinari (2011) allows computation contingency tables of warning outcomes (see Table 2) showing the relative frequency of occurrence of different (f−o) combinations for the three forecast scenar-ios in Sondrio (for a more comprehensive analysis of forecast accuracy in Sondrio, see also Molinari et al., 2011).
In fact, modelling three forecast scenarios is equivalent to modelling hydrologic uncertainty with respect to the trigger-ing meteorological event. The three forecast scenarios can thus be understood as (a) the “for safety” scenario, i.e. Fore-cast Scenario 1; (b) the intermediate scenario, i.e. ForeFore-cast Scenario 2; and (c) the “against safety” scenario, i.e. Fore-cast Scenario 3. Accordingly, Table 2 indicates that ForeFore-cast Scenario 1 tends to overestimate (i.e. false warning are fre-quent), while underestimation is likely in the case of Forecast Scenario 3 (i.e. missed events are frequent).
On the basis of Table 2, damage reduction can be esti-mated with forecasting errors considered. Table 3 reports, as an example, the estimate results for the hazard scenario when
0.0E+00 5.0E+07 1.0E+08 1.5E+08 2.0E+08 2.5E+08 3.0E+08 3.5E+08 4.0E+08
0 50 100 150 200 250 300 350
D
a
m
a
g
e
/c
o
st
[
€
]
River discharge [m3/s]
(a1) buildings_potential (a2) buildings_gates (a3) buildings_gates+people (b1) emergency_potential (b2)emergency_gates (b3)emergency_gates+people (c1) roads&railways_potential (c2) roads&railways_gates (c3) roads&railways_gates+people
a series
b series c series flood discharge
threshold
flood discharge threshold (with gates)
Fig. 6.Potential damage and emergency costs if preventive measures are implemented or not implemented. The figure distinguishes among different classes (referred to as a, b, c; to be noted is that “a” includes damage to both buildings structure and contents) and between the effect of bridge gates only and the joint effect of bridge gates and people’s actions (referred to as 2 and 3).
Table 1.Warning outcomes:Qtrepresents the flood discharge, which corresponds to the threshold value at which a warning is issued.
Warning outcome Definition Discharge values
[m3s−1]
False Warning – FW A warning is issued but no flood occurs o < Qtandf > Qt Missed Event – ME A flood occurs but no warning is issued o > Qtandf < Qt Forecasted Event – H Forecasted flood occurs o > Qtandf > Qt Calm – N A flood is neither forecasted nor does one occur o < Qtandf < Qt
Table 2.Contingency tables of warnings outcomes for the three forecast scenarios.
o > Qt o < Qt
Forecast Scenario 1
f > Qt 0.31 0.22
f < Qt 0.17 0.31
Forecast Scenario 2
f > Qt 0.22 0.08
f < Qt 0.25 0.44
Forecast Scenario 3
f > Qt 0.14 0.08
f < Qt 0.33 0.44
In detail:
– columns 2 and 3 report the probability of missed and hit events, conditioned to the evidence that a flood oc-curs (o > Qt), for each forecast scenario. In addition to real scenarios, the scenario in which no forecast is pro-vided and the ideal case in which a perfect forecast ex-ists are also considered in order to compare reality with the ideal and worst cases. To be noted is that the “no forecast” scenario corresponds to the one in Sect. 3.2, and the “perfect” scenario to the one in Sect. 3.3. Con-ditioned probabilities are computed from Table 2 by as-suming that relative frequencies are estimates of warn-ing outcome probabilities.
Table 3.Potential damage considering forecasting errors for the hazard scenarioQ=170 m3s−1.
Forecast scenario P (f < Qf|o > Qf) P (f > Qf|o > Qf) Actual damage Damage reduction
ME H [M C] [M C (%)]
Gates Gates + people Gates Gates + people Difference
No Forecast 1 0 300 300 0 0
Perfect 0 1 228 223 72 (24 %) 76.9 (25.6 %) 4.9 (1.6 %)
Scenario 1 0.35 0.65 253 250 46.8 (15.6 %) 50 (16.6 %) 3.2 (1 %)
Scenario 2 0.53 0.47 266 264 33.8 (11.3 %) 36.1 (12 %) 2.3 (0.8 %)
Scenario 3 0.71 0.29 279 278 20.9 (6.9 %) 22.3 (7.4 %) 1.4 (0.5 %)
means of the following equation: PDi =P (f < Qt|o > Qt)i·PDno
+P (f > Qt|o > Qt)i·PDperfect, (1) whereP (f < Qt|o > Qt)iandP (f > Qt|o > Qt)iare the conditioned probabilities for thei-th scenario, PDi are potential damages for the i-th scenario; PDno are potential damages as computed in Sect. 3.2 (i.e. when no preventive measures are adopted) and PDperfect are potential damages in the case of a perfect forecast, as derived from Sect. 3.3.
– Columns 6 and 7 finally report damage reduction due to preventive actions with respect to the case in which no actions are implemented (i.e. “no forecast”), in terms of absolute and relative value. Column 8 reports the differ-ence in damage reduction due to people’s actions. To be noted is that potential damages were computed with account taken of both the effect of bridge gates and the joint effect of bridge gates and people’s actions.
3.6 Discussion of the damage assessment results
The analyses carried out in the previous sections yield use-ful information regarding both the system under investigation and its functioning during emergencies.
This useful knowledge derives initially from the assess-ment of potential damages if no mitigation measure is imple-mented (Sect. 3.2); in detail, Fig. 5 shows the following:
– physical/direct damage to buildings is significant and represents the main component of the total damage; and
– physical/direct damage to the transportation network is less important than physical/direct damage to buildings; specifically, damage to railway and road infrastructures is, on average, 5 orders of magnitude less than that to buildings for smaller discharge values and 3 orders of magnitude less for larger ones.
The assessment of the damage reduction due to mitigation actions taken as part of FEM (Sects. 3.4 and 3.5) provides useful support for decisions among alternative actions on the
basis of the benefit obtainable and the costs that must be borne. Figure 6 and Table 3 highlight that damage reduc-tion due to mitigareduc-tion acreduc-tions amounts to 10–25 % of the total; however, this is mainly due to bridge gates. This evi-dence suggests the more suitable emergency strategy as well. Indeed, given the benefit deriving from bridge gates, emer-gency managers should act “for safety” and always adopt bridge gates when a flood cue is observed (forecasted), even if uncertainty is high. This is not the present situation in Son-drio, in which the emergency plan calls for bridge gates only after the bankfull discharge has been forecasted. In terms of FEM effectiveness, one should compare the costs associated with the measure with its potential benefit. On the costs side, the actual FEM costs implied by bridge gates are negligi-ble; the only costs that may be relevant are those associated with the closure of transportation infrastructures connecting the two parts of Sondrio and which are also important on a larger geographical scale (up to regional). This cost would have to be paid in any case should a flood occur. By contrast, in the case of no flood, the closure of such roads would rep-resent a net damage for the city and a larger territorial area. However, this indirect damage would be counterbalanced by the computed economic benefit and, most importantly, saved lives. Even though this paper has not assessed indirect (on the economy and traffic) and intangible (people’s lives) damages in quantitative terms, it is clear that the two types of impact can be still evaluated. This evaluation would counsel a pre-cautionary approach in balancing the indirect impact due to road and railway closure against the lives saved. In the case of Sondrio, in fact, although evacuation of people is not nec-essary because of the low depth of water in the case of flood-ing, which is very unlikely to cause buildings to collapse or lead to total inundation (Franzetti, 2005), limiting people’s access to flooded areas is an advisable measure to take con-sidering that road users represent up to half of deaths during floods (Gruntfest and Handmer, 2001; Jonkman and Kelman, 2005).
of buildings (as in the case of bridge gates) but simply re-duce contents exposure/vulnerability. Consequently, consid-ering that major costs may occur if false warnings are fre-quent (also in terms of loss of trust, “crying-wolf” syndrome, etc.), emergency managers may decide to act “against safety” in warning people and wait until a more reliable forecast is available. On the other hand, as suggested by Parker et al. (2007), “there are also important collective, public safety and security benefits (from warning) which are rarely measured in economic terms” as, for example, the saving of memo-rabilia. The FLOODSite project (FLOODsite, 2008) proved that the value which lay people place on memorabilia is sig-nificant, even more so than the value of economic posses-sions. In this paper, intangibles are not estimated in economic terms; nevertheless, the effectiveness of the above strategies should be assessed also against the capacity to lessen intangi-bles. From this perspective, individual actions such as mov-ing possessions reduce losses of memorabilia.
To summarise, in light of the previous analysis, a dou-ble level of warning should/could be planned. At the first level, when uncertainty is high and there is a significant ad-vance with respect to the flood, the population is not asked to adopt any measures (such as moving house contents, going to higher ground/floors, etc.), but only bridge gates are used to reduce the flood hazard in the city. At the second level, when flood forecasts are more reliable but there is still time to react, people are asked to take specific mitigation measures such as saving content in houses.
As for the analysis of the goodness of forecasts, the fre-quencies displayed in Table 2 suggest that the current system should be significantly improved. Nevertheless, the results in Table 3 make it possible to analyse the system from a dif-ferent perspective, and they may prompt slightly difdif-ferent considerations. It is evident from Table 3 that damage re-duction due to people’s action does not substantially change when real forecast scenarios or perfect forecast ones are con-sidered. On the contrary, it has been stressed that damage reduction is mainly due to bridge gates. Thus, if the above-suggested strategy is adopted (i.e. the double level warning), there is little to be gained from improving the present fore-casting system; indeed, damage reduction could increase by 1.1 % at most. By contrast, the results suggest that educa-tional programmes should be implemented in Sondrio in or-der to increase the effectiveness of people’s actions. As pre-viously discussed, people’s actions are welcome not only for consequent economic benefits but also in terms of intangi-ble savings. Encouraging people to take more effective action should be then a priority of any risk management strategy.
4 Critical discussion
This section discusses the limitations of the methodology proposed by means of a critical analysis of the case study’s results. Indeed, the case study suggests that, at present, there
is an inadequate capacity to model damages and their reduc-tion due to FEM. Hence, the estimareduc-tion results have a num-ber of shortcomings, and it is likely that they are affected by strong uncertainty.
Starting from direct damage, besides the inherent uncer-tainties of damage models (Merz et al., 2004), the estima-tion suffers from one major limitaestima-tion, namely the suitability of implemented models for the investigated context. As dis-cussed in Sect. 3, damage models are indeed site specific, thus the uncertainty of results increases when they are im-plemented in contexts other than those in which they have been derived. In this paper a proper sensitivity analysis is not conducted. However, Molinari (2011) showed that results do not notably change when the curve by Luino et al. (2006) is implemented to estimate damage to buildings instead of USACE’s curves. Considering in detail damage to infrastruc-tures, it must be noted then how current damage estimation does not take account of damage to and installations and related components (e.g. bridges, tunnels, water tanks, pu-rification plants, control rooms, etc.), although these may be of considerable importance. Figure 7 reports, for example, a comparison between damage to buildings and damage to in-frastructures (i) as modelled for the case study and (ii) as de-rived from analysis of RaSDa data. RaSDa (acronym of “Sis-tema per la Raccolta delle Schede Danni”, which translates into English as “System for Damage Data Collection”) is the database of the Lombardia region which has systematically collected damage data relative to all hydrogeological and me-teorological disasters, including floods, since 1992. For the purposes of the exercise, the flood event of the year 2002 is considered (diamonds in Fig. 7); in detail, damages associ-ated with this event for a number of cities similar to Son-drio (medium-sized) were used. To be noted is that RaSDa includes accessories and installations within damage to in-frastructures.
Figure 7 shows that damage to infrastructures is more significant in RasDa than in the case study (circles), which means that damage to infrastructures can be of great impor-tance for events and territories similar to that of Sondrio. However, the authors of this paper are not aware of paramet-ric models able adequately to estimate damage to accessories and installations nor of RasDa data that allow inference of a specific model for the estimation of damage in the case in-vestigated.
1.E+02 1.E+03 1.E+04 1.E+05 1.E+06 1.E+07 1.E+08
1.E+02 1.E+04 1.E+06 1.E+08
da
m
a
g
e
t
o
i
nf
r
a
st
r
uc
tur
es
[
€
]
damage to buildings [€]
province of Sondrio case_study
Fig. 7.Comparison between damage to buildings and damage to infrastructures (pink circle) for the case study and (blue rhombus) for the event of November 2002 in the Province of Sondrio. The log scale has been assumed for both axes. The dotted line indicates the equality of values.
1.E+02 1.E+03 1.E+04 1.E+05 1.E+06 1.E+07
1.E+02 1.E+04 1.E+06 1.E+08
E
m
er
g
e
n
c
y
c
o
st
s [
€
]
Damage to buildings [€]
Fig. 8.Comparison among damage to buildings and emergency costs as derived from the RaSDa database and from the model de-veloped by Penning-Rowsell et al. (2005) for the event of November 2002 in the province of Sondrio (r2=0.5). Points represent field data, while the line represents the model. N.B. The log scale has been assumed for both axes.
and damage reduction to buildings (i.e. the differencea1–a3), which represents the main benefit, are of the same order in the case under investigation, at least whenQ >160 m3s−1. However, because of the above-mentioned modelling uncer-tainty, it is possible that emergency costs are higher than benefits, inducing the ineffectiveness of emergency manage-ment.
In regards to mitigation actions, a first problem concerns damage reduction due to people’s actions, which was mod-elled as a fixed shift in potential depth–damage curves. Al-though this is the simplest method, it should be noted that, when data are available, assessment methods based on the modelling of people’s behaviour are a more suitable choice (Parker et al., 2007; Molinari and Handmer, 2011). This is
in line with the need to model complexity as highlighted in Sect. 2.
Finally, discussion is required of neglected types of dam-age. The Australian damage assessment guidelines (EMA, 2002) report that “intangibles are often found to be more im-portant than tangible losses (. . .); studies in Australia, the United Kingdom and the United States have consistently shown that householders place very high value on intangible losses (. . .) at least as highly as their tangible dollar losses (. . .); previous disaster reports indicate that, as a broad esti-mate, indirect costs are usually in the range of 25–40 % of direct costs”. Hence, the inclusion of neglected components may severely affect the effectiveness of emergency manage-ment.
From an economic point of view, it is evident that poten-tial damages change when indirect damages are considered. For example, indirect damages due to bridge gates may be significant, given that economic activity in the area may suf-fer from traffic disruption (see Sect. 3.5). But also the indi-rect benefits may be significant: in fact, bridge gates make it possible to avoid the inundation of the city for 110< Q <
160 m3s−1, preventing not only direct damage but also in-direct damage to businesses (i.e. loss of income). On the other hand, it is clear that FEM effectiveness extends be-yond economic considerations. When intangibles are consid-ered, effectiveness increases because FEM enables the sav-ing of lives, memorabilia, cultural heritage, etc. (Carsell et al., 2004; Parker et al., 2007). However, the available tools for indirect and intangible damage estimation seem unsuit-able for practical and systematic purposes, and they require specific knowledge and usually unavailable data.
5 Conclusions
This paper is focused on flood emergency management (FEM) activities, which include and imply early warning sys-tems (EWSs), and it seeks to answer the following questions: how can expected loss and damage reduction (due to FEM) be estimated? To what extent are the results reliable? What is the value of the knowledge furnished by this kind of analysis in supporting FEM?
the preparedness sub-system) within the warning chain is one of the outputs of the proposed framework.
Once a comprehensive model is available, damage reduc-tion can be taken as the main variable driving FEM activ-ities, comprehending design of emergency plans, by defin-ing optimum response strategies. In line with this, the paper suggests an operational procedure to approach damage re-duction modelling, according to the objectives that the mea-sures are designed to achieve (i.e. reducing hazard vs. reduc-ing exposure/vulnerability). At the same time, costs required by implemented actions are carefully taken into account as the other critical information on the bases of which response strategies should be defined.
The implementation of models identified by the paper to the case study of Sondrio (Italy) shows that the esti-mate of expected damage reduction and emergency costs would actually support the definition of suitable response strategies. In particular, the analysis proves to supply use-ful information for evaluating EWS effectiveness by shifting from the traditional/hydrologic approach of forecast accu-racy (which is focused on the correspondence between ob-served and forecasted discharge values) to the more com-prehensive approach of forecast “value” (Murphy, 1993); ac-cordingly, EWS effectiveness is evaluated by the capacity of the forecasting system, embedded in a coherent FEM pro-cess, to produce benefits to end users.
Both the theoretical framework and the specific field ap-plication indicate that a cost–benefit analysis for such a com-plex issue like FEM is not at all an easy task; however any attempt to eliminate such complexity may result in an ab-surd or unacceptable result. Hence, (i) limiting the analysis to the estimation of certain categories of damage (i.e. direct) without considering those for which our modelling capac-ity is limited (i.e. tangible and indirect), or (ii) implementing models unable to describe the inherent complexity of the pro-cesses at stake reduce our understanding of the problem, and therefore limit the range of options that can be taken to miti-gate/reduce risk to the extent that wrong/unsuitable decisions may be taken.
On the other hand, the paper identifies the major weakness of proposed tools within the risk information sub-system, i.e. the models for damage assessment: uncertainties on such component make it difficult to clearly detect cost and benefits of the alternative options within a FEM process. For exam-ple, further research is required to understand the extent to which models can be exported to contexts others than those for which they have been developed. From this perspective, emergency costs are emblematic as present estimations could be affected by a high degree of uncertainty (as shown by the case study). A different example indicated by the case study is represented by infrastructures: damages to point installa-tions were recognised to have dominant weight within the total extent of damage to infrastructures, while such a com-ponent is typically omitted in current practice. Finally, fur-ther work is needed to clarify which method is best suited to
assessing indirect and intangible damages in different territo-rial contexts, given the variety of economic sectors that may be found in those contexts, the features of local services, the presence and importance of cultural heritage, and the struc-ture of the exposed community.
Acknowledgements. The structure and quality of this paper have
been highly improved by the patient work of anonymous reviewers, whose contribution is gratefully acknowledged; the authors wish also to thank Aurora Luzzi for editorial revision of the manuscript.
Edited by: R. Crockett
Reviewed by: five anonymous referees
References
Al-Kuwaiti, M., Kyriakopoulos, N., and Hussein, S.: Network de-pendability, fault-tolerance, reliability, security, survivability: a framework for comparative analysis, in: International Confer-ence on Computer Engineering and Systems (ICCES 06), Cairo, Egypt, 5–7 November, 2006.
Ballio, F., Menoni, S., Crotti, G., Borsani, D., De Marchi, B., Menucci, G., and Molinari, D.: Costruzione di un sistema di allarme a supporto del piano di emergenza in ambito montano, Province of Sondrio – Politecnico di Milano, Technical Report, Milan, Italy, 2010 (in Italian).
Basha, E. and Rus, D.: Design of early warning flood detection sys-tems for developing countries, in: Proceedings of the 2nd Inter-national Conference on Information and Communication Tech-nologies and Development, Bangalore, India, 15–16 December, 2007.
Carsell, K. M., Pingel, N. D., and Ford, D. T.: Quantifying the ben-efit of a flood warning system, Nat. Hazards Rev., 5, 131–140, doi:10.1061/(ASCE)1527-6988(2004)5:3(131), 2004.
Chatterton, J. B. and Farrell, S.: Nottingham flood warning scheme: Benefit assessment, Report prepared for Severn-Trent Water Au-thority, Middlesex, UK, 1977.
Cochrane, H.: Economic loss: myth and measurement, Disaster Prevention and Management, 13, 290–296, doi:10.1108/09653560410556500, 2004.
ConHaz: WP9 Report: Cost of Natural Hazards-A synthesis, avail-able at: http://conhaz.org, last access: 9 July 2013, 2012. Cools, J., Vanderkimpen, P., El Afandi, G., Abdelkhalek, A.,
Fockedey, S., El Sammany, M., Abdallah, G., El Bihery, M., Bauwens, W., and Huygens, M.: An early warning system for flash floods in hyper-arid Egypt, Nat. Hazards Earth Syst. Sci., 12, 443–457, doi:10.5194/nhess-12-443-2012, 2012.
Day, H. J.: Flood warning benefit evaluation-Susquehanna River Basin (urban residences), ESSA Technical Memorandum WBTM, Hydro-10, National Weather Service, Silver Spring, 1970.
De Lotto, P. and Testa, G.: Risk assessment: a simplified approach of flood damage evaluation with the use of GIS, in: Proceedings of International symposium INTRANET 2000, Villach (Austria), 2000.
PrinciplesofEmergencyManagement.pdf, last access: 9 July 2013, 2007.
EMA – Emergency Management Australia: Guide 5-Flood Warn-ing, Commonwealth of Australia, 1999.
EMA – Emergency Management Australia: Disaster loss assess-ment guidelines, State of Queensland and Commonwealth of Australia, 2002.
EU: Directive 2007/60/EU of the European Parliament and of the Council of 23 October 2007 on the assessment and management of flood risks, Official Journal of the European Union, 2007. FLOODsite: Evaluating flood damages: guidance and
recommen-dations on principles and methods, Report T09-06-01, available at: http://www.floodsite.net/, last access: 9 July 2013, 2007. FLOODsite: Modelling the damage reducing effects of flood
warn-ings, Report T10-07-12, available at: http://www.floodsite.net/, last access: 9 July 2013, 2008.
Franzetti, S.: Analisi delle procedure di emergenza a fronte di un evento idrogeologico per la citt`a di Sondrio, DIIAR – Politecnico di Milano, Technical report, Milan, Italy, 2005 (in Italian). Gruntfest, E. and Handmer, J. W. (Eds.): Coping with Flash Floods,
Vol. 77, NATO Advanced Study Institute, Kluwer Academic Publishers, Dordrecht, 2001.
Haggag, M. and Yamashita, T.: Framework for multi-weather haz-ard early warning system in Myanmar, Journal of International Development and Cooperation, 16, 101–113, 2010.
Handmer, J. W. and Ord, K. D.: Flood warning and response, in: Flood warning in Australia, edited by: Smith, D. I. and Handmer, J. W., Centre for Resource and Environmental Studies, Canberra, 235–257, 1986.
Handmer, J. W. and Smith, D. I.: Adjustment factors for flood dam-age curves, J. Water Res. Pl.-ASCE, 116, 843–846, 1990. ICPR (International Commission for the Protection of the Rhine):
Non structural flood plain management – Measures and their ef-fectiveness, ICPR, Koblenz, Germany, 2002
Jonkman, S. and Kelman, I.: An analyses of causes and circum-stances of flood disaster deaths, Disasters, 29, 75–97, 2005. Kirschenbaum, A.: Disaster preparedness: a conceptual and
empiri-cal reevaluation, International Journal of Mass Emergencies and Management, 20, 5–28, 2002.
Kok, M., Huizinga, H. J., Vrouwenvelder, A. C. W. M., and Baren-dregt, A.: Standard Method 2004: damage and casualties caused by flooding, Road and Hydraulic Engineering Institute, Nether-lands, 2005.
Kreibich, H., Thieken, A. H., Petrow, Th., M¨uller, M., and Merz, B.: Flood loss reduction of private households due to building precautionary measures – lessons learned from the Elbe flood in August 2002, Nat. Hazards Earth Syst. Sci., 5, 117–126, doi:10.5194/nhess-5-117-2005, 2005.
Krzhizhanovskaya, V. V., Shirshov, G. S., Melnikova, N. B., Belle-man, R. G., Rusadi, F. I., Broekhuijsen, B. J., Gouldby, B. P., Lhomme, J., Balis, B., Bubak, M., Pyayt, A. L., Mokhov, I. I., Ozhigin, A. V., Lang, B., and Meijer, R. J.: Flood early warn-ing system: design, implementation and computational modules, Procedia Computer Science, 4, 106–115, 2011.
Lehman, W. and Needham, J.: Consequence Estimation for Dam Failures Using HEC-FIA 2.2, available at: http://www.hec. usace.army.mil/software/hec-fia/documentation.aspx, last ac-cess: 9 July 2013, 2012.
Luino, F., Chiarle, M., Nigrelli, G., Agangi, A., Biddoccu, M., Cirio, C. G., and Giulietto, W.: A model for estimating flood damage in Italy: preliminary results, in: WIT Transactions on Ecology and the Environment 98, edited by: Aravossis, K., Brebbia, C. A., Karakas, E., and Kungolos, A. G., WIT Press, Southampton, 2006.
Margottini, C., Delmonaco, G., and Ferrara, F.: Impact and Losses of Natural and Na-Tech Disasters in Europe, in: Inside Risk. Strategies for sustainable risk mitigation, edited by: Menoni, S. and Margottini, C., Springer, 93–129, 2011.
Maskrey, M. A.: Report on National and Local Capabilities for Early Warning, IDNDR Secretariat, Geneva, avail-able at: http://www.unisdr.org/2006/ppew/whats-ew/pdf/ national-and-local-capabilities-ew-maskrey.pdf, last access: 9 July 2013, 1997.
Merz, B., Kreibich, H., Thieken, A., and Schmidtke, R.: Estimation uncertainty of direct monetary flood damage to buildings, Nat. Hazards Earth Syst. Sci., 4, 153–163, doi:10.5194/nhess-4-153-2004, 2004.
Messner, F. and Meyer, V.: Flood damage, vulnerability and risk perception: challenges for flood damage research, UFZ discus-sion papers, No. 13, 2005
Molinari, D.: Flood early warning systems performance: an ap-proach at the warning chain perspective, Politecnico di Milano, Ph.D. dissertation, Milan, Italy, 2011.
Molinari, D. and Handmer, J. W.: A behavioural model for quantify-ing flood warnquantify-ing effectiveness, Journal of Flood Risk Manage-ment, 4, 23–32, doi:10.1111/j.1753-318X.2010.01086.x, 2011. Molinari, D., Ballio, F., and Menoni, S.: Flood forecast verification
to support emergency management, in: Proceedings of the 34th IAHR World Congress, 26 June–1 July 2011, Brisbane, Aus-tralia, 2011.
Murphy, A. H.: What Is a Good Forecast? An Essay on the Nature of Goodness in Weather Forecasting, Weather Forecast., 8, 281– 293, 1993.
Olivieri, E. and Santoro, M.: Estimation of urban flood damages-the case study of Palermo, in: New trends in water and environmental engineering for safety and life, edited by: Maione, U., Lehto B. M., and Monti R., Balkema, Rotterdam, 2000.
Parker, D., Green, C., and Thompson, P. M.: Urban flood protec-tion benefits: a project appraisal guide (the red manual), Gower Technical Press, Aldershot, UK, 1987.
Parker, D., Tapsell, S.,and McCarthy, S.: Enhancing the human ben-efits of flood warnings, Nat. Hazards, 43, 397–414, 2007. Penning-Rowsell, E. C., Johnson, C., Tunstall, S., Tapsell, S.,
Mor-ris, J., Chatterton, J., Coker, A., and Green, C.: The benefits of flood and coastal risk management: a manual of assessment tech-niques, Middlesex University Press, London, 2005.
Perry, R. and Lindell, M.: Preparedness for emergency response: guidelines for the emergency planning process, Disasters, 27, 336–350, 2003.
Radice, A., Rosatti, G., Ballio, F., Franzetti, S., Mauri, M., Spag-nolatti, M., and Garegnani, G.: Management of flood hazard via hydro-morphological river modelling. The case of the Mallero in Italian Alps, Journal of Flood Risk Management, online first, doi:10.1111/j.1753-318X.2012.01170.x, 2012.
S., Springer, Heidelberg, 2004.
Seng, D. C.: Improving the Governance Context and Frame-work Conditions of Natural Hazard Early Warning Systems, Journal of Integrated Disaster Risk Management, 2, 1–25, doi:10.5595/idrim.2012.0020, 2012.
Smith, D. I.: Flood damage estimation – a review of urban stage damage curves and loss function, Water SA, 20(3), 231–238, 1994.
Smith, K. and Ward, R.: Floods: physical processes and human im-pacts, John Wiley & Sons, Ltd., Chichester, USA, 1998. Sorensen, J. and Mileti, D.: Warning and evacuation: answering
some basic questions, Industrial Crisis Quarterly, 2, 195–210, 1989.
SUFRI – Sustainable Strategies of Urban Flood Risk Manage-ment with non-structural measures to cope with the residual risk, CRUE Final Report, available at: http://www.crue-eranet. net/Calls/SUFRI frp.pdf, 2011.
Thieken, A. H., Muller, M., Kreibich, H., and Merz, B.: Flood damage and influencing factors: new insights from the au-gust 2002 flood in Germany, Water Resour. Res., 41, W12430, doi:10.1029/2005WR004177, 2005.
Thieken, A. H., Kreibich, H., Muller, M., and Merz, B.: Coping with floods: preparedness, response and recovery of flood-affected residents in Germany in 2002, Hydrological Science Journal, 52, 1016–1037, 2007.
Thieken, A. H., Ackermann, V., Elmer, F., Kreibich, H., Kuhlmann, B., Kunert, U., Maiwal, H., Merz, B., Muller, M., Piroth, K., Schwarz, J., Schwarze, R., Seifert, I., and Seifert, J.: Methods for the evaluation of direct and indirect flood losses, in: Proceed-ings of the 4th International symposium on flood defence, 6–8 May 2008, Toronto, Canada, 2008.
USACE: Generic depth-damage relationships for residential structures with basements, economic guidance memoran-dum (EGM) 04-01, available at: http://planning.usace.army.mil/ toolbox/library/EGMs/egm04-01.pdf, last access: 9 July 2013, 2003.