Submitted 25 August 2015 Accepted 1 October 2015 Published20 October 2015 Corresponding author
Jan H. Jensen, [email protected],
Academic editor
Freddie Salsbury Jr
Additional Information and Declarations can be found on page 15
DOI10.7717/peerj.1344 Copyright
2015 Larsen et al.
Distributed under
Creative Commons CC-BY 4.0 OPEN ACCESS
ProCS15: a DFT-based chemical shift
predictor for backbone and Cβ
atoms in
proteins
Anders S. Larsen1, Lars A. Bratholm2, Anders S. Christensen3, Maher Channir2and Jan H. Jensen2
1Department of Pharmacy, University of Copenhagen, Copenhagen, Denmark 2Department of Chemistry, University of Copenhagen, Copenhagen, Denmark 3Department of Chemistry, University of Wisconsin-Madison, Madison, WI, USA
ABSTRACT
We present ProCS15: a program that computes the isotropic chemical shielding values of backbone and Cβatoms given a protein structure in less than a second. ProCS15 is based on around 2.35 million OPBE/6-31G(d,p)//PM6 calculations on tripeptides and small structural models of hydrogen-bonding. The ProCS15-predicted chemical shielding values are compared to experimentally measured chemical shifts for Ubiquitin and the third IgG-binding domain of Protein G through linear regression and yield RMSD values of up to 2.2, 0.7, and 4.8 ppm for carbon, hydrogen, and nitrogen atoms. These RMSD values are very similar to corresponding RMSD values computed using OPBE/6-31G(d,p) for the entire structure for each proteins. These maximum RMSD values can be reduced by using NMR-derived structural ensembles of Ubiquitin. For example, for the largest ensemble the largest RMSD values are 1.7, 0.5, and 3.5 ppm for carbon, hydrogen, and nitrogen. The corresponding RMSD values predicted by several empirical chemical shift predictors range between 0.7–1.1, 0.2–0.4, and 1.8–2.8 ppm for carbon, hydrogen, and nitrogen atoms, respectively.
Subjects Biophysics, Computational Biology
Keywords Protein structure, NMR, Chemical shifts, Quantum chemistry
INTRODUCTION
calculations (mostly density functional theory, DFT) are becoming increasingly feasible for small proteins (He, Wang & Merz, 2009;Zhu, He & Zhang, 2012;Zhu, Zhang & He, 2013;Exner et al., 2012;Sumowski et al., 2014;Swails et al., 2015) and Vila, Scheraga and co-workers have gone on to develop a DFT-based chemical shift predictor for Cα and Cβ atoms called CheShift-2 (Martin et al., 2013). Generally, these QM-based methods yield chemical shifts that deviate significantly more from experiment than the empirical methods, with RMSD values that generally are at least twice as large. However, many of these studies have also shown that the empirical methods are less sensitive to the details of the protein geometry and that QM-based chemical shift predictors may be more suitable for protein refinement (Parker, Houk & Jensen, 2006;Sumowski et al., 2014;Vila et al., 2009;
Christensen et al., 2013).
Some of us recently showed (Christensen et al., 2013) that protein refinement using a DFT-based backbone amide proton chemical shift predictor (ProCS) yielded more accurate hydrogen-bond geometries and3hJNC′coupling constants involving backbone amide groups than corresponding refinement with CamShift. Furthermore, the ProCS predictions based on the structurally refined ensemble yielded amide proton chemical shift predictions that were at least as accurate as CamShift. This suggests that the larger RMSD observed for QM-based chemical shift predictions may, at least in part, be due to relatively small errors in the protein structures used for the predictions, and not a deficiency in the choice of DFT functional and basis set. However, in order to test whether this is true in general we need to include the effect of more than one type of chemical shift in the structural refinement. In this study we extend ProCS to the prediction of chemical shifts of backbone and Cβatoms in a new method we call ProCS15. We describe the underlying theory, which is significantly different from the previous, amide proton-only, version of ProCS (hence the new name) and test the accuracy relative to full DFT calculations as well as experiment for Ubiquitin and the third IgG-binding domain of Protein G (GB3). We also compare the accuracy to CheShift-2 and other commonly used empirical chemical shift predictors using both single structures and NMR-derived ensembles for Ubiquitin.
THEORY
ProCS15 computes the chemical shift of an atom in residueiby
δi=b−aσi (1)
whereaandbare empirically determined parameters as discussed further below andσiis the isotropic chemical shielding of an atom in residuei.σiis computed from the protein structure using the following equation (some of these terms only contribute for certain atom types as described below)
σi=σBBi +ΔσBBi−1+ΔσBBi+1+ΔσHBi +ΔσHαBi +ΔσRCi +Δσwi. (2)
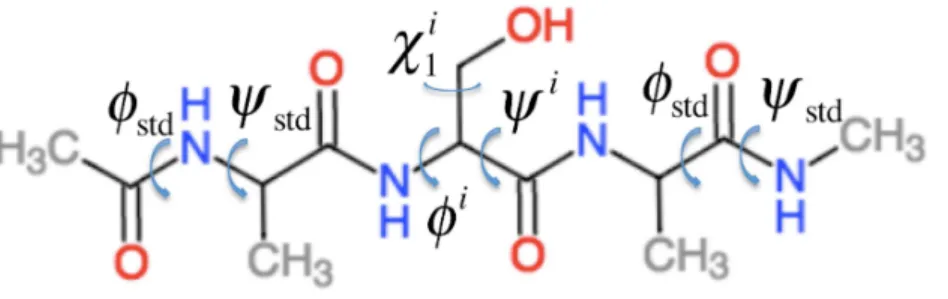
HereσBBi =σBBi (φi,ψi,χ1i,χ2i,...)is the chemical shielding computed for an Ac-AXA-NMe tripeptide (AXA for short,Fig. 1), where X is residuei, for a given combination ofφ,ψ, and
Figure 1 Example of the Ac–AXA–NMe tripeptides (for the case where X=Ser) used to compute the backbone contributions to the chemical shielding values.
change in chemical shielding of an atom in residueidue to the presence of the side-chain of residuei−1. It is computed as
ΔσBBi−1=σBBi−1(φi−1,ψi−1,χ1i−1,χ2i−1,...)−σA(φstd,ψstd). (3)
HereσBBi−1is the chemical shielding computed for an AXA tripeptide where X is residue i−1, andσAis from the corresponding calculation on the AAA tripeptide but using
φstd= −120◦andψstd=140◦for allφandψangles. For example, if residueiis a Ser and residuei−1 is a Val then the effect of the Val side-chain on the Cβchemical shielding of the Ser residue is computed as the difference in the chemical shielding of the Cβatom in the C-terminal Ala residue computed for an AVA and AAA tripeptide. This approach assumes that the effect of thei−1 side chain on the chemical shielding values of the atoms in residueiare independent of the conformationsφiandψiangles and the nature of residue
i.σBBi+1is the corresponding change in chemical shielding of an atom in residueidue to the presence of the side-chain of residuei+1.
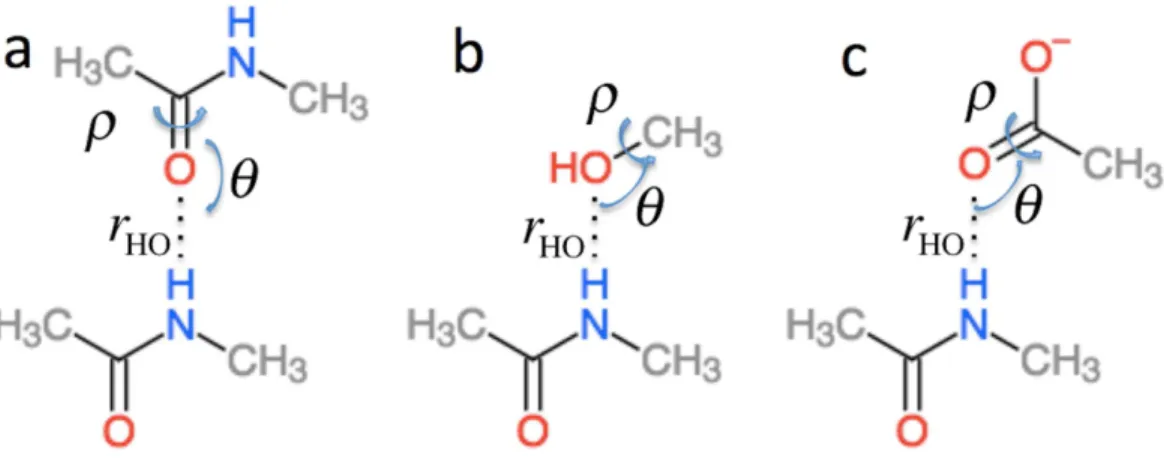
ΔσHBi inEq. (2)is the effect of hydrogen bonding to the amide H (Δσ1i◦HB) and O (Δσ2i◦HB) atoms of residueion the chemical shielding of the backbone atoms (this term is zero for Cβ)
ΔσHBi =Δσ1i◦HB(rHO,θ,ρ)+Δσ2i◦HB(rOH,θO,ρO). (4)
Figure 2 Schematic representation of the model systems used to computeΔσHBi .
Figure 3 Schematic representation of the model systems used to computeΔσHiαB.
ΔσHαBi is the effect of hydrogen bonding to the Hαand amide O atoms of residueion the chemical shielding of the backbone atoms and Cβand has two contributions
ΔσHαBi =Δσ1i◦HαB(rHαO,θ,ρ)+Δσ2i◦HαB(rOHα,θO,ρO). (5)
Δσ1i◦HαB is computed using the structural models shown inFig. 3as the change in chemical shielding of the backbone and Cβatoms in Ac-A-NMe relative to that of the free monomer computed at the OPBE/6-31G(d,p)//PM6 level of theory for a variety of orienta-tions (see the subsection “Hydrogen bond scans” for more information) while the internal monomer geometries are kept fixed.Δσ2i◦HBis computed as the change in the chemical shielding of the top amide group inFig. 3A. For Hαthe chemical shielding is taken as the average of the three hydrogen atom on the methyl group of the acetamide. Note in this case that the amide nitrogen and hydrogen formally belong to residuei+1 and thatrHO,θ, and
ρare defined relative to the carbonyl oxygen of residueirather than the amide proton as forΔσ1i◦HB.rHαO,θ, andρare therefore labeledrOHα,θO, andρOinEq. (5).
The ring current is calculated by a simple point-dipole model equation
ΔσRCi =iB1−3cos 2(θ )
r3 .
The model depends on the parametersi, which is the side-chain-specific ring-current intensity relative to benzene,B, which is a constant in the model, and the vectorr, which is the vector from the proton to the center of the aromatic ring.θ is the angle betweenrand the vector normal to the aromatic ring system. The cut-offfor calculating ring current is 8 ˚A in Procs15 and the value foriandBare taken fromChristensen, Sauer & Jensen (2011).
Δσwi is the change in chemical shielding of an amide proton due to a hydrogen bond to a water molecule. While the backbone terms of ProCS15 is parameterized based on DFT calculations with the polarizable continuum model of solvation, this model does not account for explicit solvent effects and this term is included for amide protons that do not form hydrogen bonds to other atoms in the protein structure.Δσwi is 2.07 ppm based on DFT calculations on an N-methylacetamide-water complex (Christensen et al., 2013).
METHODOLOGY
Backbone scans
The capped AXA tripeptides used to compute the first three terms ofEq. (2)were constructed using the FragBuilder Python module (Christensen, Hamelryck & Jensen, 2014), which was also used to make different conformations. The acidic and basic amino acids are all modeled in their charged state, including Histidine. This will be the correct charged state for most ionizable residues in most proteins. However, for any ionizable residues that are in their neutral state this approximation can introduce large errors. For example, the Cβchemical shifts of Asp and His change by 3.0 and 2.4 ppm due to protonation state changes in small peptides, while the N-chemical shifts change by 1.5 and 1.8 ppm (Platzer, Okon & McIntosh, 2014). This issue will be addressed in future studies. Only Cysteine is modeled and not the disulfide bonded Cysteine. For each tripeptide a scan on the central residue’s backbone and side chain dihedral anglesφ,ψ,χ1,χ2,χ3,χ4 was carried out. Theωdihedral angle was fixed at 180◦
. Theφ/ψbackbone angles on the N and C-termini alanine residues were fixed at−140◦
and 120◦
corresponding to typical
β-sheet residue backbone angles. The scans were done with a 20◦grid spacing. For the
alanine AAA tripeptide this resulted in 361 conformations from aφ/ψscan. For amino acid types with more than two side chain angles this approach would result in far to many samples. Instead we used BASILISK (Harder et al., 2010) that allows us to sample from the continuous space of the side chain torsion degrees of freedom. 1,000 conformations were generated for eachφ/ψbackbone pair spaced by 20◦. SeeTable S1in Supplementary
using 78 is that the bulk solvent effects will have the largest effect for charged side-chains, which are usually located on the surface of the protein. Both the optimization and NMR calculation were done with Gaussian 09 program (Frisch et al., 2014). In total the ProCS15 backbone terms are based on∼2.35 million DFT calculations.
Several structures failed in the optimization stage or had to be discarded due to steric clashes in the NMR calculation and the missing chemical shielding values were found by interpolation. For amino acids with no and one side chain angles cubic interpolation was used and for 2–4 side chain angles nearest neighbor interpolation. For amino acids with 0 side chain angles, the data is interpolated to a grid with 1◦grid spacing, 1 side chain
angles to a grid of 5◦and the rest of the amino acids 20◦. The interpolation is done with
the Python package SciPy (Jones, Oliphant & Peterson, 2001). The grids are saved in the .npy compressed file format from the Numpy Python package. In the compressed state on the hard disk the data size is∼17 GB and when loaded in to random access memory
(RAM)∼25 GB.
Hydrogen bond scans
ΔσHBandΔσHαB(cf.Eq. (2)) are parameterized using the model systems shown inFigs. 2
and3. ForΔσHBthe scans were done by scanning over the hydrogen bond lengthrOH, the
bond angleθHdefined by H..O=C or H..O–C and the dihedral angleρHdefined by H..O= C–N, H..O=C–C or H..O–C(..)HO. The bond length was scanned from 1.5 to 3.0 ˚A in
0.125 ˚A steps.θHwas scanned from 180.0 to 90.0◦in 10.0◦steps andρHwas done in the entire range−180◦to 180◦. Similarly, forΔσ
HαBtherOHαbond length was scanned from
1.8 to 4.0 ˚A in steps of 0.2 ˚A. The bond angleθHαdefined by Hα..O=C or Hα..O–C was
scanned from 180◦
to 90◦
with a 10◦
step size. TheρHαdihedral Hα..O=C–N, Hα..O=
C–C and Hα..O–C(..)HOwas scanned in steps of 15◦over the entire range. To get the
change in chemical shift caused by the hydrogen bonding the OPBE/6-31G(d,p)//PM6 chemical shielding of systems without hydrogen bonding are subtracted from the scans. The result of the scan is interpolated and saved in another set of .npy files. The monomer geometries are optimized at the PM6 level of theory and kept fixed during the scan.
NMR calculations and protein structures used
In this paper we benchmark the NMR chemical shift predictions on Ubiquitin and GB3. The structures are geometry optimized using PM6-D3H+(Kromann et al., 2014) using the PCM solvation model (Tomasi, Mennucci & Cammi, 2005;Steinmann et al., 2013) and the CHARMM22/CMAP force field (Mackerell, 2004) using the GB/SA solvation model (Qiu et al., 1997) with the 1UBQ (Vijay-Kumar, Bugg & Cook, 1987) and 2OED (Ulmer et al., 2003) structures as starting points. The PM6-D3H+optimizations are done using the
calculations we used charged protonation states for the acidic and basic side-chains, but in the NMR ensembles Histidine was left neutral (with either Nδ1 or Nε2 protonated) as published. The charges are consistent with the published pKavalues of Ubiquitin (Sundd et al., 2002;Lenkinski et al., 1977) and GB3 (Khare et al., 1997).
OBPE/6-31G(d,p)//PM6-D3H+GIAO NMR shielding calculations were performed
with Gaussian09 using the CPCM solvation model. ProCS15 calculations were done using a module written for the protein simulation framework PHAISTOS (Boomsma et al., 2013). The module was specifically written for this paper and can be downloaded atgithub. com/jensengroup/procs15. CheShift-2 calculations were performed using either the web interface at cheshift.com or the CheShift-2 PyMOL-plugin (Schr¨odinger, 2010) found atgithub.com/aloctavodia/cheshif. CamShift, PPM One, Sparta+, shAIC, and ShiftX2 calculations are performed using the stand-alone predictors. The NMR chemical shielding and shifts are compared to shifts measured for Ubiquitin (Cornilescu et al., 1998) (BMRB ID 17769)(Ulrich et al., 2007) and GB3 (V¨ogeli et al., 2012) (BMRB ID 18531), respectively, both at pH 6.5.
Much of the variation in some of the chemical shifts comes from the nature of the side-chain itself and the side chains before and after in the sequence, which can lead to inflatedr-values. To separate the contributions of the sequence and the structure we subtract the measured sequence corrected random coil values (Tamiola, Acar & Mulder, 2010) from all predicted and experimental values. Note that this does not affect the computed RMSD values.
RESULTS AND DISCUSSION
Choice of functional and basis set
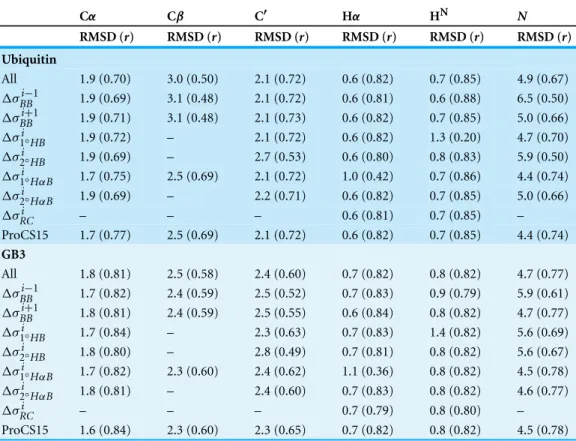
Table 1 Comparison of ProCS15 to OPBE/6-31G(d,p)//PM6-D3H+values computed for the entire protein.All chemical shielding values are corrected for random coil effects. The RMSD values are computed after linear regression. “All” means that all terms inEq. (2)are included, with the exception of Δσw. “ΔσBBi−1” means that theΔσBBi−1term has been removed in the chemical shift prediction, while all
other terms are included. The row marked “ProCS15” corresponds to the combination of terms outlined inTable 2.
Cα Cβ C′ Hα HN N
RMSD (r) RMSD (r) RMSD (r) RMSD (r) RMSD (r) RMSD (r)
Ubiquitin
All 1.9 (0.70) 3.0 (0.50) 2.1 (0.72) 0.6 (0.82) 0.7 (0.85) 4.9 (0.67) ΔσBBi−1 1.9 (0.69) 3.1 (0.48) 2.1 (0.72) 0.6 (0.81) 0.6 (0.88) 6.5 (0.50) ΔσBBi+1 1.9 (0.71) 3.1 (0.48) 2.1 (0.73) 0.6 (0.82) 0.7 (0.85) 5.0 (0.66) Δσ1i◦HB 1.9 (0.72) – 2.1 (0.72) 0.6 (0.82) 1.3 (0.20) 4.7 (0.70)
Δσ2i◦HB 1.9 (0.69) – 2.7 (0.53) 0.6 (0.80) 0.8 (0.83) 5.9 (0.50)
Δσ1i◦HαB 1.7 (0.75) 2.5 (0.69) 2.1 (0.72) 1.0 (0.42) 0.7 (0.86) 4.4 (0.74)
Δσ2i◦HαB 1.9 (0.69) – 2.2 (0.71) 0.6 (0.82) 0.7 (0.85) 5.0 (0.66)
ΔσRCi – – – 0.6 (0.81) 0.7 (0.85) –
ProCS15 1.7 (0.77) 2.5 (0.69) 2.1 (0.72) 0.6 (0.82) 0.7 (0.85) 4.4 (0.74)
GB3
All 1.8 (0.81) 2.5 (0.58) 2.4 (0.60) 0.7 (0.82) 0.8 (0.82) 4.7 (0.77) ΔσBBi−1 1.7 (0.82) 2.4 (0.59) 2.5 (0.52) 0.7 (0.83) 0.9 (0.79) 5.9 (0.61) ΔσBBi+1 1.8 (0.81) 2.4 (0.59) 2.5 (0.55) 0.6 (0.84) 0.8 (0.82) 4.7 (0.77) Δσ1i◦HB 1.7 (0.84) – 2.3 (0.63) 0.7 (0.83) 1.4 (0.82) 5.6 (0.69)
Δσ2i◦HB 1.8 (0.80) – 2.8 (0.49) 0.7 (0.81) 0.8 (0.82) 5.6 (0.67)
Δσ1i◦HαB 1.7 (0.82) 2.3 (0.60) 2.4 (0.62) 1.1 (0.36) 0.8 (0.82) 4.5 (0.78)
Δσ2i◦HαB 1.8 (0.81) – 2.4 (0.60) 0.7 (0.83) 0.8 (0.82) 4.6 (0.77)
ΔσRCi – – – 0.7 (0.79) 0.8 (0.80) –
ProCS15 1.6 (0.84) 2.3 (0.60) 2.3 (0.65) 0.7 (0.82) 0.8 (0.82) 4.5 (0.78)
Benchmarking ProCS15 against full QM calculations
Equation (2)is parameterized using OPBE/6-31G(d,p)//PM6 calculations so we compare ProCS15 against full OPBE/6-31G(d,p)//PM6-D3H+calculations on Ubiquitin (1UBQ) and GB3 (2OED) to test for errors introduced by the inherent additivity assumptions and the structural simplifications in the model systems used for the DFT calculations. We use PM6-D3H+for the geometry optimization, rather than PM6, to get a better description of hydrogen-bonding and other intermolecular interactions. However, bond lengths and angles, and their effect on chemical shifts, will be very virtually identical to PM6. The results are summarized inTable 1. The first row, marked “all”, summarizes results for ProCS15 if all but the last term ofEq. (2)are included. The last term corrects for the explicit solvent effects and thus not relevant when comparing to DFT calculations.
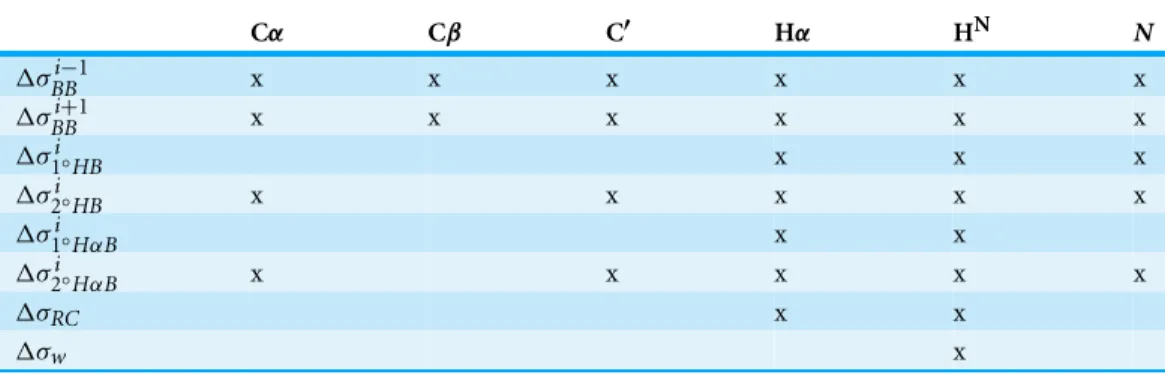
Table 2 Terms inEq. (2)that are included in ProCS15 for a given atom type are marked with an “x”.
Cα Cβ C′ Hα HN N
ΔσBBi−1 x x x x x x
ΔσBBi+1 x x x x x x
Δσ1i◦HB x x x
Δσ2i◦HB x x x x x
Δσ1i◦HαB x x
Δσ2i◦HαB x x x x x
ΔσRC x x
Δσw x
atoms). For CβremovingΔσ1i◦HαBdecreases the RMSD by 0.2–0.5 ppm, whileΔσi
−1
BB and ΔσBBi+1increases and decreases the RMSD value depending on the protein. Accordingly onlyΔσ1i◦HαBis removed. Note that the structural models used forΔσ1i◦HB,Δσ2i◦HBand
Δσ2i◦HαBdo not contain a Cβatom so there is no such contribution for this nucleus. For C′
removingΔσ1i◦HBdecreases the RMSD for GB3 by 0.1 ppm so we choose to remove this term for this atom type. Note that removingΔσ2i◦HBincreases the RMSD by 0.4–0.6 ppm so this term is important for accurate predictions of C′
chemical shifts. For HNand Hαwe choose to retain all the terms. Not surprisingly, the respective primary hydrogen bonding terms lower the RMSD by 0.4–0.6 ppm and are crucial for accurate predictions. Finally, for N removingΔσ1i◦HαBlowers the RMSD by 0.2–0.5 ppm, so this term is removed. Note that
ΔσBBi−1and the two hydrogen bonding terms involving H lower the RMSD by as much as 1.6 ppm (ΔσBBi−1for Ubiquitin) and is crucial for accurate predictions.
An overview of the terms ofEq. (2)used in ProCS15 for each atom type can be found
Table 2and the RMSD andrvalues obtained using this combination of terms are given in the row labeled “ProCS15” inTable 1. The RMSD value for the carbon atoms range from 1.6 to 2.5 ppm and a very similar for both proteins. Thervalues range between 0.60 and 0.84 with thervalue being consistently highest for Cα. For the hydrogen atoms the RMSD andrvalues range from 0.6 to 0.8 ppm and 0.82 to 0.85, respectively. Finally, for N the RMSD values are 4.3–4.5 ppm, while thervalues are in the range 0.74–0.78.
In the case of GB3 the RMSD (r) value for Cβ can be reduced (increased) to 1.8 ppm (0.71) by removing a single outlier identified by the Generalized Extreme Studentized Deviate Test (Rosner, 1983). The outlier is Ala20 for which ProCS15 and DFT predict a Cβ
chemical shielding value of 176.8 and 167.4 ppm, respectively. Inspection of the structure shows that the Cβatom is only 3.1 ˚A from the N atom of Ala26—an interaction not taken into account in the parameterization of ProCS15.
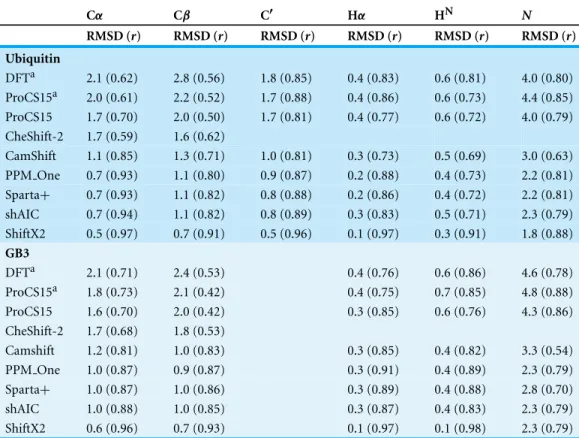
Table 3 Comparison of chemical shifts predicted using various methods to experimental values measured for Ubiquitin and GB3 and corrected for random coil effects. The RMSD values are computed after linear regression. The predictions were done using CHARMM22/CMAP optimized structures using the GB/SA solvation model except for the first two rows (marked with a) where PM6-D3H+optimized structures using the CPCM solvation model were used.
Cα Cβ C′ Hα HN N
RMSD (r) RMSD (r) RMSD (r) RMSD (r) RMSD (r) RMSD (r)
Ubiquitin
DFTa 2.1 (0.62) 2.8 (0.56) 1.8 (0.85) 0.4 (0.83) 0.6 (0.81) 4.0 (0.80) ProCS15a 2.0 (0.61) 2.2 (0.52) 1.7 (0.88) 0.4 (0.86) 0.6 (0.73) 4.4 (0.85) ProCS15 1.7 (0.70) 2.0 (0.50) 1.7 (0.81) 0.4 (0.77) 0.6 (0.72) 4.0 (0.79) CheShift-2 1.7 (0.59) 1.6 (0.62)
CamShift 1.1 (0.85) 1.3 (0.71) 1.0 (0.81) 0.3 (0.73) 0.5 (0.69) 3.0 (0.63) PPM One 0.7 (0.93) 1.1 (0.80) 0.9 (0.87) 0.2 (0.88) 0.4 (0.73) 2.2 (0.81) Sparta+ 0.7 (0.93) 1.1 (0.82) 0.8 (0.88) 0.2 (0.86) 0.4 (0.72) 2.2 (0.81) shAIC 0.7 (0.94) 1.1 (0.82) 0.8 (0.89) 0.3 (0.83) 0.5 (0.71) 2.3 (0.79) ShiftX2 0.5 (0.97) 0.7 (0.91) 0.5 (0.96) 0.1 (0.97) 0.3 (0.91) 1.8 (0.88)
GB3
DFTa 2.1 (0.71) 2.4 (0.53) 0.4 (0.76) 0.6 (0.86) 4.6 (0.78) ProCS15a 1.8 (0.73) 2.1 (0.42) 0.4 (0.75) 0.7 (0.85) 4.8 (0.88) ProCS15 1.6 (0.70) 2.0 (0.42) 0.3 (0.85) 0.6 (0.76) 4.3 (0.86) CheShift-2 1.7 (0.68) 1.8 (0.53)
Camshift 1.2 (0.81) 1.0 (0.83) 0.3 (0.85) 0.4 (0.82) 3.3 (0.54) PPM One 1.0 (0.87) 0.9 (0.87) 0.3 (0.91) 0.4 (0.89) 2.3 (0.79) Sparta+ 1.0 (0.87) 1.0 (0.86) 0.3 (0.89) 0.4 (0.88) 2.8 (0.70) shAIC 1.0 (0.88) 1.0 (0.85) 0.3 (0.87) 0.4 (0.83) 2.3 (0.79) ShiftX2 0.6 (0.96) 0.7 (0.93) 0.1 (0.97) 0.1 (0.98) 2.3 (0.79)
2.54 ˚A of an Hεatom of the Met1 side chain. While these interactions should be included in theσBBi andΔσBBi−1term, respectively, it is possible that the latter interaction is not found in the scan due to the choice ofφstdandψstddescribed above. This residue is also identified as an outlier for N and removing it reduces (increases) the RMSD (r) value to 4.1 ppm (0.81).
Comparison to experimental chemical shifts using single structures
Table 3shows the comparison of QM, ProCS15 and several common chemical shift predictors to experimental values. The first two rows use the OPBE/6-31G(d,p) and ProCS15 chemical shielding predictions used to constructTable 1 and therefore use the PM6-D3H+optimized structures of Ubiquitin and GB3. However, most future use
of ProCS15 will be based on structures optimized with force fields so prediction of the remaining rows is done using structures optimized with the CHARMM22/CMAP force field. The ProCS15 predictions based on the CHARMM22/CMAP-optimized structures include theΔσw term (cf.Eq. (2)). Theaandbfactors inEq. (1)are found
The OPBE/6-31G(d,p)//PM6-D3H+calculations reproduce the experimental chemical shifts to within 2.8 ppm for carbon atoms, 0.6 ppm for hydrogen atoms and 4.6 ppm for nitrogen. The results are similar to those observed by other researchers using other functionals. For example, Zhu and co-workers (2012) used B3LYP3/6-31G(d,p)//AMBER (and a locally dense 6-31++G(d,p)/4-31G(d) basis set for C′) and an implicit solvent
model to reproduce chemical shift values to within 3.3 ppm for carbon atoms, 0.4 for hydrogen atoms and 8.4 ppm for nitrogen. In this study the RMSD for hydrogen atoms was computed for Hαand HNcombined. In a later study (Zhu, Zhang & He, 2013), the same researchers reproduced the chemical shifts of amide protons in GB3 to within 0.5 ppm using a locally dense 6-31++G(d,p)/4-31G(d) basis set and a variety of functionals
including OPBE. Similarly, Exner and co-workers (2012) used B3LYP/6-31G(d)//AMBER and an implicit solvent model to reproduce the HNchemical shifts of the HA2 Domain to within 0.5 ppm using a single structure and 0.3 pm using several MD snapshots.
While ProCS15 does not reproduce the DFT results perfectly as discussed above the first two rows ofTable 3show that ProCS15 can reproduce experimental chemical shifts with an overall accuracy that is similar to full DFT chemical shielding calculations for Ubiquitin and GB3. The RMSD values predicted with ProCS15 for carbon atoms are 0.1–0.6 ppm lower compared to the DFT results, while the RMSD values for hydrogen and nitrogen atoms are 0.0–0.1 ppm and 0.2–0.4 ppm higher. It is therefore not clear that much is necessarily gained by adding additional terms to ProCS15 without also increasing the underlying level of theory used to compute these terms. For example, it is known that using a larger basis set can significantly improve the prediction of C′chemical shifts (
Vila et al., 2014;Zhu, He & Zhang, 2012).
Using structures optimized with CHARMM22/CMAP instead of PM6-D3H+to predict chemical shifts with ProCS15 does also not seem to lead to overall worse agreement with experiment. In fact the results tend to improve slightly (up to 0.5 ppm) for heavy atoms as judged by the RMSD values. Comparison of ProCS15 to CheShift-2, which has also been parameterized against DFT calculations, show fairly similar accuracy for Cαand slightly worse accuracy for Cβ. The latter observation is perhaps due to the fact that CheShift-2 uses a different (empirical-corrected) reference for each residue type. However, this is also the case for Cαfor which ProCS15 predictions give a lower RMSD value.
Comparison of ProCS15 to the empirical methods (CamShift through ShiftX2) generally show considerably lower RMSD of the empirical predictions for all atoms types, except Hαfor GB3 where the accuracy is mostly comparable. Thervalues are also considerably higher for the empirical methods than for ProCS15 for Cαand, especially, Cβ, while they are comparable for the remaining atoms.
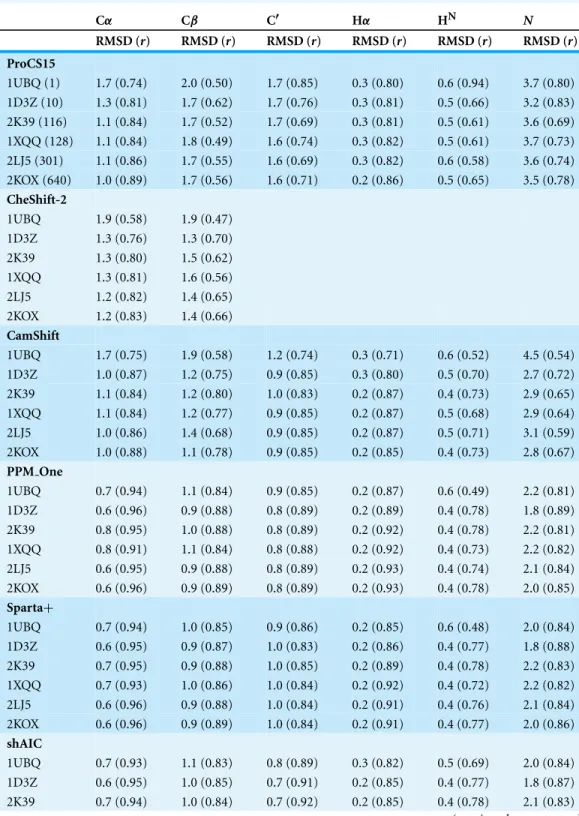
Comparison to experimental chemical shifts using NMR-derived ensembles
Table 4lists the RMSD andrvalues computed for Ubiquitin using the X-ray structure 1UBQ and five NMR-derived structural ensembles with between 10 and 640 structures. For ProCS15 the average chemical shift is obtained by computing the average chemical shielding for each nucleus followed by the linear regression fit to experimental chemical shift values (cf.Eq. (1)) to obtain the predicted average chemical shifts. The procedure is the same for the remaining methods except that chemical shifts are used instead of chemical shieldings.
For ProCS15 use of ensemble structures lowers the RMSD values for all atom types, with decreases in the range 0.1–0.7 ppm for heavy atoms and 0.1 ppm hydrogen atoms. Similar improvements are observed for Cαand Cβfor CheShift-2, except that the improvement in RMSD for Cβ(0.5 ppm) is larger compared to ProCS15 (0.3 ppm). These improvements are expected if the NMR-derived ensembles are a more accurate representation of the protein structure in solution than the single X-ray structure (Arnautova et al., 2009;Vila et al., 2010). Indeed, all but one of the ensembles used here were generated specifically to be a more realistic presentation of protein ensemble in solutions. The exception is 1D3Z, which is a traditional NMR structural model where the conformational diversity is mainly an expression of lack of structural constraints.
Improvements are also observed for CamShift, with RMSD-decreases of 0.3–1.7 and 0.2 ppm for heavy and hydrogen atoms, respectively. In the case of PPM One, Sparta+,
and shAIC modest (up to 0.3 ppm) RMSD-decreases are observed for some ensembles but not others and, on average, the RMSD is roughly equally likely to remain unchanged or increase slightly. Finally, for ShiftX2 the RMSD consistently increases (by up to 0.7 ppm) on going from the X-ray structure to the ensembles, with the exception of Cαwhere the RMSD is lowered by 0.1 ppm. We note that the RMSD values predicted with CamShift using the crystal structure are significantly larger than when using the CHARMM/CMAP structure (presumably due to hydrogen being optimized placed in accordance to the CHARMM22 topology file in the CamShift training set) and that the reduction in RMSD on going to ensembles is at most 0.3 ppm relatively to these values. So, it appears that the use of ensemble structures does not lead to a significant increase in accuracy compared to using a single structure foranyof the empirical methods, in contrast to ProCS15 and CheShift-2.
The observations are consistent with earlier observations (Parker, Houk & Jensen, 2006;
Sumowski et al., 2014;Vila, Baldoni & Scheraga, 2009;Christensen et al., 2013) that the empirical NMR prediction methods tend to be significantly less sensitive to changes in protein structure compared to DFT-based chemical shift predictors or chemical shifts computed using QM methods.
SUMMARY AND OUTLOOK
Table 4 Comparison of chemical shifts predicted using various methods to experimental values measured for ubiquitin corrected for random coil effects.The RMSD values are computed after linear regression. The predictions are done using a single X-ray structure (1UBQ) and five NMR-derived ensembles of varying size (indicated in parentheses for 1UBQ) without further refinement of the structure.
Cα Cβ C′ Hα HN N
RMSD (r) RMSD (r) RMSD (r) RMSD (r) RMSD (r) RMSD (r)
ProCS15
1UBQ (1) 1.7 (0.74) 2.0 (0.50) 1.7 (0.85) 0.3 (0.80) 0.6 (0.94) 3.7 (0.80) 1D3Z (10) 1.3 (0.81) 1.7 (0.62) 1.7 (0.76) 0.3 (0.81) 0.5 (0.66) 3.2 (0.83) 2K39 (116) 1.1 (0.84) 1.7 (0.52) 1.7 (0.69) 0.3 (0.81) 0.5 (0.61) 3.6 (0.69) 1XQQ (128) 1.1 (0.84) 1.8 (0.49) 1.6 (0.74) 0.3 (0.82) 0.5 (0.61) 3.7 (0.73) 2LJ5 (301) 1.1 (0.86) 1.7 (0.55) 1.6 (0.69) 0.3 (0.82) 0.6 (0.58) 3.6 (0.74) 2KOX (640) 1.0 (0.89) 1.7 (0.56) 1.6 (0.71) 0.2 (0.86) 0.5 (0.65) 3.5 (0.78)
CheShift-2
1UBQ 1.9 (0.58) 1.9 (0.47) 1D3Z 1.3 (0.76) 1.3 (0.70) 2K39 1.3 (0.80) 1.5 (0.62) 1XQQ 1.3 (0.81) 1.6 (0.56) 2LJ5 1.2 (0.82) 1.4 (0.65) 2KOX 1.2 (0.83) 1.4 (0.66)
CamShift
1UBQ 1.7 (0.75) 1.9 (0.58) 1.2 (0.74) 0.3 (0.71) 0.6 (0.52) 4.5 (0.54) 1D3Z 1.0 (0.87) 1.2 (0.75) 0.9 (0.85) 0.3 (0.80) 0.5 (0.70) 2.7 (0.72) 2K39 1.1 (0.84) 1.2 (0.80) 1.0 (0.83) 0.2 (0.87) 0.4 (0.73) 2.9 (0.65) 1XQQ 1.1 (0.84) 1.2 (0.77) 0.9 (0.85) 0.2 (0.87) 0.5 (0.68) 2.9 (0.64) 2LJ5 1.0 (0.86) 1.4 (0.68) 0.9 (0.85) 0.2 (0.87) 0.5 (0.71) 3.1 (0.59) 2KOX 1.0 (0.88) 1.1 (0.78) 0.9 (0.85) 0.2 (0.85) 0.4 (0.73) 2.8 (0.67)
PPM One
1UBQ 0.7 (0.94) 1.1 (0.84) 0.9 (0.85) 0.2 (0.87) 0.6 (0.49) 2.2 (0.81) 1D3Z 0.6 (0.96) 0.9 (0.88) 0.8 (0.89) 0.2 (0.89) 0.4 (0.78) 1.8 (0.89) 2K39 0.8 (0.95) 1.0 (0.88) 0.8 (0.89) 0.2 (0.92) 0.4 (0.78) 2.2 (0.81) 1XQQ 0.8 (0.91) 1.1 (0.84) 0.8 (0.88) 0.2 (0.92) 0.4 (0.73) 2.2 (0.82) 2LJ5 0.6 (0.95) 0.9 (0.88) 0.8 (0.89) 0.2 (0.93) 0.4 (0.74) 2.1 (0.84) 2KOX 0.6 (0.96) 0.9 (0.89) 0.8 (0.89) 0.2 (0.93) 0.4 (0.78) 2.0 (0.85)
Sparta+
1UBQ 0.7 (0.94) 1.0 (0.85) 0.9 (0.86) 0.2 (0.85) 0.6 (0.48) 2.0 (0.84) 1D3Z 0.6 (0.95) 0.9 (0.87) 1.0 (0.83) 0.2 (0.86) 0.4 (0.77) 1.8 (0.88) 2K39 0.7 (0.95) 0.9 (0.88) 1.0 (0.85) 0.2 (0.89) 0.4 (0.78) 2.2 (0.83) 1XQQ 0.7 (0.93) 1.0 (0.86) 1.0 (0.84) 0.2 (0.92) 0.4 (0.72) 2.2 (0.82) 2LJ5 0.6 (0.96) 0.9 (0.88) 1.0 (0.84) 0.2 (0.91) 0.4 (0.76) 2.1 (0.84) 2KOX 0.6 (0.96) 0.9 (0.89) 1.0 (0.84) 0.2 (0.91) 0.4 (0.77) 2.0 (0.86)
shAIC
Table 4 (continued)
Cα Cβ C′ Hα HN N
RMSD (r) RMSD (r) RMSD (r) RMSD (r) RMSD (r) RMSD (r)
1XQQ 0.7 (0.94) 1.1 (0.80) 0.7 (0.91) 0.2 (0.85) 0.4 (0.72) 2.2 (0.82) 2LJ5 0.6 (0.95) 1.0 (0.86) 0.7 (0.91) 0.2 (0.86) 0.4 (0.75) 2.1 (0.84) 2KOX 0.7 (0.94) 1.0 (0.85) 0.7 (0.91) 0.2 (0.85) 0.4 (0.74) 2.0 (0.86)
ShiftX2
1UBQ 0.5 (0.97) 0.4 (0.97) 0.4 (0.97) 0.1 (0.99) 0.1 (0.98) 1.3 (0.94) 1D3Z 0.4 (0.98) 0.7 (0.94) 0.6 (0.95) 0.1 (0.96) 0.2 (0.93) 1.6 (0.91) 2K39 0.4 (0.98) 0.7 (0.93) 0.7 (0.93) 0.1 (0.98) 0.2 (0.92) 2.1 (0.85) 1XQQ 0.5 (0.97) 0.8 (0.91) 0.7 (0.93) 0.1 (0.99) 0.3 (0.90) 2.0 (0.86) 2LJ5 0.4 (0.98) 0.6 (0.95) 0.7 (0.94) 0.1 (0.98) 0.3 (0.92) 1.9 (0.87) 2KOX 0.4 (0.98) 0.6 (0.95) 0.7 (0.93) 0.1 (0.98) 0.2 (0.92) 1.8 (0.88)
ProCS accounts for the effect of backbone and side-chain dihedral angles of a residue and the two neighboring residues, hydrogen bonding to the backbone amide group and Hαas well as ring-current effects (Christensen, Sauer & Jensen, 2011) on the hydrogen atoms and assumes that these effects are additive. The backbone, side-chain and hydrogen bonding terms are based on∼2.35 million OPBE/6-31G(d,p)//PM6 calculations on tripeptides and
small structural models of hydrogen-bonding.
ProCS15 reproduces the chemical shielding values computed using PCM/OPBE/6-31G(d,p)//PM6-D3H+for Ubiquitin and GB3 with RMSD values (after linear regression) of up to 2.5 ppm for carbon atoms, 0.8 ppm for hydrogen atoms, and 4.5 ppm for nitrogen. These deviations, which presumably result from the assumption of additivity and the simplified model systems, does not appear to preclude equal or better accuracy in comparison to experiment because the accuracies of the chemical shifts computed using ProCS15 (based on linear regression of the chemical shifts, cf.Eq. (1)) are very similar to the corresponding DFT calculations using single Ubiquitin and GB3 structures. The largest RMSD values observed for carbon, hydrogen, and nitrogen are, respectively, 2.2 (2.8) ppm, 0.7 (0.6) ppm, and 4.7 (4.6) ppm for ProCS15 (PCM/OPBE/6-31G(d,p)). These accuracies are very similar to DFT-based predictions made by other researchers (e.g.,Zhu, He & Zhang, 2012;Zhu, Zhang & He, 2013;Exner et al., 2012) as well as CheShift-2 (Martin et al., 2013), which is another DFT-based chemical shift predictor for Cαand Cβatoms. The RMSD values computed using ProCS15 for Ubiquitin can be reduced by as much as 0.7, 0.1, and 0.5 ppm for carbon, hydrogen, and nitrogen by using NMR-derived structural ensembles. Similar increase in accuracy is also observed for CheShift-2 (for Cαand Cβ) while for empirical chemical shift predictors the increase in accuracy is at most 0.3 ppm.
amide proton chemical shift predictions and we are now planning similar refinement studies using all backbone atoms and Cβchemical shifts.
ProCS15 is freely available atgithub.com/jensengroup/procs15and all structures and DFT calculations, including the full NMR shielding tensors, are available aterda.dk/public/ archives/YXJjaGl2ZS1TYk40VXo=/published-archive.html.
ACKNOWLEDGEMENT
We thank Osvaldo Martin, Jorge Vila, and Xiao He for helpful comments.
ADDITIONAL INFORMATION AND DECLARATIONS
Funding
This work was supported by the Lundbeck Foundation and the Danish e-Infrastructure Cooporation. The funders had no role in study design, data collection and analysis, decision to publish, or preparation of the manuscript.
Grant Disclosures
The following grant information was disclosed by the authors: Lundbeck Foundation and the Danish e-Infrastructure Cooporation.
Competing Interests
The authors declare there are no competing interests.
Author Contributions
• Anders S. Larsen performed the experiments, analyzed the data, contributed
reagents/materials/analysis tools, reviewed drafts of the paper.
• Lars A. Bratholm analyzed the data, contributed reagents/materials/analysis tools,
reviewed drafts of the paper.
• Anders S. Christensen conceived and designed the experiments, reviewed drafts of the paper.
• Maher Channir performed the experiments, reviewed drafts of the paper.
• Jan H. Jensen conceived and designed the experiments, analyzed the data, wrote the
paper, prepared figures and/or tables, reviewed drafts of the paper.
Data Availability
The following information was supplied regarding data availability: ProCS15 is freely available atgithub.com/jensengroup/procs15.
All structures and DFT calculations, including the full NMR shielding tensors, are available aterda.dk/public/archives/YXJjaGl2ZS1TYk40VXo=/published-archive.html.
Supplemental Information
REFERENCES
Arnautova YA, Vila JA, Martin OA, Scheraga HA. 2009.What can we learn by computing 13Cα chemical shifts for X-ray protein models?Acta Crystallographica Section D Biological
Crystallography65(7):697–703DOI 10.1107/S0907444909012086.
Barone V, Cossi M. 1998.Quantum calculation of molecular energies and energy gradients in solution by a conductor solvent model.The Journal of Physical Chemistry A102(11):1995–2001 DOI 10.1021/jp9716997.
Becke AD. 1993.Density-functional thermochemistry. III. The role of exact exchange.The Journal of Chemical Physics98(7):5648–5652DOI 10.1063/1.464913.
Boomsma W, Frellsen J, Harder T, Bottaro S, Johansson KE, Tian P, Stovgaard K, Andreetta C, Olsson S, Valentin JB, Antonov LD, Christensen AS, Borg M, Jensen JH, Lindorff-Larsen K, Ferkinghoff-Borg J, Hamelryck T. 2013.PHAISTOS: a framework for Markov chain Monte Carlo simulation and inference of protein structure.Journal of Computational Chemistry 34(19):1697–1705DOI 10.1002/jcc.23292.
Bratholm LA, Christensen AS, Hamelryck T, Jensen JH. 2015.Bayesian inference of protein structure from chemical shift data.PeerJ3:e861DOI 10.7717/peerj.861.
Christensen A, Hamelryck T, Jensen J. 2014.FragBuilder: an efficient Python library to setup quantum chemistry calculations on peptides models.PeerJ2:e277DOI 10.7717/peerj.277. Christensen A, Linnet T, Borg M, Boomsma W, Lindorff-Larsen K, Hamelryck T, Jensen J. 2013.
Protein structure validation and refinement using amide proton chemical shifts derived from quantum mechanics.PLoS ONE8:e84123DOI 10.1371/journal.pone.0084123.
Christensen AS, Sauer SPA, Jensen JH. 2011.Definitive Benchmark study of ring current effects on amide proton chemical shifts.Journal of Chemical Theory and Computation7(7):2078–2084 DOI 10.1021/ct2002607.
Cornilescu G, Marquardt JL, Ottiger M, Bax A. 1998.Validation of protein structure from anisotropic carbonyl chemical shifts in a dilute liquid crystalline phase.Journal of the American
Chemical Society120(27):6836–6837DOI 10.1021/ja9812610.
Exner TE, Frank A, Onila I, M¨oller HM. 2012.Toward the quantum chemical calculation of NMR chemical shifts of proteins. 3. Conformational sampling and explicit solvents model.Journal of
Chemical Theory and Computation8(11):4818–4827DOI 10.1021/ct300701m.
Fenwick RB, Esteban-Martin S, Richter B, Lee D, Walter KFA, Milovanovic D, Becker S, Lakomek NA, Griesinger C, Salvatella X. 2011.Weak long-range correlated motions in a surface patch of ubiquitin involved in molecular recognition.Journal of the American Chemical
Society133(27):10336–10339DOI 10.1021/ja200461n.
Han B, Liu Y, Ginzinger S, Wishart D. 2011.SHIFTX2: significantly improved protein chemical shift prediction.Journal of Biomolecular NMR50:43–57DOI 10.1007/s10858-011-9478-4. Harder T, Boomsma W, Paluszewski M, Frellsen J, Johansson K, Hamelryck T. 2010.Beyond
rotamers: a generative, probabilistic model of side chains in proteins.BMC Bioinformatics 11:306DOI 10.1186/1471-2105-11-306.
He X, Wang B, Merz Jr KM. 2009.Protein nmr chemical shift calculations based on the automated fragmentation qm/mm approach.The Journal of Physical Chemistry B113(30):10380–10388 DOI 10.1021/jp901992p.
Jones E, Oliphant T, Peterson P et al.2001.SciPy: open source scientific tools for Python. Available athttp://www.scipy.org/(accessed 8 March 2015).
Khare D, Alexander P, Antosiewicz J, Bryan P, Gilson M, Orban J. 1997.pKameasurements
from nuclear magnetic resonance for the B1 and B2 immunoglobulin G-binding domains of protein G: comparison with calculated Values for nuclear magnetic resonance and X-ray structures.Biochemistry36(12):3580–3589DOI 10.1021/bi9630927.
KohlhoffK, Robustelli P, Cavalli A, Salvatella X, Vendruscolo M. 2009.Fast and accurate predictions of protein NMR chemical shifts from interatomic distances.Journal of the American
Chemical Society131:13894–13895DOI 10.1021/ja903772t.
Kromann J, Christensen A, Steinmann C, Korth M, Jensen J. 2014.A third-generation dispersion and third-generation hydrogen bonding corrected PM6 method: PM6-D3H+.PeerJ2:e449 DOI 10.7717/peerj.449.
Lange OF, Lakomek N-A, Fares C, Schroder GF, Walter KFA, Becker S, Meiler J, Grubmuller H, Griesinger C, De Groot BL. 2008.Recognition dynamics up to microseconds revealed from an RDC-derived ubiquitin ensemble in solution.Science320(5882):1471–1475
DOI 10.1126/science.1157092.
Lange OF, Rossi P, Sgourakis NG, Song Y, Lee H-W, Aramini JM, Ertekin A, Xiao R, Acton TB, Montelione GT, Baker D. 2012.Determination of solution structures of proteins up to 40 kDa using CS-Rosetta with sparse NMR data from deuterated samples.Proceedings of the National Academy of Sciences of the United States of America109(27):10873–10878
DOI 10.1073/pnas.1203013109.
Lenkinski RE, Chen DM, Glickson JD, Goldstein G. 1977.Nuclear magnetic resonance studies of the denaturation of ubiquitin.Biochimica et Biophysica Acta (BBA)—Protein Structure 494(1):126–130DOI 10.1016/0005-2795(77)90140-4.
Li D, Br¨uschweiler R. 2015.PPM One: a static protein structure based chemical shift predictor.
Journal of Biomolecular NMR62:403–409DOI 10.1007/s10858-015-9958-z.
Lindorff-Larsen K, Best RB, DePristo MA, Dobson CM, Vendruscolo M. 2005.Simultaneous determination of protein structure and dynamics. Nature 433(7022):128–132
DOI 10.1038/nature03199.
Mackerell AD. 2004.Empirical force fields for biological macromolecules: overview and issues.
Journal of Computational Chemistry25(13):1584–1604DOI 10.1002/jcc.20082.
Martin O, Arnautova Y, Icazatti A, Scheraga H, Vila J. 2013.Physics-based method to validate and repair flaws in protein structures.Proceedings of the National Academy of Sciences of the
United States of America110:16826–16831DOI 10.1073/pnas.1315525110.
Mulder F, Filatov M. 2010.NMR chemical shift data and ab initio shielding calculations: emerging tools for protein structure determination.Chemical Society Reviews39:578–590 DOI 10.1039/B811366C.
Nielsen J, Eghbalnia H, Nielsen N. 2012.Chemical shift prediction for protein structure calculation and quality assessment using an optimally parameterized force field.Progress in Nuclear Magnetic Resonance Spectroscopy60:1–28DOI 10.1016/j.pnmrs.2011.05.002.
Parker L, Houk A, Jensen J. 2006.Cooperative hydrogen bonding effects are key determinants of backbone amide proton chemical shifts in proteins.Journal of the American Chemical Society 128:9863–9872DOI 10.1021/ja0617901.
Platzer G, Okon M, McIntosh L. 2014.pH-dependent random coil1H,13C, and15N chemical shifts of the ionizable amino acids: a guide for protein pKa measurements.Journal of
Biomolecular NMR60:109–129DOI 10.1007/s10858-014-9862-y.
Ponder JW, Richards FM. 1987.An efficient newton-like method for molecular mechanics energy minimization of large molecules.Journal of Computational Chemistry8(7):1016–1024 DOI 10.1002/jcc.540080710.
Qiu D, Shenkin PS, Hollinger FP, Still WC. 1997.The GB/SA continuum model for solvation. A fast analytical method for the calculation of approximate born radii.The Journal of Physical
Chemistry A101(16):3005–3014DOI 10.1021/jp961992r.
Raman S, Lange OF, Rossi P, Tyka M, Wang X, Aramini J, Liu G, Ramelot TA, Eletsky A, Szyperski T, Kennedy MA, Prestegard J, Montelione GT, Baker D. 2010.NMR structure determination for larger proteins using backbone-only data.Science327(5968):1014–1018 DOI 10.1126/science.1183649.
Robustelli P, KohlhoffK, Cavalli A, Vendruscolo M. 2010.Using NMR chemical shifts as structural restraints in molecular dynamics simulations of proteins.Structure18(8):923–933 DOI 10.1016/j.str.2010.04.016.
Rosner B. 1983.Percentage points for a generalized ESD many-outlier procedure.Technometrics 25(2):165–172DOI 10.1080/00401706.1983.10487848.
Schmidt MW, Baldridge KK, Boatz JA, Elbert ST, Gordon MS, Jensen JH, Koseki S, Matsunaga N, Nguyen KA, Su S, Windus TL, Dupuis M, Montgomery JA. 1993.General atomic and molecular electronic structure system.Journal of Computational Chemistry 14(11):1347–1363DOI 10.1002/jcc.540141112.
Schr¨odinger LLC. 2010.The PyMOL molecular graphics system. Version 1.3r1.
Shen Y, Bax A. 2010.SPARTA+: a modest improvement in empirical NMR chemical shift prediction by means of an artificial neural network.Journal of Biomolecular NMR48:13–22 DOI 10.1007/s10858-010-9433-9.
Steinmann C, Blædel KL, Christensen AS, Jensen JH. 2013.Interface of the polarizable continuum model of solvation with semi-empirical methods in the GAMESS program.PLoS ONE8(7):e67725DOI 10.1371/journal.pone.0067725.
Stewart J. 2007.Optimization of parameters for semiempirical methods V: modification of NDDO approximations and application to 70 elements.Journal of Molecular Modelling13:1173–213 DOI 10.1007/s00894-007-0233-4.
Sumowski CV, Hanni M, Schweizer S, Ochsenfeld C. 2014.Sensitivity ofab initiovs empirical methods in computing structural effects on NMR chemical shifts for the example of peptides.
Journal of Chemical Theory and Computation10(1):122–133DOI 10.1021/ct400713t.
Swails J, Zhu T, He X, Case DA. 2015.AFNMR: automated fragmentation quantum mechanical calculation of NMR chemical shifts for biomolecules. Journal of Biomolecular NMR 63(2):125–139DOI 10.1007/s10858-015-9970-3.
Tamiola K, Acar B, Mulder FAA. 2010. Sequence-specific random coil chemical shifts of
intrinsically disordered proteins.Journal of the American Chemical Society132(51):18000–18003 DOI 10.1021/ja105656t.
Tomasi J, Mennucci B, Cammi R. 2005.Quantum mechanical continuum solvation models.
Chemical Reviews105(8):2999–3094DOI 10.1021/cr9904009.
Ulmer T, Ramirez B, Delaglio F, Bax A. 2003.Evaluation of backbone proton positions and dynamics in a small protein by liquid crystal NMR spectroscopy.Journal of the American
Chemical Society125:9179–9191DOI 10.1021/ja0350684.
Ulrich EL, Akutsu H, Doreleijers JF, Harano Y, Ioannidis YE, Lin J, Livny M, Mading S, Maz-iuk D, Miller Z, Nakatani E, Schulte CF, Tolmie DE, Wenger RK, Yao H, Markley JL. 2007. BioMagResBank.Nucleic Acids Research36(Database):D402–D408DOI 10.1093/nar/gkm957. Vijay-Kumar S, Bugg C, Cook W. 1987.Structure of ubiquitin refined at 1.8 A resolution.Journal
of Molecular Biology194:531–544DOI 10.1016/0022-2836(87)90679-6.
Vila J, Arnautova Y, Martin O, Scheraga H. 2009.Quantum-mechanics-derived 13Cα chemical shift server (CheShift) for protein structure validation.Proceedings of the National Academy of Sciences of the United States of America106:16972–16977
DOI 10.1073/pnas.0908833106.
Vila J, Arnautova Y, Martin O, Scheraga H. 2014.Are accurate computations of the 13C′ shielding feasible at the DFT level of theory?Journal of Computational Chemistry35:309–312 DOI 10.1002/jcc.23499.
Vila JA, Baldoni HA, Scheraga HA. 2009.Performance of density functional models to reproduce observed 13Cα chemical shifts of proteins in solution.Journal of Computational Chemistry
30(6):884–892DOI 10.1002/jcc.21105.
Vila JA, Serrano P, W¨uthrich K, Scheraga HA. 2010.Sequential nearest-neighbor effects on computed 13Cαchemical shifts.Journal of Biomolecular NMR48(1):23–30
DOI 10.1007/s10858-010-9435-7.
V¨ogeli B, Kazemi S, G¨untert P, Riek R. 2012.Spatial elucidation of motion in proteins by ensemble-based structure calculation using exact NOEs.Nature Structural & Molecular Biology 19(10):1053–1057DOI 10.1038/nsmb.2355.
Zhang Y, Wu A, Xu X, Yan Y. 2006.OPBE: a promising density functional for the calculation of nuclear shielding constants.Chemical Physics Letters421(4–6):383–388
DOI 10.1016/j.cplett.2006.01.095.
Zhu T, He X, Zhang JZH. 2012.Fragment density functional theory calculation of NMR chemical shifts for proteins with implicit solvation.Physical Chemistry Chemical Physics 14(21):7837–7845DOI 10.1039/C2CP23746F.
Zhu T, Zhang JZH, He X. 2013.Automated fragmentation QM/MM calculation of amide proton chemical shifts in proteins with explicit solvent model.Journal of Chemical Theory and