Printed in Brazil - ©2007 Sociedade Brasileira de Química 0103 - 5053 $6.00+0.00
A
r
t
ic
le
A
r
t
ic
le
A
r
t
ic
le
A
r
t
ic
le
A
r
t
ic
le
*e-mail: [email protected]
Computer-Aided Prediction of
125Te and
13C NMR Chemical Shifts of Diorgano Tellurides
Vicente P. Emerenciano,*,a Dennis G. Diego,a Marcelo J. P. Ferreira,a Marcus T. Scotti,a Gilberto V. Rodriguesb and João V. Comassetoa
a
Instituto de Química, Universidade de São Paulo, CP 26077, 05513-970 São Paulo-SP, Brazil
b
Departamento de Química, Universidade Federal de Minas Gerais, 30161-000 Belo Horizonte-MG, Brazil
Esse trabalho descreve um método para previsão dos deslocamentos químicos de RMN de
125Te e 13C de diorgano-teluretos baseado em uma abordagem tridimensional. Para tanto, 150
substâncias foram selecionadas da literatura e tiveram suas respectivas geometrias otimizadas através do método semi-empírico PM3. A partir desses dados, as estruturas foram codificadas através do programa FOCOS, que descreve o ambiente químico de cada átomo presente na estrutura, num total de 1411 focos para as substâncias. O método descrito foi testado com dez diorgano teluretos não inseridos na base de dados e mostrou uma exatidão maior na previsão de deslocamentos químicos de RMN de 125Te e 13C do que os dados previstos por um programa comercial. Os dados
e os parâmetros estatísticos obtidos nesse estudo demonstram que o método aplicado foi capaz de prever com sucesso os deslocamentos químicos de RMN de 125Te e 13C dos diorgano teluretos.
This work describes a method to predict the 125Te and 13C NMR chemical shifts of diorgano
tellurides based in a three-dimensional approach. For that, a collection of 150 compounds were selected from the literature and had their geometry optimized using the PM3 semi-empirical method. From this data, the structures were coded by the FOCOS program which described the chemical environment for each atom present in the structure, totalizing 1411 focos for the substances. The method developed was tested with ten diorgano tellurides not inserted in the database showing a higher accuracy in the prediction of 125Te and 13C NMR chemical shifts than
those predicted by the commercial program. The chemical shifts and the statistical parameters obtained in this work demonstrate that the method applied was able to predict successfully the
13C and 125Te NMR chemical shifts of the diorgano tellurides.
Keywords: 125Te NMR, 13C NMR, chemical shift prediction, tellurides
Introduction
In the last decades, organic tellurium compounds have
been applied as ligands in transition metal chemistry,1,2
polymerization catalysts,3,4 anti-oxidant agents5-8 and
synthetic intermediates.9-12 In view of this interest in the
organic compounds of this element, analytical methods for their rapid identification are welcome. Nuclear magnetic resonance (NMR) spectroscopy in nowadays is the routine technique of choice for this end. There are eight naturally
occurring isotopes of tellurium. However, only 123Te and
125Te are active in NMR spectroscopy. The latter isotope is
significantly more naturally abundant (7%) than the former
one (1%). The 125Te isotope is 12.5 times more receptive
than 13C.13 In addition, 125Te NMR presents a spectral width
of about 7000 ppm.14 Consequently, minor structural
changes in a molecule cause sensitive chemical shift
responses in its 125Te NMR spectrum of compounds.
Considering the increasing importance of the organic
tellurium compounds and the magnetic properties of 125Te
commented above, in this work we developed a method
to predict the 125Te and 13C NMR chemical shifts of
diorganotellurides based in a three-dimensional approach.
Theoretical approach
The structure determination of a new organic compound is currently made by coupling information derived from several spectroscopic methods with those obtained from 2D
NMR spectroscopy. For this end, tables of chemical shifts,15,16
are many times insufficient for the validation of complex and hypothetical structures. In order to help in the spectra
analysis, a number of methods for 13C and 1H NMR chemical
J. Braz. Chem. Soc.
methods use linear additive models, database retrieval approaches, empirical modeling or artificial neural networks
techniques.17-27 However, to the best of our knowledge, the
methods up to now developed are unable to predict 125Te
chemical shifts. On the other hand, the 13C NMR prediction
for organotellurium compounds, by these methods are scarce and show large error ranges.
The three-dimensional database
A total of 150 diorgano tellurides were selected for this
work. The 13C and 125Te NMR chemical shift data assigned
in the literature were used. The structures of the selected
compounds were optimized at the PM3 semiempirical level 28
employing the HyperChem program.29 After the
opti-mization process of the organo tellurides, their structures
were coded by the FOCOS program,30 which uses data
derived from the optimized geometry and the reported 13C
and 125Te NMR chemical shifts.
Atom codification
The following codes were computed for each carbon and tellurium atom using the geometrical and connectivity information obtained:
Ati-atom type code, that encodes the nature of the atom
i, its hybridization state and hydrogenation pattern. Thirty
three atom types (Table 1) were considered in the codification of the FOCOS program.
Sci-stereochemical code of tertiary and quaternary
carbon atoms. For the chiral centers the codes 01 and 02
were attributed if the atom presents the R or the S
configuration, respectively. For the achiral centers it was assigned the code 00.
The chemical environments were coded for the
structure (all atoms) and designated as foco. The foco
contains the atom type description (Ati) according to
Table 1 for each element present in the structure, its
respective stereochemical code (Sci) and all the
neighboring atoms coded according to Table 1 and correlated with their distance from the centralized atom. The neighboring atoms are organized according to the increasing distance value from the focused atom. The maximum distance for the codification process can be
selected by the user; in this study, the focos were
constructed with the maximum distance of 5 Å. For each
codified foco, the chemical shift value was stored
together with the chemical environment.
All atoms i having the same foco were grouped into a
cluster. Two focos atoms were considered as being equal if
the distance tolerance is not larger than 0.25 Å. At the end of the clustering process, the mean chemical shift of the atoms belonging to the cluster was stored. The database elaborated
contains 1411 focos for the 150 diorgano tellurides.
Results and Discussion
In order to predict the chemical shifts of the tellurium and carbon atoms, the three-dimensional model of the hypothetical structure was first constructed following the same method used for the database elaboration. Then the parameters of each atom of the structure were generated using the same variables as described above. To test the performance of the FOCOS program, ten diorgano
Table 1. Atomic groups and respective codes used in the molecular codification by the FOCOS program
Atomic groups Code Atomic groups Code Atomic groups Code
– CH3 01 =C= 12 – F 23
– CH2 – 02 =O 13 – Cl 24
– CH – 03 –OH 14 – Br 25
– C – 04 – O – 15 – I 26
=CH2 05 – NH2 16 – SH 27
=CH– 06 – NH – 17 – S – 28
– C = 07 – N– 18 =S 29
TCH– 08 =NH 19 – S = 30
TC – 09 =N – 20 = S = 31
HC* 10 TN 21 TP 32
C* 11 N* 22 Te (II) 33
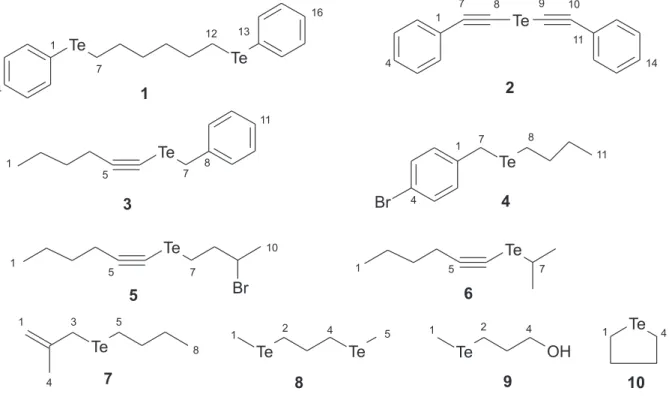
tellurides not inserted in the database were selected
randomly from the literature.31-34 The structures of these
compounds are shown in Figure 1.
The 125Te and 13C NMR chemical shifts predicted by the
FOCOS program for these ten tellurides are shown in Table 2. The chemical formula were also submitted to the
Table 2. Experimental and predicted NMR chemical shifts (ppm)
Compound 1 Compound 2 Compound 3
Exp. FOCOS ACD Exp. FOCOS ACD Exp. FOCOS ACD
1 111.80 111.70 111.70 123.40 129.80 130.78 13.55 13.90 14.10
2 138.30 138.30 137.71 132.30 131.90 131.44 21.84 22.00 22.40
3 127.40 127.90 128.70 129.00 128.80 128.88 31.00 31.20 31.70
4 128.00 130.40 127.00 128.40 128.50 128.50 20.63 20.85 21.10
5 127.40 127.90 128.70 129.00 128.80 128.88 114.96 114.80 113.03
6 138.30 138.30 137.71 132.30 131.90 131.44 33.89 34.12 34.44
7 8.40 8.40 8.36 112.90 112.90 112.90 12.13 11.70 7.90
8 31.60 31.60 30.74 44.80 44.90 44.80 139.76 140.10 140.51
9 31.00 31.00 29.17 44.80 44.90 44.80 128.40 129.00 130.33
10 31.00 31.00 29.17 112.90 112.90 112.90 126.54 126.90 127.66
11 31.60 31.60 30.74 123.40 129.80 130.78 126.54 126.70 126.79
12 8.40 8.40 8.36 132.30 131.90 131.44 126.54 126.90 127.66
13 111.80 111.70 111.70 129.00 128.80 128.88 128.40 129.00 130.33
14 138.30 138.30 137.71 128.40 128.50 128.50 —- —-
—-15 127.40 127.90 128.70 129.00 128.80 128.88 —- —-
—-16 128.00 130.40 127.00 132.30 131.90 131.44 —- —-
—-17 127.40 127.90 128.70 —- —- —- —- —-
—-18 138.30 138.30 137.71 —- —- —- —- —-
—-Te 468.00 394.60 —- 361.00 332.00 —- 456.00 448.00
—-Te 468.00 394.60 —- —- —- —- —- —-
—-Compound 4 Compound 5 Compound 6
Exp. FOCOS ACD Exp. FOCOS ACD Exp. FOCOS ACD
1 140.50 141.40 140.55 13.85 13.90 14.10 13.33 13.90 14.10
2 130.10 128.70 129.66 22.31 22.00 22.40 21.66 22.00 22.40
3 131.50 131.30 130.22 31.71 31.20 31.70 30.98 31.20 31.70
4 119.50 119.00 121.33 20.99 20.85 21.10 20.49 20.85 21.10
5 131.50 131.30 130.22 112.60 113.10 111.26 114.29 114.80 111.71
6 130.10 128.70 129.66 33.74 33.25 33.49 32.57 32.95 32.59
7 4.80 6.30 4.14 6.27 5.98 3.87 16.45 18.10 29.62
8 4.00 3.20 2.62 43.48 41.50 39.68 25.28 25.10 24.78
9 34.10 34.10 34.63 53.08 54.95 56.94 25.28 25.10 24.78
10 25.20 25.20 25.20 26.12 26.00 25.87 —- —-
—-11 13.40 13.50 13.40 —- —- —- —- —-
—-Te —- 157.8 —- 283.00 298.00 —- 483.00 488.00
—-Compound 7 Compound 8 Compound 9
Exp. FOCOS ACD Exp. FOCOS ACD Exp. FOCOS ACD
1 110.90 110.45 109.93 -23.30 -22.40 -21.38 -22.70 -22.40 -21.66
2 143.80 143.10 141.13 5.20 6.75 15.24 -1.60 0.45 12.01
3 10.40 11.30 22.13 33.60 31.45 29.16 33.80 32.35 30.67
4 21.60 21.70 21.90 5.20 6.75 15.24 62.80 63.00 63.07
5 4.50 3.20 1.99 -23.30 -22.40 -21.38 —- —-
—-6 34.00 34.10 34.25 —- —- —- —- —-
—-7 25.20 25.20 25.20 —- —- —- —- —-
—-8 13.40 13.50 13.40 —- —- —- —- —-
—-Te —-* —- —- 104.00 107.50 —- 105.00 107.50
—-Compound 10
Exp. FOCOS ACD
1 5.80 2.50 33.57
2 35.80 36.20 37.30
3 35.80 36.20 37.30
4 5.80 2.50 33.57
Te 234.00 245.00
J. Braz. Chem. Soc.
commercial ACD program,35 which predicted their 13C NMR
chemical shifts for the compounds (Table 2). For the
compound 7 the 125Te NMR data was not displayed in Table
2 because this data was not available in the original reference. Analyzing the results generated by both programs one
can observe that for 13C NMR chemical shift prediction,
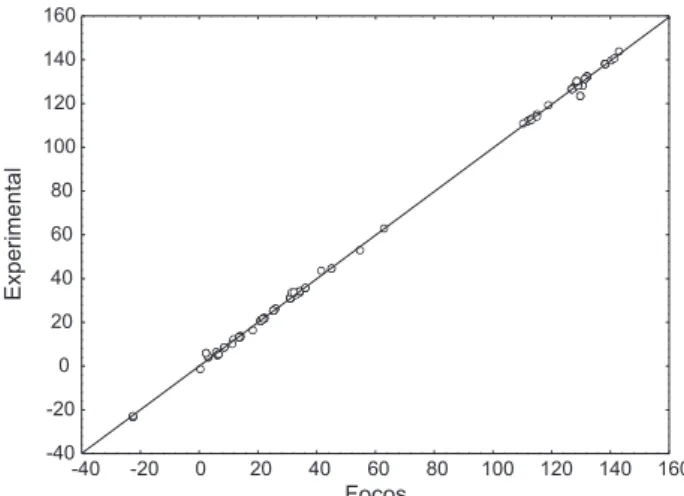
the FOCOS program shows an average error of 0.67 ppm and a maximum error of 6.40 ppm, whereas the ACD program exhibits an average error of 2.11 ppm and a maximum error of 27.77 ppm. Linear regression of
predicted against observed 13C NMR chemical shifts for
the FOCOS and ACD programs are displayed in Figures 2 and 3, respectively. The coefficients obtained from the regressions are displayed in the equations below. The main
errors on the 13C NMR chemical shift prediction were
observed in both programs for the carbon atoms directly
bonded to the tellurium atom (α-carbons), once these
atoms show the typical high field resonance.
Equation for 13C NMR data predicted from the FOCOS
program:
Experimental = +0.99680(±0.00464) Focos +0.03896(±0.403839) (n=098; r=1.000; s=1.266; F=182507.818;)
Equation for 13C NMR data predicted from the ACD
program:
Experimental = +1.01349(±0.01845) ACD -2.06478(±1.608659) (n=098; r=0.996; s=4.936; F=11907.938;)
The data prediction carried out by the FOCOS program exhibits a higher accuracy than those predicted by the ACD program, because in the former the database was addressed for diorgano tellurides. This specific database shows atoms with similar chemical environments of the test compounds,
resulting in smaller errors in the 13C NMR chemical shift
prediction. However, it was not possible to compare the
125Te NMR data predicted by the FOCOS program with
other commercial software because they do not present 125Te
NMR predictions.
Using the results obtained by the FOCOS program for the tellurium atom, a linear regression of the data predicted against the experimental chemical shifts was plotted (Figure 4). The coefficients obtained from the regression
for the 125Te data are shown in the equation below.
Equation for 125Te NMR data predicted from the
FOCOS program:
Experimental = +1.09859(±0.20254) Focos -14.52909(±68.598651) (n=009; r=0.978; s=34.224; F=156.452;)
The tellurium chemical shifts of diorgano tellurides are strongly dependent on the structure of the organyl Figure 1. Tellurides used to test the programs.
Te
Te
Te
Te
Te
Br
Te
Br
Te
Te Te Te Te OH
Te 1
4
7
12 13
4
11
14
16 1 7 8 9 10
1
5 7
8
11
4
7 8
11 1
1
5 7
10
1 5 7
1
4
3 5
8
1 2 4 5 1 2 4 1 4
1 2
3 4
5 6
group. For compounds 1 and 2 the FOCOS program fails to reproduce adequately the experimental data. Note that these compounds have a Te substituent in a phenyl ring
and in a phenyl –C≡C– conjugated system. Additionally,
Figure 2.13C NMR chemical shifts (ppm) experimental vs. predicted by the FOCOS program.
-40 -20 0 20 40 60 80 100 120 140 160
Focos
Experimental
-40 -20 0 20 40 60 80 100 120 140 160
Figure 3.13C NMR chemical shifts (ppm) experimental vs. predicted by the ACD program.
-40 -20 0 20 40 60 80 100 120 140 160
ACD
Experimental
-40 -20 0 20 40 60 80 100 120 140 160
Figure 4.125Te NMR chemical shifts (ppm) experimental vs. predicted by the FOCOS program.
50 100 150 200 250 300 350 400 450 500 550
Focos
Experimental
50 100 150 200 250 300 350 400 450 500 550
the 125Te chemical shifts are dependent upon solvent,
temperature and concentration of the sample. In this way,
the prediction of 125Te NMR chemical shifts is a hard task
due to the number of variables involved. However, the data shown indicate that the values calculated by the methods described in this work agree satisfactorily with the experimental data.
The parameters obtained from the regression methods are statistically significant and demonstrate that despite of the experimental data show the large variation due to the higher sensibility to external factors, the method here
described was able to predict successfully the 13C and 125Te
NMR chemical shifts.
Conclusions
The method described in this paper allows the
prediction of 125Te and 13C NMR chemical shifts of
diorgano tellurides, employing a database that contains 150 substances. The three-dimensional code described is detailed enough to consider all atoms that can influence the magnetic behavior of the resonant atom. This approach lead to accurate results in the restricted structural domain of the diorgano tellurides, but could be extended to other heavy resonant atoms.
References
1. Singh, A. K.; Sharma, S.; Coord. Chem. Rev.2000, 209, 49. 2. Levason, W.; Orchard, S. D.; Reid, G.; Coord. Chem. Rev.2002,
225, 159.
3. Goto, A.; Kwak, Y.; Fukuda, T.; Yamago, S.; Iida, K.; Nakajima, M.; Yoshida, J.; J. Am. Chem. Soc.2003, 125, 8720. 4. Yamago, S.; Lida, K.; Yoshida, J.; J. Am. Chem. Soc.2002,
124, 2874.
5. Luo, G. M.; Ren, X. J.; Liu, J. Q.; Um, Y.; Shen, J. C.; Curr. Med. Chem.2003, 10, 1151.
6. Mugesh, G.; Panda, A.; Kumar, S.; Apte, S. D.; Singh, H. B.; Butcher, R. J.; Organometallics2002, 21, 884.
7. Mc Naughton, M.; Engman, L.; Birmingham, A.; Powis, G.; Cotgreave, I. A.; J. Med. Chem.2004, 47, 233.
8. Nogueira, C. W.; Zeni, G.; Rocha, J. B. T.; Chem. Rev.2004,
104, 6255.
9. Marino, J. P.; McClure, M. S.; Holub, D. P.; Marino, J. V.; Tucci, F. C.; J. Am. Chem. Soc.2002, 124, 1664.
10. Comasseto, J. V.; Barrientos-Astigarraga, R. E.; Aldrichim. Acta
2000, 33, 66.
11. Petragnani, N.; Stefani, H. A.; Tetrahedron2005, 61, 1613. 12. Zeni, G.; Lüdtke, D. S.; Panatieri, R. B.; Braga, A. L.; Chem.
Rev. 2006, 106, 1032.
J. Braz. Chem. Soc.
14. Diego, D. G.; Ph.D. Thesis, Universidade de São Paulo, São Paulo, Brazil, 2006.
15. Bremser, W.; Franke, B.; Wagner, H.; Chemical Shift Ranges in Carbon 13 NMR Spectroscopy, Verlag Chimie: Basel, 1982. 16. Pretsch, E. Clerc, T.; Seibl, J.; Simon, W.; Tables of Spectral Data for Structure Determination of Organic Compounds, Springer: Berlin, 1989.
17. Jensen, K. L.; Barber, A. S.; Small, G. W.; Anal. Chem.1991,
63, 1081.
18. Kvasnicka, V.; Sklenak, S.; Pospichal, J.; J. Chem. Inf. Comput. Sci.1992, 32, 742.
19. Thomas, S.; Ströhl, D.; Kleinpeter, E.; J. Chem. Inf. Comput. Sci.1994, 34, 725.
20. Svozil, D.; Pospichal, J.; Kvasnicka, V.; J. Chem. Inf. Comput. Sci.1995, 35, 924.
21. Clouser, D. L.; Jurs, P. C.; Anal. Chim. Acta1996, 321, 127. 22. Clouser, D. L.; Jurs, P. C.; J. Chem. Inf. Comput. Sci.1996, 36,
168.
23. Ivanciuc, O.; Rabine, J. P.; Cabrol-Bass, D.; Panaye, A.; Doucet, J. P.; J. Chem. Inf. Comput. Sci.1997, 37, 587.
24. Schweitzer, R. C.; Small, G. W.; J. Chem. Inf. Comput. Sci.
1997, 37, 249.
25. SpecInfo, Chemical Concepts, 2001, STN, Karlsruhe. 26. Meiler, J.; Will, M.; J. Chem. Inf. Comput. Sci.2001, 41, 1535. 27. Nohair, M.; Zakarya, D.; Berrada, A.; J. Chem. Inf. Comput.
Sci.2002, 42, 586.
28. Stewart, J. J. P.; J. Comput. Chem.1989, 1, 209.
29. HyperChem, version 6.03, Hyperclube, Gainesville (Fl), USA. 30. Ferreira, M. J. P.; PhD. Thesis, Universidade de São Paulo,
Brazil, 2003.
31. Hope, E. G.; Kemmitt, T.; Levason, W.; Organometallics1988,
7, 78.
32. Gedridge Jr., R. W.; Brandsma, L.; Nissan, R. A.; Verkruijsse, H. D.; Harder, S.; de Jong, R. L. P.; O’Connor, C. J.;
Organometallics1992, 11, 418.
33. Citeau, H. A. S.; Giolando, D. M.; J. Organomet. Chem.2001,
625, 23.
34. Kanda, T.; Kato, S.; Sugino, T.; Kambe, N.; Sonoda, N.; J. Organomet. Chem. 1994, 473, 71.
35. Advanced Chemistry Development, ACD-CNMR Predictor, version 4.5, 2000.
Received: September 12, 2006 Web Release Date: September 12, 2007