American Journal of Engineering Research (AJER)
2017
American Journal of Engineering Research (AJER)
e-ISSN: 2320-0847 p-ISSN : 2320-0936
Volume-6, Issue-2, pp-13-16
www.ajer.org
Research Paper Open Access
w w w . a j e r . o r g
Page 13
Determination of Rainfall Erosivity Index (R) For Imo State,
Nigeria
Okorafor, O.O
1, Akinbile, C.O
2, Adeyemo, A.J
3, Egwuonwu, C.C
41,4
Department of Agricultural and Bioresources Engineering, Federal University of Technology, Owerri, Imo State, Nigeria.
2
Department of Agricultural and Environmental Engineering, Federal University of Technology, Akure, Ondo State, Nigeria.
3
Department of Crop Storage and Pest Management, Federal University of Technology, Akure, Ondo State, Nigeria.
ABSTRACT:
In order to proffer solutions to erosion within the southeastern part of the country predominantly by the erosive nature of rainfall, the study aims at determining the rainfall erosivity index (R) of Imo State by the use of historical data of over thirty years (1980-2010). The data for rainfall records were grouped in mean groups for each month (January - December), the mean, standard deviation and coefficient of variation were 199.15, 144.76 and 0.727 respectively. From empirical equations rainfall intensities and erosivity index were obtained at 30, 45 and 60 minutes duration of rainfall respectively, and based on 30minutemaximum erosive rainfall Rainfall erosivity index R was obtained as 6033.40 MJmmha-1 h-1. A close observation
of the data obtained revealed that as rainfall intensity increased with duration the rainfall erosivity index
reduced or decreased. The study area was grouped as a medium – strong erosivity zone based on R index
obtained. Nevertheless it is expected that if proper cover crop and management practices are applied despite the region (rain forest) the study area falls within, the effect of rainfall erosivity can be cushioned thus reducing further tendencies of erosion and enhance chances of food production from productive lands within the area.
Keywords:
Rainfall erosivity, RUSLE, Soil erosion, USLEI.
INTRODUCTION
Soil erosion which is a global threat responsible for soil nutrient depletion, degradation of soil quality, destruction of soil structure and disruption of ecosystem; have reduced the availability of productive lands for cultivation which in turn has greatly reduced chances of food sufficiency and security in the country. Though the potential for erosion is dependent on certain factors which include soil nature/characteristics, nature of slope/topography, presence of vegetation and climatic conditions, (Michael and Ojha, 2002). The major contributing factor to soil loss and movement is rainfall and its characteristics (intensity, distribution, duration, frequency, kinetic energy). Soil erosion by rainfall causes many problems, such as decreased agricultural productivity due to the loss of arable land, increased landslide activity, ecosystem disturbance, and contaminant diffusion by the inflow of sediment to rivers, (Joon-Hak and Jun-Haeng, 2011). According to Lal, (2002); Ezemonye and Emeribe, (2012),under particular environmental conditions rainfall is the main factor driving degradation because it can erode soils and nutrients by force of raindrops, surface and sub-surface runoff. Idah
et al., (2008) stated that when there is too much water on the soil surface, it fills surface depressions and begins
to flow, then with enough speed, surface runoff carries away the loose soil. Suresh (2012), stated equally that soil erosion occurs in three phenomena detachment, transportation and deposition; and rainfall creates the medium through which they all take place. The ability of rainfall to cause soil disturbance, detachment, transport and eventual deposition which results in soil erosion is referred to as rainfall erosivity. Rainfall erosivity is the main parameter to relate soil losses to erosion, which is the ability of rainfall to detach soil particles,
(Sanchez-Moreno et al., 2013). Erosivity is the power of a storm to erode soil, it is usually determined from the
characteristics of the storm, (Wang et al., 2013). Rainfall erosivity is one of the factors of the USLE (Universal
Soil Loss Equation by Wischmeier and Smith, 1978) and RUSLE (Revised Universal Soil Loss Equation by
American Journal of Engineering Research (AJER)
2017
w w w . a j e r . o r g
Page 14
A = R x K x S x C x P ……… (1)
Where R = Rainfall Erosivity factor K = Soil Erodibility Factor
S = Slope length and Steepness factor C = Cover Crop Management Factor
P = Conservative/Management practice Factor
Rainfall erosivity factor is designated by R, this factor according to (Ezemonye and Emeribe, 2012; Igwe, 2012; Angelo-Martinez and Beguaria, 2009; Bhaware, 2006) rainfall erosoivity depends on amount, duration, intensity, rain drop size and shape, distribution, frequency and kinetic energy. Rainfall erosivity is of paramount importance among natural factors affecting soil erosion, and unlike some other natural factors, such as relief or soil characteristics, is not amenable to human modification (Angelo-Martinez and Beguaria, 2009). The objective of this study is to make use of mean monthly rainfall data to determine the rainfall erosivity index/factor of Imo State, Nigeria.
II.
MATERIALS AND METHODS
2.1 Study Area Description
The study area falls within Latitudes 4⁰45"N and 7⁰15"N and Longitudes 6⁰50"E and 7⁰25"E, with an
area of 5100 km2. It lies within the humid tropics and is generally characterized by a high surface air
temperature regime all year round, with mean minimum temperature of 23.5° C and mean maximum
temperature of 32.1° (Okorie et al., 2012). The rainfall pattern in the area is oscillatory, bimodal and usually has
tow peaks within the year. The peaks vary between June, July and September with a short recess in August usually referred to as August break. The study area is within the rainforest region, so it experiences annual
rainfall ranges from 1600-2900mm (Selemo et al., 2012). The soil predominant in the area is sandy soil with
little percentages of clay, loam and silt (Njoku et al., 2011). The soil profile is remarkably uniform throughout
the area, deeply weathered and intensely leached.
III.
DATA COLLECTION
In obtaining the rainfall erosivity factor/ index of the study area (Imo), mean monthly rainfall data (rainfall amount and days) for 31 years (1980-2010) was obtained from Nigerian Metrological Agency
(NIMET), Oshodi, Lagos. The rainfall data was grouped and according to Sanchez-Moreno et al., 2013; Suresh,
2012; Oliviera et al., 2012 and Wischmeier and Smith 1965, the Rainfall erosivity factor/index is given by;
R ……… (2)
Where E = Kinetic Energy of storm or rainfall events
I30 = 30 minute rainfall intensity
From the above equation to obtain the kinetic energy of the storm or rainfall events the relationship is given by Soo Huey Teh, (2011) as;
………. (3)
Where I = Rainfall intensity (cm/hr)
Rainfall intensity which is the rate of rainfall expressed as depth per time (Michael and Ojha, 2003) is given by;
………...4.0
Where P = Precipitation in cm or mm T = Duration of rainfall in hours
IV.
RESULTS AND DISCUSSION
Table 1.0: Values of rainfall amount and days
MONTH M.R.A (cm) M.R.D (days) (X1-X) (X1-X)2
JANUARY 24.97 1.03 -174.18 30338.67
FEBRUARY 32.94 1.48 -166.21 27625.76
MARCH 105.56 4.10 -93.59 8759.09
APRIL 174.91 6.90 -24.24 587.58
MAY 259.68 10.07 60.53 3663.88
JUNE 319.90 10.97 120.75 14580.56
JULY 378.42 13.94 179.27 32137.73
AUGUST 348.79 14.58 149.64 22392.13
SEPTEMBER 387.79 14.07 188.64 35359.04
OCTOBER 269.11 11.45 69.96 4894.40
NOVEMBER 74.87 3.10 -124.28 15445.52
DECEMBER 12.83 0.52 -186.32 34715.14
Ʃ= 2389.77 Ʃ=230499.50
Where;
American Journal of Engineering Research (AJER)
2017
w w w . a j e r . o r g
Page 15
M.R.D = Mean Rainfall Days (days) = 2389.77/12 = 199.15
=
From TABLE 1.0 the rainfall data obtained for the specified period of 31 years (1980-2010), were grouped according to mean rainfall amount and mean rainfall days. The data was then subjected to statistical analysis and the mean (X), standard deviation (SD) and coefficient of variation were 199.15, 144.76 and 0.727 respectively. With reference to the coefficient of variation (CV) it signifies that the level variation in rainfall amount over the last thirty one (31) years have been high, this basically is observed in response to climate change.
Table 2.0: Values of Rainfall Intensity and Kinetic Energy
MONTH I30
(cm/hr) I45 (cm/hr)
I60 (cm/hr)
E
(MJmmha-1)
EI30
(MJmmha-1h-1) EI45
(MJmmha-1h-1) EI60
(MJmmha-1h-1)
JAN 2.02 1.35 1.01 236.87 478.48 319.78 239.24
FEB 1.86 1.24 0.93 233.75 434.78 289.85 217.39
MAR 2.15 1.43 1.07 239.22 514.32 342.09 257.16
APR 2.11 1.41 1.06 238.51 503.26 336.30 251.63
MAY 2.15 1.43 1.08 239.22 514.32 342.09 257.16
JUN 2.43 1.62 1.22 243.85 592.56 395.04 296.28
JUL 2.26 1.51 1.13 241.11 544.91 364.08 272.46
AUG 1.99 1.33 0.99 236.30 470.24 314.28 235.12
SEPT 2.29 1.53 1.15 241.61 553.29 369.66 276.65
OCT 1.96 1.31 0.98 235.73 462.03 308.81 231.02
NOV 2.01 1.34 1.01 236.68 475.73 317.15 237.87
DEC 2.06 1.37 1.03 237.61 489.48 325.33 244.74
Ʃ = 6033.40 Ʃ = 4024.66 Ʃ = 3016.72
The intensity of rainfall was prepared on the basis of three different durations, 30, 34 and 60. From the values displayed it was observed that as rainfall duration increased the ratio of rainfall amount to duration (rainfall intensity) was decreasing. Likewise the erosivity index at different rainfall intensities also decreased with increase in rainfall duration. This relationship is dependent on the fact that as rainfall duration increases the soil undergoes saturation and pore spaces are filled thus exceeding infiltration capacity at this point the soil particles no longer undergoes detachment or splash but movement so therefore as rainfall duration increases rainfall intensity keeps decreasing. According to Wischmeier, (1965) rainfall erosivity is considered a product of kinetic energy and 30-minute maximum rainfall intensity, so the rainfall erosivity index/factor of the study area
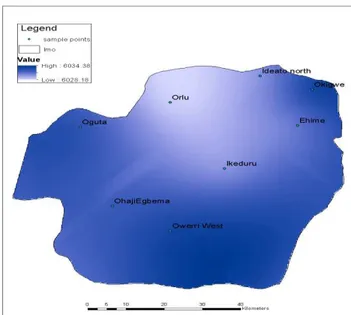
is 6033.40 MJmmha-1hr-1. The rainfall erosivity index (R), determined for Imo state was based on data made
available from one station. The data obtained was analyzed using raster distribution from ArcGIS 10.2,to generate the rainfall erosivity map on a 10% variation. The map is presented in Fig.1.0.
American Journal of Engineering Research (AJER)
2017
w w w . a j e r . o r g
Page 16
Table 3.0: Classification Of Rainfall Erosivity
EROSIVITY (MJmmha -1hr -1) EROSIVITY CLASS
R≤ 2452 low erosivity 2452<R≤4905 medium erosivity 4905<R≤7357 medium- strong erosivity
7357<R≤9810 strong erosivity
<9810 very strong erosivity Source: Carvalho (2008)
V.
CONCLUSION
Different values of erosivity were obtained for different rainfall intensities of which are EI= 6033.40
MJmmha -1h -1, EI= 4024.66 MJmmha -1h -1 and EI = 3016 MJmmha -1h -1. According to Wischmeier, (1965),
the minimum duration for an erosive storm event is 30 minutes, based on which the rainfall erosivity of the
study area was taken as 6033.40 MJmmha -1h -1. Also from Table 3.0 the study area can be classified as an area
with medium- strong erosivity, predominantly because of the region in which the study area lies i.e Tropical Rainforest zone.
ACKNOWLEDGEMENT
The researchers of this paper would like to express their profound gratitude to the data/records department of the Nigerian Meteorological Agency (NIMET), Oshodi, Lagos for providing the rainfall records required for this study.
REFERENCES
[1]. Angelo- Martinez, M and S. Begueria, (2009), Estimating Rainfall erosivity from daily precipitation records: A comparison among
methods using data from Ebro Basin (NE Spain), Elsevier Journal of Hydrology 379(2009) 111-121.
[2]. Bhaware, K.O., (2006), Soil Erosion Risk Modelling and Current Erosion Damage assessment using Remote Sensing and GIS
techniques. Indian Institute of Remote Sensing, Dehradun-248001
[3]. Carvalho, N.O., (2008). Hidrossedimentologia Prática, 2ª ed. Interciência, Rio da Janeiro, Brazil. 599 pp
[4]. Ezemonye, M.N and C.N Emeribe, (2012), Rainfall Erosivity in southeastern Nigeria, Ethiopian Journal of Environmental Studies
and Management 5(2),112-122.
[5]. Idah, P.A, Mustapha, H.I, Musa, J.J and J. Dike,(2008), Determination of Erodibility Indices of Soils in Owerri West Local
Government Area of Imo State, Nigeria. AU J.T. 12(2): 130-133
[6]. Igwe, C.A., (2012), Gully Erosion in Southeastern Nigeria: Role of Soil Properties and Environmental Factors; In Tech Open
Science Publishers,Pp.157-171.
[7]. Joon- Hak Lee and Jun-Haeng, (2011), Evaluation of estimation methods for rainfall erosivity based on annual precipitation in Korea. Elsevier Journal of hydrology 409(2011)30-48
[8]. Lal, R. 2002. Soil Degradation by Erosion. Land Degradation and Development12: 519 – 539.
[9]. Michael, A. M and Ojha, T.P. (2002), Principles of Agricultural Engineering, Volume II, Jain Publishers, New Dehli, India.
[10]. Njoku, J.D, A.O Nnaji and M.C Iwuji, (2011); Spatial Analysis of Soil Fertility using Geographical Information System (G.I.S) Technology, African Research Review, 4(2):511-524.
[11]. Okorie, F.C, Nnaji, A, Chibo, C and E. Pat-Mbeno, (2012), Evidence of Climate Variability in Imo State of Southeastern Nigeria,
Journal of Earth Science and Engineering 2(2012)544-553.
[12]. Oliveira, P.T.S, Wendland, E and M.A Nearing, (2012), Rainfall Erosivity in Brazil: A review. CATENA 100(2012)139-147.
[13]. Renard, K.G., Foster, G. R., Weesies, G.A, McCool, D. K., Yoder, D.C., (1997). Predicting Soil Erosion by water: A guideto
Conservation Planning with the RevisedUniversal Soil loss equation (RUSLE).USDA, Agriculture Handbook No.703,Washington
DC.
[14]. Sanchez-Moreno, J.F, Mannaerts C.M and V. Jetten, (2013), Rainfall Erosivity Mapping for Santiago, Cape Verde, GEODERMA
217-218(2014)74-82.
[15]. Selemo, A.O, Ananaba, S.E, Nwagbara, J.O, Egejuru, V.E and V. Nwugha, (2012), Geostatistical Analysis of Rainfall Temperature
and evaporation Data of Owerri for Ten years. Journal of Earth and Environmental Sciences, 2012(2)195-205.
[16]. Soo Huey Teh, (2011), Soil Erosion modeling using RUSLE and GIS on Cameron Highlands, Malaysia for hydropower
Development. A master’s thesis published by the school for renewable energy science, university of Iceland and Akureyri
[17]. Suresh, R, (2012), Soil and Water Conservation Engineering, 4th Edition Standard Publishers Distributors, New Dehli.
[18]. Wang, L., Huang, J., Du, Y., Hu, Y., and Han P., (2013) Dynamic Assessment of Soil Erosion Risk Using Landsat TM and HJ
Satelite Data in Danjiangkou Area, China. Journal of Remote Sensing 5(4): 3826-3848.
[19]. Wischmeier, W.H., Smith, D.D., (1978). Predicting rainfall erosion losses — A guide to conservation planning :United States Department of Agriculture Agricultural Handbook, 537. U.S. Government Printing Office, Washington D.C., USA.
[20]. Wischmeier, W.H., Smith, D.D., 1965. Predicting rainfall erosion losses from cropland east of the Rocky Mountains. : United States