Estimating RUSLEs rainfall factor in the part of Italy with a Mediterranean rainfall regime
103 Hydrology and Earth System Sciences, 8(1), 103107 (2004) © EGU
Estimating RUSLEs rainfall factor in the part of Italy with a
Mediterranean rainfall regime
Nazzareno Diodato
Monte Pino Naturalistic Observatory, Contrada Monte Pino, 82100 Benevento, Italy
E-mail: [email protected]
Abstract
The computation of the erosion index (EI), which is basic to the determination of the rainfall-runoff erosivity factor R of the Revised Universal Soil Loss Equation (RUSLE), is tedious and time-consuming and requires a continuous record of rainfall intensity. In this study, a power equation (r2 = 0.867) involving annual erosion index (EI
30-annual) in the Mediterranean part of Italy is obtained. Data from 12 raingauge
stations are used to derive and then test a regional relationship for estimating the erosion indexfrom only three rainfall parameters. Erosivity rainfall data derived from 5 additional stations are used for validation and critical examination. The empirical procedures give results which compare satisfactorily with relationships calibrated elsewhere.
Keywords: erosion index, rainfall, erosivity, Revised Universal Soil Loss Equation
Introduction
The Mediterranean environment is known not only for its limited water availability but also for flood events and for rainfall erosion under several land usages (Kosmas et al., 1997). Empirical and process-based soil erosion models use rain as the rainfallrunoff erosivity index. In modelling sheet and rill erosion with RUSLE (Renard et al., 1997), the rainfallrunoff erosivity factor (R) quantifies the effect of raindrop impact and reflects the amount and rate of runoff likely to be associated with rain. To obtain an R-value by the RUSLE methodology, high resolution rainfall measurements at a small time step are required as well as accurate computation of the rainfall erosivity (EI30) of each storm. Where such data are not available, alternative procedures are suggested in the USLE and RUSLE handbooks. The present study, therefore, seeks to estimate the R-factor from more readily available types of precipitation data such as mean monthly or annual totals. In Hawaii, for example, Lo et al. (1985) found a correlation between mean annual rainfall and R. In the USA, Renard and Freimund, (1994), used both mean annual precipitation and the Modified Fournier Index (Arnoldus, 1977) to estimate the R-factor. Similar approaches have been proposed for Belgium (Bollinne et al., 1979), Bavaria
(Rogler and Schwertmann, 1981) and south-eastern Australia (Yu and Rosewell, 1996). Recently, de Santos Loureiro and de Azevedo Coutinho (2001) estimated the EI30 index, from monthly rainfall data for the south of Portugal. In the European Report on Soil Erosion in Italy, van der Knijff et al., (2000) applied a relationship, based on the mean annual precipitation, to estimate the R-factor; it was calibrated in Tuscany and extrapolated to the whole of Italy, with uncertain results as seen in the conclusions in the report.
This paper describes a new procedure for estimating the RUSLE EI30 parameter, on an annual time scale. All procedures are illustrated using rainfall data from the peninsular region of Italy with a Mediterranean rainfall regime.
Study area and available data
104
along the coastal zones, changing to almost continental conditions inland, so that a dry summer period is followed by maximum rainfall in the mid-autumn and a gradual lessening of rainfall in autumn and spring. Although there are extreme rainfall events in winter, stormy events with the highest hourly and half-hourly intensities occur between May and September (Diodato, 1999). In this study, twelve
raingauge stations in peninsular Italy, where the rainfall regime is Mediterranean, were used and five additional stations validated the results (Fig. 1). Northern Italy was excluded because the rainfall regime there is different from that elsewhere in Italy.
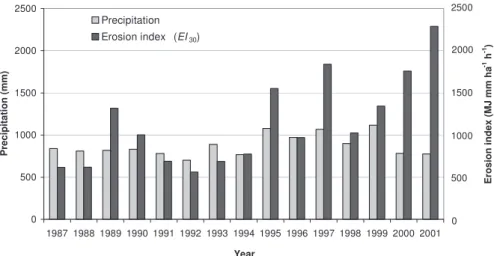
Table 1 summarises: code number, latitude, longitude, altitude and length of record, for each station. Figure 2 indicates the inter-annual variability of annual precipitation and erosion index for stations representative of peninsular Italy. The relationship between the annual rainfall and erosivity is similar only in some years; this confirms the extreme variability of rainfall patterns in Mediterranean areas (Renschler et al., 1999; Le Bissonnais et al., 2002; Renschler and Harbor, 2002), with wide and unpredictable rainfall fluctuations from year to year. Extreme rainstorm characteristics for 1989, 1995, 1997 and 19992001 differ from those for other years, although annual precipitation totals were similar in general. However, as the erosion index is not always distributed in proportion to precipitation, assessment of soil erosion hazards requires knowledge of the annual distribution of EI30.
Development of simplified methods
for evaluating the annual erosive
index
The rainfall factor R is a numerical descriptor of the ability of rainfall to erode soil (Wischmeier and Smith, 1959). For a given location, it is the long-term average of the annual Raj values which, in turn, are given by the sum of all the erosion index (EI) single-storm EI30 values for year j. The EIcalculation requires a very onerous procedure, involving the analysis of the hyetograph for every rain event >13mm over a 22-yr period (Wischmeier and Smith, 1978) and at Fig. 1. Location of the study area and positions of the raingauge
stations using for analysis (squares) and for validation (triangles).
0 500 1000 1500 2000 2500
1987 1988 1989 1990 1991 1992 1993 1994 1995 1996 1997 1998 1999 2000 2001
Year
Precipitation (mm)
Precipitation Erosion index
2500
2000
1500
1000
500
0
Erosion index (MJ mm ha
-1 h -1)
(EI30)
Estimating RUSLEs rainfall factor in the part of Italy with a Mediterranean rainfall regime
105
Table 1. Characteristics of the Italian raingauge stations used to derive the simplified relationship for estimating EI (interpolation) and of the additional stations used for testing (validation).
Raingauge Latitude Longitude Elevation Length ofRecord Network
stations Northing Easting (m) (years)
INTERPOLATION
Aliano 40° 39 16° 19 250 2 RAN
Campochiaro 41° 28 14° 32 502 8 RAN
Caprarola 42° 20 12° 11 650 8 RAN
Castel di Sangro 41° 45 14° 06 810 3 RAN
Marsciano 43° 00 12° 18 229 4 RAN
Matera 40° 39 16° 37 370 1 RAN
Monsampolo 42° 53 13° 48 43 7 RAN
Monte Pino 41° 06 14° 45 184 6 CFMI
Palo del Colle 41° 03 16° 38 191 7 RAN
Piano Cappelle 41° 07 14° 50 240 8 RAN
San Casciano 43° 40 11° 09 230 8 RAN
Santa Fista 43° 31 12° 08 311 8 RAN
VALIDATION
Libertinia 37° 33 14° 35 183 6 RAN
Montevergine 40° 56 14° 43 1270 5 CFMI
Pietranera 37° 30 13° 31 158 6 RAN
Pontecagnano 40° 37 14° 52 29 5 RAN
SantaLucia 39° 59 08° 37 14 6 RAN
RAN = Rete Agrometeorologica Nazionale
CFMI = Centro Funzionale Monitoraggio Idropluviometrico
least 6 hours distant from the previous or the following events, but including showers of at least 6.35 mm in 15minutes.
For each erosive storm between January 1994 and December 2001, data from raingauge networks operated in peninsular Italy by RAN (Rete Agrometeorologica Nazionale Ministero Politiche Agricole and Forestali) and CFMI (Centro Funzionale Monitoraggio Idropluviometrico Regione Campania), were used to compute values of EI30 according to the RUSLE handbook instructions (Renard et al., 1997). On an annual basis, the EI30 values were taken to be the summation of values over the storms in an individual year. In addition, three rainfall variables, annual precipitation (a), annual maximum daily precipitation (b) and annual maximum hourly precipitation (c) were derived from the rainfall dataset. It includes 12 stations and a total of 96 years, or 69 years after the elimination of incomplete years of data. In relation to this dataset, regression equations between the annual erosion index and different rainfall variables were computed. The results make sense, because b and c are descriptors of extreme rainfalls in storms and heavy showers, which are very erosive. The variable a, is representative of
less-erosive precipitation but its effect will be cumulative over a longer time period (one year). The use of this variable was previously suggested by FAO (1976). The power equation obtained using the data set for 69 years was:
06446annual
30 12142
.
abc .
EI (1)
where EI30-annual (in MJ mm ha1 h1) is the annual erosive
empirical index (r2 = 0.867 significant at p = 0.01); the a, b
and c variables are expressed in cm. The application of Eqn. (1) requires knowledge of only three annual variables, that are reported in Italian Idrographic Service newsletters.
So that average annual total of the storm EI values (R-factor) may be computed as:
¦
N
1
annual 30 N
1
EI
R (2)
precipitation is large, as mentioned by Renard et al. (1997) in Agriculture Handbook No. 703.
Validation of the
EI
30-annual
with a new
data set and critical examination
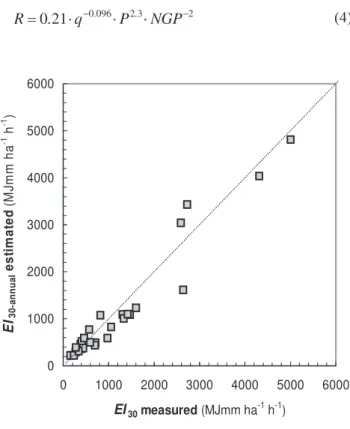
To examine whether Eqn. (1), calibrated on Italian peninsular data, can be applied to a larger area, five additional stations were considered. A further test of the EI30-annual model was made using data from research stations at S. Lucia in Sardinia, Libertinia and Pietranera in Sicily, Pontecagnano on the coast and Montevergine in the Apennines of the Campania. The reduced major-axis regression lines for erosion index show 1:1 relationships between measured and estimated values (Fig. 3). In addition, for each additional raingauge station, the applicability of the equations derived from data from other areas was tested by comparing R-factor values measured with those estimated. For this purpose, three relationships, developed elsewhere were applied:
¦
12 1 m 1010 8892
05 7 N 1 days . rain . R (3)
(de Santos Loureiro and de Azevedo Couthino, 2001), where rain10 is monthly rainfall >10 mm, and days10 is monthly number of days with rainfall >10 mm;
2 3 2 096 0 21
0. q P NGP
R . . (4)
(DAsaro and Santoro, 1983), where q is the elevation of the station, P is average annual precipitation in mm and NGP is average annual number of days with rainfall;
61 1 0483
0. P.
R (5)
(Renard and Freimund, 1994).
The performance of the four different algorithms (Eqns. 2, 3, 4 and 5) was assessed by the difference between the estimated value (R) and the corresponding measured (R*) one is the experimental error (µ):
i i i R R
*
(6)
Mean Absolute Errors:
¦
n
i i
n 1
1
MAE (7)
Root Mean Square Errors:
¦
n i i n 1 2 1
RMSE (8)
where n is the number of locations subjected to validation. The results are listed in Table 2. Statistics of the experimental errors are reported in Table 3. The very largest errors are produced by Eqn.(5). Large errors are generated by Eqns. (3) and (4). The best results are generally obtained using EI30-annual model (Eqn. 2). There is clearly a significant improvement in the estimation performance when taking into account descriptors of the extreme rainfall (b and c variables of the Eqn. (2): the MAE decreases from 664 551 MJmm ha1 h1 (Eqns. 3 and 4) to 133 MJmm ha1 h1
(Eqn. 2). These tests indicate that the new procedure can give reasonable results in conditions ranging from the Mediterranean climate of southern Europe.
Conclusion
A simplified relationship for estimating the erosion index EI in the Mediterranean area, using rainfall data from 12 peninsular Italian locations (each with eight years record) is proposed. Data from five additional stations in the islands of Sicily and Sardinia and south Italy were used to validate the relationship. It was established that the relationship
0 1000 2000 3000 4000 5000 6000
0 1000 2000 3000 4000 5000 6000 EI30 measured (MJmm ha
-1 h-1)
EI 3 0 -a nnua l es ti m at e d (M J m m h a
-1 h -1 )
Fig. 3. Scatter diagram between erosion index measured (RUSLE methodology) and estimated value (Eqn. 2) at the validation stations
Table 3. Statistics of the experimental errors (MJ mm ha-1 h-1)
computed from average annual rainfall erosivity 5-data locations (see Table 2)
Equation 2 34 5
MAE 133 551 664 1273
Estimating RUSLEs rainfall factor in the part of Italy with a Mediterranean rainfall regime
between the annual erosivity EI30 and corresponding rainfall
parameters can be expressed in a potential form. A regional relationship for estimating the erosion index as a function of three rainfall variables was also developed and tested. In many cases, monthly or annual rainfall amounts are not representative of an erosion index; therefore, grouping three rainfall variables on various time scales has been shown to be more successful in reproducing the annual amount of erosion.
References
Arnoldus, H.M.J., 1977. Methodology used to determine the maximum potential average soil loss due to sheet and rill erosion in Marocco. Assessing Soil Degradation. FAO Soils Bulletin, 34, 89.
Bollinne, A., Laurant, A. and Boon, W., 1979. Lérosivité des précipitations a Florennes. Révision de la carte des isohyétes et de la carte derosivite de la Belgique. Bull. Soc. Géogr. Liége, 15, 7799.
DAsaro, F. and Santoro, M., 1983. Aggressività della pioggia nello studio dellerosione idrica del territorio siciliano. CNR, Progetto Finalizzato: Conservazione del suolo, Sottoprogetto: Dinamica dei Versanti. Pub. 130.
de Santos Loureiro, N. and de Azevedo Couthino, M., 2001. A new procedure to estimate the RUSLE EI30 index, based on monthly rainfall data applied to the Algarve region, Portugal. J. Hydrol., 250, 1218.
Diodato, N., 1999. Impatto delluso agricolo del suolo sullinstabilità geomorfologica dei paesaggi in provincia di Benevento. La Provincia Sannita Ente Provincia di Benevento 3, 18.
FAO, 1976. A framework for land evaluation. FAO Soils Bulletin 32. FAO Rome and Inst. Land Reclam. Improv. Pub. 22. Kosmas, C., Danalatos, N., Cammeraat, L.H., Chabart, M.,
Diamanopoulos, J., Farand, R., Gutierrez, L., Jacob, A., Marques, H., Martinez-Fernandez, J., Mizara, A., Moustakas, N., Nicolau, J.M., Oliveros, C., Pinna, G., Puddu, R., Puigdefabregas, J., Roxo, M., Simao, A., Stamou, G., Tomasi, N., Usai, D. and Vacca, A., 1997. The effect of land use on runoff and soil erosion rates under Mediterranean conditions. Catena,29, 4559.
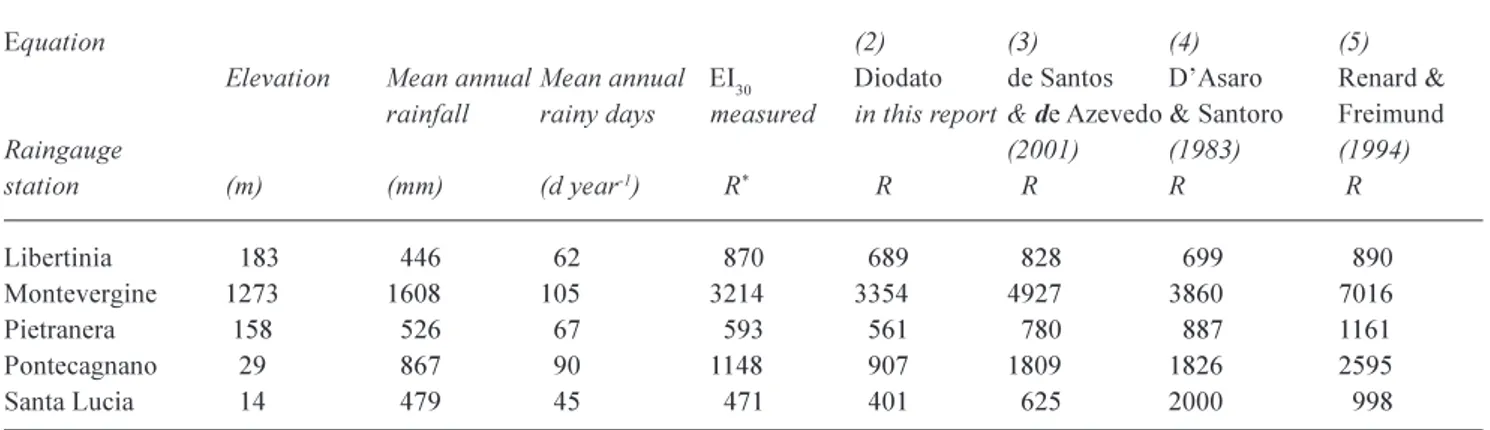
Table 2. Comparison between EI30 (R-factor in MJ mm ha1 h1) measured values (RUSLE methodology) and estimated values by several
authors, in 19941999 year period.
Equation (2) (3) (4) (5)
Elevation Mean annual Mean annual EI30 Diodato de Santos DAsaro Renard & rainfall rainy days measured in this report & de Azevedo & Santoro Freimund
Raingauge (2001) (1983) (1994)
station (m) (mm) (d year-1) R* R R R R
Libertinia 183 446 62 870 689 828 699 890
Montevergine 1273 1608 105 3214 3354 4927 3860 7016
Pietranera 158 526 67 593 561 780 887 1161
Pontecagnano 29 867 90 1148 907 1809 1826 2595
Santa Lucia 14 479 45 471 401 625 2000 998
Le Bissonnais, Y., Montier, C., Jamagne, M., Daroussin, J. and King, D., 2002. Mapping erosion risk for cultivated soil in France. Catena,46, 207220.
Lo, A., El-Swaify, S.A., Dangler E.W. and Shinshiro, L., 1985. Effectiveness of EI
30 as an erosivity index in Hawaii. In : Soil
erosion and conservation, S. A. El- Swaify, W. C. Moldenhauer and A. Lo (Eds.) Soil Conservation Society of America, Ankeny, 384392.Renard K. G. and Freimund J. R. 1994. Using monthly precipitation data to estimate the R-factor in the revised USLE. J. Hydrol.,157, 287306.
Renard, K.G., Foster, G.R., Weesies, G.A., McCool, D.K. and Yoder, D.C., 1997. Predicting soil erosion by water: a guide to conservation planning with the revised Universal Soil Loss Equation (RUSLE). USDA Agricultural Handbook 703, 384pp. Renschler, C. and Harbor, J., 2002. Soil erosion assessment tools from point to regional scales the role of geomorphologists in land management research and implementation. Geomorphology,47, 189209.
Renschler, C.S., Mannaerts, C. and Diekkruger, B., 1999. Evaluating spatial and temporal variability in soil erosion risk-rainfall erosivity and soil loss ratios in Andalusia, Spain. Catena, 34, 209225.
Rogler, H. and Schwertmann, U., 1981. Erosivitat der Niederschlage un Isoerodenkarte Bayerns. Zeitschrift fur Kulturtechnik und Flurbereiningung 22, 99112.
van der Knijff J. M., Jones R.J.A. and Montanarella L., 2000. Soil erosion risk assessment in Italy. European Commission European Soil Bureau. 52pp.
Wischmeier, W.H. and Smith, D.D., 1959. A rainfall erosion index for a universal soil loss equation. Soil Sci. Soc. Amer. Proc., 23, 246249.
Wischmeier W.H. and Smith D.D., 1978. Predicting rainfall erosion losses. Admin. U.S. Dept. Agr. Washington, D.C.: Agriculture Hand-book. Sci. And Educ. 357. 58pp.