Revista Brasileira de
Engenharia Agrícola e Ambiental
Campina Grande, PB, UAEA/UFCG – http://www.agriambi.com.br
v.22, n.12, p.849-853, 2018
Rainfall pattern and erosion potential in the physiographic regions
of the state of Pernambuco, Brazil
DOI: http://dx.doi.org/10.1590/1807-1929/agriambi.v22n12p849-853
Antonio G. Pinheiro
1, Thais E. M. dos S. Souza
2, Suzana M. G. L. Montenegro
3,
Abelardo A. de A. Montenegro
1& Sérgio M. S. Guerra
4A B S T R A C T
The objective of the present study was to characterize the spatial and temporal (2000-2015) rainfall pattern variability and erosive potential in the different physiographic regions of the state of Pernambuco, Brazil. Rainfall data series (3 to 12 years) from 25 weather stations of the state were analyzed. Erosive rainfall events (more than 10 mm depth) were considered to evaluate the annual erosivity index, monthly erosivity index (EI30), rainfall erosivity factor (R), and rainfall pattern. The inverse distance weighting (IDW) - inverse of the square of the distance - was used to create spatial interpolation and develop maps. The rainfall data from the weather stations showed average annual rainfall of 827 mm and average erosivity of 4,784 MJ mm ha-1 h-1. The Metropolitan region of Pernambuco presented the highest
rainfall erosivity index, with annual average of 9,704 MJ mm ha-1 h-1; and the Sertão do São
Francisco region had the lowest, with annual average of 4,902 MJ mm ha-1 h-1. The state of
Pernambuco presented advanced (42%), intermediate (38%), and delayed (20%) rainfall patterns.
Características e potencial erosivo das chuvas para
as zonas fisiográficas do estado de Pernambuco
R E S U M O
O presente estudo foi realizado com o objetivo de caracterizar a variabilidade espacial e temporal (2000-2015) do padrão hidrológico e do potencial erosivo das chuvas para as diferentes zonas fisiográficas do estado de Pernambuco. Foram analisadas as séries de chuvas (com variação de 3 a 12 anos) de 25 estações pluviográficas localizadas no estado. A partir da separação dos eventos em chuva individual e erosiva (maiores que 10 mm), foram avaliados o índice de erosividade (EI30) mensal e anual, o fator de erosividade da chuva (R) e a caracterização do padrão hidrológico das chuvas. Utilizou-se o método do inverso do quadrado da distância (IDW) para a superfície de interpolação e geração dos mapas. As estações estudadas apresentaram precipitação média anual de 827 mm e erosividade média de 4.784 MJ mm ha-1 h-1. A Mesorregião Metropolitana apresentou o maior índice
de erosividade da chuva, com média anual de 9.704 MJ mm ha-1 h-1, e a Mesorregião do
Sertão do São Francisco o menor, com média anual de 4.902 MJ mm ha-1 h-1. Para o estado
de Pernambuco, o padrão hidrológico de maior ocorrência foi o avançado, seguido do intermediário e do atrasado com 42, 38, e 20%, respectivamente.
Key words:
erosivity mapping
rainfall characterization precipitation
Palavras-chave:
erosividade mapeamento
características das chuvas precipitação
1 Universidade Federal Rural de Pernambuco/Departamento de Engenharia Agrícola/Programa de Pós-Graduação em Engenharia Agrícola. Recife, PE.
E-mail: [email protected] (Corresponding author) - ORCID: 0000-0002-5912-6906; [email protected] - ORCID: 0000-0002-5746-8574
2 Universidade Federal de Pernambuco/Centro de Biociências/Departamento de Biofísica e Radiobiologia. Recife, PE. E-mail: [email protected] -
ORCID: 0000-0003-4768-5839
3 Universidade Federal de Pernambuco/Centro de Tecnologia e Geociências/Departamento de Engenharia Civil. Recife, PE. E-mail: [email protected] -
ORCID: 0000-0002-2520-5761
4 Universidade Federal Rural de Pernambuco/Departamento de Tecnologia Rural/Programa de Pós-Graduação em Engenharia Ambiental. Recife, PE.
E-mail: [email protected] - ORCID: 0000-0001-9205-7044
Introduction
Rainfall is the main factor that affects soil erosion, it can damage agricultural lands due to nutrient losses, and cause serious problems for agricultural activities, and water pollution (Eltz et al., 2013; Moreno et al., 2014).
Estimating the rainfall erosivity factor (R) of the universal soil loss equation (USLE) requires the calculation of the rainfall erosivity index (EI30), which is the product from two specific parameters of erosive precipitations in a location: total kinetic energy of the rainfall (E), and maximum intensity of rainfall in 30 min (I30).
Several studies have estimated EI30 for different regions and environments (Oliveira et al., 2012; Santos & Montenegro, 2012; Amaral et al., 2014; Moreno et al., 2014; Isikwue et al., 2015; Panagos et al., 2016). Oliveira et al. (2012) reviewed the rainfall erosivity in Brazil and reported values of 1,672 to 22,452 MJ mm ha-1 h-1.
The physiographic regions of the state of Pernambuco present high rainfall variability, with climate varying from humid (‘Zona da Mata’, and Coastal) to hot semiarid (‘Sertão’) (Cantalice et al., 2009).
Little spatial and temporal information for the calculation of erosivity index is found in Brazil, hindering studies on these parameters in several regions of the country, since they require high-resolution long-period continuous rainfall data (Trindade et al., 2016).
The Northeast region of Brazil presents the lowest rainfall rates of the country; however, rainfall is the main water source for agriculture in this region.
Cantalice et al. (2009) developed a first approximation of isoerodent maps for the state of Pernambuco, using historical data series from 5 to 11 years collected by 11 weather stations. The objective of the present study was to improve the information on rainfall spatial distribution, rainfall erosivity index (EI30), and rainfall pattern of the state of Pernambuco, Brazil, by characterizing the rainfall spatial variability and erosion potential, and estimate the rainfall patterns of the different regions of this state.
Material and Methods
The study was conducted using rainfall data series (2000 to 2015) of 25 municipalities of the state of Pernambuco, Brazil, from 25 weather stations in the different regions of the state - 14 weather stations of the Pernambuco Water and Climate Agency (APAC), and 11 weather stations of the Superintendency for the Development of the Northeast (SUDENE). The weather stations were between the coordinates 7.33 and 9.48 °S, and 34.50 and 41.35 °W.
The rainfall data of the municipalities were from different time series, since the maximum rainfall information available from each weather station were used, due to the lack of data in some periods.
The physiographic regions of Pernambuco are Metropolitan, ‘Zona da Mata’, ‘Agreste’, ‘Sertão’, and ‘Sertão de São Francisco’. The data were acquired from the weather stations of Ipojuca (2005 to 2007), Olinda (2006 to 2009) and Recife (2005 to
2008) for the Metropolitan region; Barreiros (2006 to 2012), Carpina (2006 to 2010), Goiana (2004 to 2011), Palmares (2002 to 2009) and Vitória de Santo Antão (2005 to 2010) for the ‘Zona da Mata’ region.
Brejão (2004 to 2011), Caruaru (2000 to 2011), Pesqueira (2012 to 2015), São Bento do Uma (2004 to 2015) and Vertentes (2003 to 2010) for the ‘Agreste’ region.
Araripina (2001 to 2009), Arcoverde (2000 to o2013), Ibimirim (2000 to 2011), Ouricuri (2002 to 2010), Salgueiro (2006 to 2012), São João do Egito (2003 to 2011), Serra Talhada (2000 to 2011) and Sertânia (2005 to 2010) for the ‘Sertão’ region. Belém de São Francisco (2006 to 2011), Floresta (2005 to 2011), Petrolina (2005 to 2013) and Santa Maria da Boa Vista (2003 to 2010) for the ‘Sertão de São Francisco’ region.
The erosivity index was determined based on the mathematical model proposed by Wischmeier & Smith (1958). The kinetic energy for each rainfall was calculated using the equation used by Foster et al. (1981):
KE=0 119 0 0873. + . log , when I I≤76 mm h-1
KE=0.283, when I>76 mm h-1
where:
KE - kinetic energy per mm of rainfall, MJ ha-1 mm-1; and, I - rainfall intensity, mm h-1.
The result from the Eq. 1 and 2 was multiplied by the precipitated water depth of each rainfall event to obtain the kinetic energy by increment of rainfall depth, the sum of all values for the same precipitation event was calculated to determine the total kinetic energy (KE) of the rainfall event with more than 10 mm.
The erosivity index (EI30) (MJ mm ha-1 h-1) was evaluated considering the maximum precipitated water depth in 30 min for each rainfall event and the maximum rainfall intensity in 30 min (I30), using the equation used by Carvalho et al. (2005):
EI30=KE I30
The sum of the EI30 of each precipitation event was used to determine the monthly, and annual indexes for each evaluated location. The results were classified according to the classes proposed by Carvalho (2008).
The rainfall patterns of the analyzed erosive rainfalls were determined following the classification proposed by Horner & Jens (1942), which classifies them as advanced, intermediate, or delayed.
According to this classification, rainfalls with advanced, intermediate, and delayed patterns have the highest intensity occurring in the first, second, and last third of its total duration time, respectively.
The coefficient of rainfall was calculated using the method proposed by Founier (1960) and modified by Lombardi Neto & Moldenhauer (1992) through the Eq. 4:
R Pm
Pa
c =
2
(1)
(2)
(3)
where:
Rc - coefficient of rainfall, mm;
Pm - average monthly precipitation, mm; and, Pa - average annual precipitation, mm.
Thematic maps of pluviometry and EI30 for the state of Pernambuco were developed using the ArcGis 10.2. The inverse distance weighting (IDW) method was used for the spatial interpolation.
The IDW interpolation method considers a local effect for each geographical point, which decreases with the distance. The exponent in the IDW controls the importance of the surrounding points to the interpolated point. High exponents result in less effect from distant points.
The analysis consisted of correlations between precipitation and erosivity, and between erosivity and rainfall coefficient (Rc), and descriptive statistics - mean, minimum, maximum, standard deviation, and coefficient of variation.
Results and Discussion
The rainfall depths and erosivity index in 30 min (EI30) had significant variation between weather stations. The rainfall depths had mean coefficient of variation (CV) of 49.5% and mean standard deviations (SD) of 409.0, and EI30 had CV of 52.6% and SD of 2.517.9.
The geomorphic characteristics of the state of Pernambuco affect the rainfall regime. This state presents great physiographic heterogeneity, thus, studies including all its regions are necessary.
Barbosa et al. (2014) found irregular spatial rainfall distribution in the Northeast region of Brazil, showing rainfall concentrated in specific areas in some months. The concentrations of these rainfalls may affect their erosive potential.
The results of rainfall depth variability and erosivity index for the state of Pernambuco were similar those found in other studies in the Semiarid region of Brazil using different scales but with similar objectives, such as those conducted in Ipojuca, Pernambuco (Duarte et al., 2015), in the state of Paraíba (Medeiros et al., 2015), and in Castelo, and Juazeiro, in Piauí (Santos & Aquino, 2015). These authors reported that almost all the Northeast region of Brazil present a rainy season between March to July, with a long period of drought in the other months.
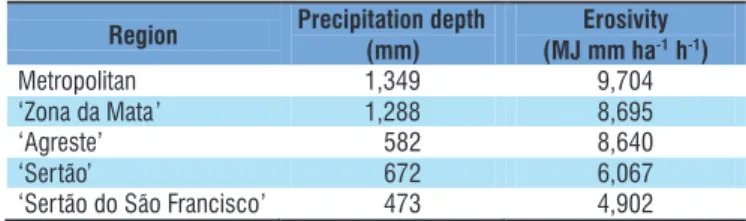
The Metropolitan, and ‘Zona da Mata’ regions presented the highest precipitations due to their proximity to the Atlantic Ocean. According to Nóbrega & Santiago (2014), the Atlantic Ocean affects the precipitation in the Brazilian Northeast, which are more intense in coastal regions (Table 1).
The average annual erosivity in the different regions of the state of Pernambuco had variation proportional to the total precipitation, decreasing toward the West from the Metropolitan to the ‘Sertão do São Francisco’ region.
Therefore, the greater the proximity to the Atlantic Ocean the greater the average erosivity index. This is explained by the difference between the warming of the ocean and the continent. This difference in temperature causes the air to carry moisture
and heat to the continent, increasing precipitation and erosivity along the coast (Rebiota et al., 2010). Waltrick et al. (2015) also observed this phenomenon in the state of Paraná, Brazil, in which the highest mean annual erosivity was found in the coastal region.
The Metropolitan region presented strong erosivity and the ‘Sertão do São Francisco’ presented moderate erosivity. This information is important for the maintenance of the environmental balance of each region, since the removal of the vegetation cover combined with climate, relief, and soil type can cause serious problems of difficult recovery.
May and June are the months with the greatest risks of erosivity in the Metropolitan region, together they comprise approximately 34%, of the annual erosion potential of the region. This is explained by the high mean precipitation in these months. This region presented low risks of erosivity in September and October, with 1.2% of the annual erosive potential.
The Metropolitan region has the highest number of months - February, March, April, May, June, and July - presenting critical erosivity according to Rufino (1986), which were above 500 MJ mm ha-1 h-1. Lower erosivity were recorded in the ‘Zona da Mata’, ‘Agreste’, ‘Sertão’, and ‘Sertão de São Francisco’ regions. Critical erosivity was found in the ‘Agreste’ region in March, and in the ‘Sertão’, and ‘Sertão do São Francisco’ regions in February, March, and April. This is explained by the highest rainfall depths in these months in these regions.
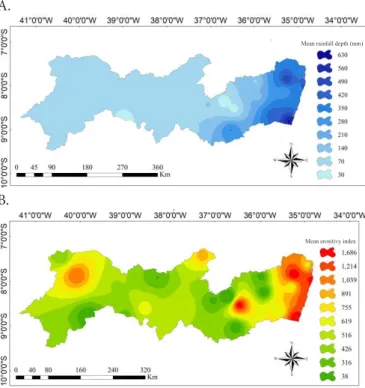
The regions near the Atlantic Ocean presented the highest rainfall values (Figure 1A). The lowest average precipitation depth for the first half of the years 2000 to 2015 was 141 mm, and the highest was 1,111 mm.
The ‘Sertão’ and ‘Agreste’ regions presented the lowest mean rainfall depths. The lowest mean erosivity index (887 MJ mm ha-1 h-1) was found in the municipality of Pesqueira, and the highest (10,310 MJ mm ha-1 h-1) in Recife (Figure 1B). The EI30 was proportional to the rainfall depths.
The second half of the years had the highest mean precipitation depth in Pernambuco (640 mm), which was 57.6% higher than that of the first half of the evaluated years (Figure 2A). The rainfall depths throughout the year were higher in regions near the Atlantic Ocean, and lower in the ‘Sertão’, and ‘Agreste’ regions.
The lowest mean precipitation depth in the second half of the years was 30 mm (Figure 2A), which probably caused low erosivity. According to Trindade et al. (2016), erosivity is dependent on the rainfall index; low rainfall indexes reduce the risks of soil losses caused by erosivity. The higher the erosivity index, the greater the effects on soil wetting patterns, thus, the higher the soil losses (Montenegro et al., 2018)
Table 1. Mean annual precipitation and erosivity in the different regions of the state of Pernambuco, Brazil
Region Precipitation depth
(mm)
Erosivity (MJ mm ha-1h-1)
Metropolitan 1,349 9,704
‘Zona da Mata’ 1,288 8,695
‘Agreste’ 582 8,640
‘Sertão’ 672 6,067
Rainfall depths and EI30 presented a significant correlation (R2 = 0.97), denoting a high dependence of the erosivity index on the rainfall depths, i.e., sites with high rainfall depths will probably present high erosivity (Figure 3A).
Erosivity index, and coefficient of rainfall presented significant correlation (R² = 0.91) (Figure 3B). This significance makes easier estimating data for non-sampled areas, enabling studies in large areas.
The most frequent rainfall pattern in the state of Pernambuco was advanced (42%), followed by intermediate (38%), and delayed (20%) (Figure 4). Similar results were found by Eltz et al. (2013) in São Gabriel RS, Brazil, and Santos & Montenegro (2012) in the ‘Agreste’ region of Pernambuco. This characteristic is positive for soil conservation, because it makes the soil less moist and with better conditions for rainfall infiltration.
Rainfalls with advanced pattern are predominant in the state, resulting in lower risks of soil losses due to precipitations (Figure 4). This is explained by the low moisture content that precedes the occurrence of rainfall peaks (Eltz et al., 2013; Montenegro et al., 2013).
Figure 1. Spatial distribution of mean rainfall depth (mm) (A) and mean erosivity index (EI30) (MJ mm ha-1 h-1) (B)
for the state of Pernambuco, Brazil, in the first half of the years 2000 to 2015
A.
B.
Figure 2. Spatial distribution of mean rainfall depth (mm) (A) and mean erosivity index (EI30) (MJ mm ha-1 h-1) (B) in
the state of Pernambuco, Brazil, in the second half of the years 2000 to 2015
A.
B.
The erosivity in the regions in the second half of the years was proportional to the rainfall and had lower magnitude than that of the first half (Figure 2B). The highestmean erosivity in the second half of the years was 1,686 MJ mm ha-1 h-1, representing 16.3% of the maximum mean erosivity of the first half of the years. Therefore, the second half of the years has lower risks of soil losses because of the rainfall depths in this period (Figure 2B).
Figure 3. Correlation between mean erosivity index and rainfall depth (A) and correlation between mean erosivity index and coefficient of rainfall (B) for the state of Pernambuco, Brazil
B. A.
Figure 4. Mean rainfall pattern in municipalities of the state of Pernambuco, Brazil
Mean rainfall depth (mm)
Mean erositivy index
Mean rainfall depth (mm)
Mean erositivy index
Conclusions
1. The rainfall erosive potentials were proportional to the rainfall depths recorded by weather stations of the state of Pernambuco, Brazil.
2. The data from the weather stations of the Metropolitan region of Pernambuco presented the highest erosivity index, denoting the need for soil conservation practices in this region.
3. The most frequent rainfall pattern in the state of Pernambuco was the advanced, which contributes to the greater infiltration of water because of the low soil moisture before rainfall events.
Acknowledgements
The authors thank the Coordenação de Aperfeiçoamento de Pessoal de Nível Superior (CAPES) for granting scholarships, and the Superintendência do Desenvolvimento do Nordeste (SUDENE) and the Agência Pernambucana de Águas e Clima (APAC) for providing climatological data.
Literature Cited
Amaral, B. S. D. do; Dantas, J. C.; Silva, R. M. da; Carvalho Neto, J. F. de. Variabilidade espacial da erosividade das chuvas no estado da Paraíba. Revista Brasileira de Geografia Física, v.7, p.691-701, 2014.
Barbosa, N. F. M.; Stosic, B. D.; Stosic, T.; Lopes, P. M. O.; Moura, G. B. de A.; Melo, J. S. P. Kernel smoothing dos dados de chuvas do Nordeste. Revista Brasileira de Engenharia Agrícola e Ambiental, v.18, p.742-747, 2014. https://doi.org/10.1590/S1415-43662014000700011
Cantalice, J. R.; Bezerra, S. A.; Filgueira, S. B.; Inácio, E. S. B.; Silva, M. D. O. Linhas isoerosivas do estado de Pernambuco – 1ª Aproximação. Revista Caatinga, v.22, p.75-80, 2009.
Carvalho, D. F. de; Montebeller, C. A.; Franco, E. M.; Valcarcel, R.; Bertol, I. Padrões de precipitação e índices de erosividade para as chuvas de Seropédica e Nova Friburgo - RJ. Revista Brasileira de Engenharia Agrícola e Ambiental, v.9, p.7-14, 2005. https:// doi.org/10.1590/S1415-43662005000100002
Carvalho, N. de O. Hidrossedimentologia prática. 2.ed. Rio de Janeiro: Interciência, 2008. 599p.
Duarte, C. C.; Nóbrega, R. S.; Coutinho, R. Q. Análise climatológica e dos eventos extremos de chuvas no município de Ipojuca, Pernambuco. Revista de Geografia, v.32, p.158-176, 2015. Eltz, F. L. F.; Cassol, E. A.; Pascotini, P. B.; Amorim, R. S. S. Potencial
erosivo e características das chuvas de São Gabriel, RS, de 1963 a 1993. Revista Brasileira de Engenharia Agrícola e Ambiental, v.17, p.647-654, 2013. https://doi.org/10.1590/S1415-43662013000600011 Foster, G. R.; McCool, D. K.; Renard, K. G.; Moldenhauer, W. C.
Conversion of the universal soil loss equation to SI metric units. Journal of Soil and Water Conservation, v.36, p.355-359, 1981. Founier, F. Climat et erosion. Paris: Press Universitaries de France,
1960. 201p.
Horner, W. W.; Jens, S. W. Surface runoff determination from rainfall without using coefficients. Transactions of the American Society of Civil Engineers, v.107, p.1039-1117, 1942.
Isikwue, M. O.; Ocheme, J. E.; Aho, M. I. Evaluation of rainfall erosivity index for Abuja, Nigeria using Lombardi Method. Nigerian Journal of Technology, v.34, p.56-63, 2015. https://doi. org/10.4314/njt.v34i1.7
Lombardi Neto, F.; Moldenhauer, W. C. Erosividade da chuva: Sua distribuição e relação com as perdas do solo em Campinas (SP). Bragantia, v.51, p.189-196, 1992. https://doi.org/10.1590/S0006-87051992000200009
Medeiros, R. M.; Megna, F. P. R.; Santos, D. Balanço hídrico e erosividade em função das mudanças climáticas no estado da Paraíba. Revista Brasileira de Geografia Física, v.8, p.1068-1084, 2015. https://doi.org/10.5935/1984-2295.20150054
Montenegro, A. A. A.; Lima, J. L. M. P. de; Abrantes, J. R. C. de B. O.; Santos, T. E. M. dos. Impact of mulching on soil and water conservation in semiarid catchment: Simulated rainfall in the field and in the laboratory. Die Bodenkultur, v.64, p.79-85, 2013. Montenegro, A. A. A.; Souza, T. E. M. S.; Souza, E. R. de; Montenegro, S. M. G. L. T. Temporal dynamics of soil moisture and rainfall erosivity in a tropical volcanic archipelago. Journal of Hidrology, v.263, p.737-749, 2018. https://doi.org/10.1016/j. jhydrol.2018.06.047
Moreno, R. F. S.; Mannaerts, C. M.; Jetten, V. Rainfall erosivity mapping for Santiago Island, Cape Verde. Geoderma, v.217-218, p.74-82, 2014. https://doi.org/10.1016/j.geoderma.2013.10.026 Nóbrega, R. S.; Santiago, G. A. C. F. Tendência de temperatura na
superfície do mar nos oceanos Atlântico e Pacífico e variabilidade de precipitação em Pernambuco. Mercator, v.13, p.107-118, 2014. https://doi.org/10.4215/RM2014.1301.0008
Oliveira, P. T. S.; Wendland, E.; Nearing, M. A. Rainfall erosivity in Brazil: A review. Catena, v.100, p.139-147, 2012. https://doi. org/10.1016/j.catena.2012.08.006
Panagos, P.; Ballabio, C.; Borrelli, P.; Meusburger, K. Spatio-temporal analysis of rainfall erosivity and erosivity density in Greece. Catena, v.137, p.161-172, 2016. https://doi.org/10.1016/j. catena.2015.09.015
Rebiota, M. S.; Gan, M. A.; Rocha, R. P.; Ambrizi, T. Regimes de precipitação na América do Sul: Uma revisão bibliográfica. Revista Brasileira de Meteorologia, v.25, p.185-204, 2010. https://doi. org/10.1590/S0102-77862010000200004
Rufino, R. L. Avaliação do potencial erosivo da chuva para o estado do Paraná: Segunda aproximação. Revista Brasileira de Ciência
do Solo,v.10, p.279-281, 1986.
Santos, F. A. dos; Aquino, C. M. S. de. Erosividade das chuvas (R) nos municípios de Castelo do Piauí, no estado do Piauí (Brasil). Revista Eletrônica do Curso de Geografia, v.25, p.57-71, 2015. Santos, T. E. M. dos; Montenegro, A. A. A. Erosividade e padrões
hidrológicos de precipitação no Agreste Central pernambucano. Revista Brasileira de Engenharia Agrícola e Ambiental, v.16, p.871-880, 2012. https://doi.org/10.1590/S1415-43662012000800009 Trindade, A. L. F.; Oliveira, P. T. S. de; Anache, J. A. A.; Wendland,
E. Variabilidade espacial da erosividade das chuvas no Brasil. Pesquisa Agropecuária Brasileira, v.15, p.1918-1928, 2016. https:// doi.org/10.1590/s0100-204x2016001200002
Waltrick, P. C.; Machado, M. A. de M.; Dieckow, J.; Oliveira, D. de. Estimativa da erosividade de chuvas no estado do Paraná pelo método da pluviometria: Atualização com dados de 1986 a 2006. Revista Brasileira de Ciência do Solo, v.39, p.256-267, 2015. https://doi.org/10.1590/01000683rbcs20150147
Wischmeier, W. H.; Smith, D. D. Rainfall energy and its relationship
to soil loss. Transaction American Geophysical Union,v.39,