www.atmos-chem-phys.net/17/595/2017/ doi:10.5194/acp-17-595-2017
© Author(s) 2017. CC Attribution 3.0 License.
The G4Foam Experiment: global climate impacts of regional
ocean albedo modification
Corey J. Gabriel1, Alan Robock1, Lili Xia1, Brian Zambri1, and Ben Kravitz2 1Department of Environmental Sciences, Rutgers University, New Brunswick, NJ, USA
2Atmospheric Sciences and Global Change Division, Pacific Northwest National Laboratory, Richland, Washington, USA
Correspondence to:Corey J. Gabriel ([email protected])
Received: 29 September 2016 – Published in Atmos. Chem. Phys. Discuss.: 5 October 2016 Revised: 1 December 2016 – Accepted: 22 December 2016 – Published: 12 January 2017
Abstract.Reducing insolation has been proposed as a geo-engineering response to global warming. Here we present the results of climate model simulations of a unique Geo-engineering Model Intercomparison Project Testbed experi-ment to investigate the benefits and risks of a scheme that would brighten certain oceanic regions. The National Center for Atmospheric Research CESM CAM4-Chem global cli-mate model was modified to simulate a scheme in which the albedo of the ocean surface is increased over the subtropical ocean gyres in the Southern Hemisphere. In theory, this could be accomplished using a stable, nondispersive foam, com-prised of tiny, highly reflective microbubbles. Such a foam has been developed under idealized conditions, although de-ployment at a large scale is presently infeasible. We con-ducted three ensemble members of a simulation (G4Foam) from 2020 through to 2069 in which the albedo of the ocean surface is set to 0.15 (an increase of 150 %) over the three subtropical ocean gyres in the Southern Hemisphere, against a background of the RCP6.0 (representative concentration pathway resulting in +6 W m−2radiative forcing by 2100)
scenario. After 2069, geoengineering is ceased, and the sim-ulation is run for an additional 20 years. Global mean surface temperature in G4Foam is 0.6 K lower than RCP6.0, with statistically significant cooling relative to RCP6.0 south of 30◦
N. There is an increase in rainfall over land, most pro-nouncedly in the tropics during the June–July–August sea-son, relative to both G4SSA (specified stratospheric aerosols) and RCP6.0. Heavily populated and highly cultivated regions throughout the tropics, including the Sahel, southern Asia, the Maritime Continent, Central America, and much of the Amazon experience a statistically significant increase in pre-cipitation minus evaporation. The temperature response to
the relatively modest global average forcing of−1.5 W m−2 is amplified through a series of positive cloud feedbacks, in which more shortwave radiation is reflected. The precipita-tion response is primarily the result of the intensificaprecipita-tion of the southern Hadley cell, as its mean position migrates north-ward and away from the Equator in response to the asymmet-ric cooling.
1 Introduction 1.1 Background
Figure 1.Applied forcing and global mean temperature response. Ocean albedo changed from a daily average of 0.06, which includes a very small daily cycle, to a fixed value of 0.15 with no daily cycle, over “foam regions”, 20◦N–20◦S, 90–170◦W (South Pacific Ocean), 20◦N–20◦S, 30◦W–0◦E (South Atlantic Ocean) and 20◦N–20◦S, 55–105◦E (South Indian Ocean). Each foamed region is outlined in black. Control-run sea-level pressure (mb) is shown with contours and 10 m winds (m s−1) are shaded.
each comes with known potential side effects. For example, Robock (2008, 2014, 2016) enumerated and described spe-cific risks and benefits of stratospheric geoengineering.
Here we present a Geoengineering Model intercomparison Project (GeoMIP) Testbed experiment (Kravitz et al., 2011, 2015), consisting of the novel implementation of an ocean surface albedo modification scheme in a climate model, which simulates the placement of a reflective foam, con-sisting of microbubbles, on the ocean surface. RCP6.0 and G4SSA are run with an ocean surface albedo with a very small diurnal cycle, and the daily average albedo is very close to 0.06. In our experiment, the albedo of the ocean surface is raised from this daily mean of 0.06 to a constant value of 0.15, with no daily cycle, over the subtropical ocean gyres in the Southern Hemisphere, specifically 20◦
N–20◦ S, 90–170◦
W (South Pacific Ocean), 20◦ N–20◦
S, 30◦ W–0◦
E (South Atlantic Ocean) and 20◦
N–20◦
S, 55–105◦
E (South Indian Ocean; Fig. 1). Everywhere else, ocean surface albedo in G4Foam is calculated in the same way as in RCP6.0 and G4SSA. It is possible that the absence of a small daily cy-cle in albedo would result in a slightly different surface en-ergy budget than would occur if the foamed regions exhibited variations in albedo. However, the foamed regions’ albedos would likely fluctuate as a function of many things, includ-ing some movement of the foam itself, foam interaction with
precipitation or aerosols, wind speed, and sun angle. Further study of the properties of the foam, including in ocean water with some turbulence, could provide information that would allow future modeling of the foam to include albedo fluctua-tions. This is the G4Foam experiment, which simulates a par-ticular implementation of an idealized form of the technology described by Aziz et al. (2014), where stable reflective foam, suitable for use as SRM in ocean regions with limited nutri-ents that support little marine life, is made in the laboratory.
The broad idea of microbubble deployment as a form of SRM is explored by Seitz (2010). Here we only examine the potential benefits and risks of such a scheme, and do not advocate deployment of any form of geoengineering regard-less of its present feasibility. Robock (2011) has cautioned against the potential implications of ocean albedo modifica-tion as presented by Seitz (2010).
different latitudinal distribution of benefits. The focus here is solely on the second scenario, as it allows for the elucidation of the impacts of the G4Foam experiment forcing alone.
1.2 Motivation and research question
Is it possible to cool the planet while concurrently maintain-ing or increasmaintain-ing precipitation in highly populated and heav-ily cultivated regions, particularly in regions dependent on monsoon precipitation? We begin by determining whether a forcing can be applied in a global climate model (GCM) that will result in the model responding with a northward and landward shift of tropical precipitation needed to achieve our objective. To that end we conducted simulations with the Community Earth System Model 1 and Community Atmo-spheric Model 4 fully coupled to tropoAtmo-spheric and strato-spheric chemistry (CESM1 CAM4-Chem) model (Lamarque et al., 2012; Tilmes et al., 2015, 2016). We ran the model with horizontal resolution of 0.9◦
×1.25◦
latitude–longitude and 26 levels from the surface to about 40 km (3.5 mb), as was done for G4SSA (specified stratospheric aerosol) by Xia et al. (2016).
The experiments consisted of three ensemble members of a simulation from 2020 to 2089 in which the ocean sur-face albedo is raised as described above from an average of 0.06, which includes a small diurnal cycle of albedo, to a daytime constant 0.15 on the SH subtropical ocean gyres for 50 years, 2020–2069, and then returned to unforced val-ues from 2070 to 2089 to assess termination. Our hypothe-sis is that the tropical rain belts will move northward largely as a result of increased moisture convergence over land re-gions, particularly during Northern Hemisphere (NH) sum-mer (June–July–August, JJA) in NH monsoon regions. En-hanced divergence over the already strong subtropical highs, due to increased subsidence over the increased albedo ocean regions in the subtropical Southern Hemisphere (SH), would help the cooler air from the forced subtropical regions advect throughout the SH troposphere.
The asymmetric cooling would force changes in the Hadley cell, enhancing cross-equatorial flow, which would cool the surface in the NH tropics, especially during JJA, when heat mortality and morbidity is highest. However, de-spite a reduction in the JJA mean temperature in the tropics, extreme events are responsible for most heat-related mortal-ity and morbidmortal-ity, and the reduction in the mean temperature does not necessarily mean that there will be a reduction in the type of extreme heat events that cause human tragedy. While Kharin et al. (2007) showed that, in general, temperature ex-tremes track with the mean temperature, this is not always the case. The changes in extreme events may, for example, be greater at high latitudes and the variability of temperatures over land may increase in a warmer climate.
Specific to geoengineering, Aswathy et al. (2015) showed that different climate engineering methods produce spatially heterogeneous changes in extreme precipitation and
tempera-ture events. They showed that one SRM scheme may be more effective than another in reducing different types of extreme events despite relatively similar global and regional mean re-sponses. In particular, a marine cloud brightening scheme that brightens ocean areas between 30◦
N and 30◦
S is shown to be less effective in reducing extreme precipitation and tem-perature events over land than the G3 experiment is.
Finally, the resulting cooling of low-latitude NH land areas would not dampen the monsoon. The wet-season monsoon circulation is initiated and maintained by the moist static en-ergy gradient, not the surface temperature gradient. A wet-ter, more cloudy land mass will strengthen, not dampen, the circulation relative to a warmer, drier continent (Hurley and Boos, 2013), especially with a cooler, lower specific humid-ity environment under the descending branch of the merid-ional circulation.
The strength of this response will be very sensitive to any cloud feedbacks that result from the surface albedo forcing. The basis of this comprehensive hypothesis is described in detail, below, specifically in Sect. 1.3 and 1.4. The details of the experiment are discussed in detail in Sect. 2.
1.3 Stratospheric geoengineering weakens the hydrological cycle
With global warming, low-level specific humidity will in-crease by about 7 % K−1within the tropical planetary bound-ary layer. This response will be spatially homogeneous throughout the tropics. However, the precipitation response will be different. Increased moisture convergence in areas that already get a lot of precipitation will result in the “wet getting wetter,” while increased moisture divergence in dry areas will result in the “dry getting drier” (Held and Soden, 2006).
The “rich get richer, poor get poorer” paradigm does not hold up in an SRM world, where the response is very differ-ent from that under global warming. Based on the results of an observational study, Trenberth and Dai (2007) pointed out the possibility that drought, particularly in the tropics, could result from geoengineering. Tilmes et al. (2013) analyzed the hydrological cycle in most of the GeoMIP participating Cou-pled Model Intercomparison Project 5 (CMIP5; Taylor et al., 2012) models by comparing abrupt 4xCO2, piControl, and G1. They found a robust reduction in global monsoon rain-fall, including in the Asian and west African monsoon re-gions in G1 relative to both abrupt 4xCO2 and piControl. Haywood et al. (2013) explored the impact of SSI in one hemisphere only and found a movement of the Intertropical Convergence Zone (ITCZ) away from the hemisphere that was cooler as a result of the asymmetric SSI.
1.4 Extratropical forcing impacts the position of the ITCZ
Under global warming, tropical rain belts will move to-ward the hemisphere that warms more (Chiang and Bitz, 2005; Frierson and Hwang, 2012). This ITCZ migration was first seen in early atmosphere–ocean coupled models. Clouds were prescribed in those models, and when clouds were changed in such a way to preferentially cool one hemi-sphere, the ITCZ responded to changes by moving toward the warmer hemisphere. Increasing low-cloud cover, and thereby inducing cooling, in one hemisphere relative to the other caused the tropical rain belts over the Pacific Ocean to move toward the other hemisphere (Manabe and Stouffer, 1980). The impacts of asymmetric heating of the hemispheres be-came highly relevant during the Sahel drought. Much of the rainfall deficit during the devastating 20–30 year drought can be attributed to cooling initiated by increased tropospheric sulfate emissions in the NH (Hwang et al., 2013). The forced cooling over the NH was enhanced by a positive dynamical feedback in the North Atlantic Ocean (Broccoli et al., 2006; Kang et al., 2008), and the ITCZ and associated tropical rain belts migrated south. Since the Sahel is at the northern mar-gin of the ITCZ’s annual migration, or at the northern termi-nus of the west African monsoon, southward displacement of the ITCZ led to a devastating drought (Folland et al., 1986).
Broccoli et al. (2006) diagnosed the energy balance mech-anism that causes the ITCZ to shift in response to asymmetric heating of the extratropics. Using models of varying com-plexity, Broccoli et al. (2006) imposed an anomalous cool-ing of the NH, either via a last glacial maximum simulation, or via hosing of the North Atlantic. The heating asymme-try causes the extratropics in the NH to demand more heat and the extratropics in the SH to demand less heat. Since cross-equatorial heat transport is achieved principally via the Hadley cell, the SH Hadley cell strengthens, particularly in austral summer, in response to the NH cooling, and net ergy flow in the upper branch intensifies, redistributing en-ergy into the NH from the relatively warm SH.
Net flow of energy in the Hadley cell can be described in terms of the flow of moist static energy, which flows in the direction of the upper-troposphere branch of the Hadley cell. This is because moist static energy is higher at higher altitudes in the troposphere due to the increased contribution of the geopotential energy term overwhelming the moisture and internal energy terms in the moist static energy equation for the high-altitude air. Net transport of energy, occurring in the upper branch of the Hadley cell from the SH to the NH, leads to increased moisture advection to the SH in the lower branch of the Hadley cell. This redistribution of en-ergy causes the ascending branch of the Hadley cell to mi-grate to the warmer SH where moisture convergence is in-creased and convective quasi-equilibrium is achieved under the relatively narrow poleward-shifted ascending branch of the stronger SH winter Hadley cell. This mechanism leads to
the southward-displaced tropical rain belts (Broccoli et al., 2006).
This result is consistent with Lindzen and Hou (1988), who used a relatively simple model to show that even a small movement of maximum heating poleward into one hemi-sphere causes great asymmetry in the Hadley cell, with the winter cell intensifying tremendously and the summer cell becoming rather modest. More recent work continues to elu-cidate the mechanism of extratropical forcing of the ITCZ (Kang et al., 2008). The ocean also plays a vital role in push-ing the ITCZ into the warmer hemisphere (Xie and Philander, 1994).
GCM results confirm this mechanism and connect the changes due to northward displacement of the ITCZ with the onset of active periods in the Asian summer monsoon (Chao and Chen, 2001). It is evident that a geoengineering tech-nique that could preferentially cool the SH could shift the tropical rain bands northward. However, in a GCM there are clouds. How would clouds respond in the hemisphere cooled by geoengineering? Would clouds change in the area being directly cooled? Would a cooling of the subtropics either di-rectly, or indirectly via eddy flux from the artificially cool high latitudes, cause an increase in subtropical subsidence? Would this increase in the sinking of air above the intensified subtropical highs cause water vapor to be trapped in the lower troposphere, forming low clouds and suppressing water va-por mixing into the free troposphere, where the water vava-por may instead be used up in formation of high clouds, which tend to reduce outgoing long-wave radiation? Informed by these established diagnostic mechanisms associated with the impacts of asymmetric heating of the hemispheres, we seek to concurrently cool the entire SH and the NH tropics, mod-estly cool the NH extratropics and, most importantly, induce an anomalous overturning circulation and redistribute rain-fall from ocean to land and from south to north across the tropics.
2 Methods
2.1 Design of experiment and model configuration Figure 1 shows the regions selected for albedo enhancement. These regions were chosen because of their low-cloud frac-tion, low wind speeds, weak currents, and lack of biological productivity.
The fundamental question we wish to answer concerns representation of the physical processes that lead to realistic simulation tropical precipitation. The Asian monsoon is of great importance in that investigation. Fortunately, monsoon processes and regimes are depicted well in our atmospheric component, CAM4 (Meehl et al., 2012). Some important fea-tures of CAM4 that illustrate its good monsoon representa-tion include the amount and locarepresenta-tion of precipitarepresenta-tion over the southern Tibetan Plateau and over the Western Ghats (a mountain range near the west coast of south India). This is improved when compared to earlier versions of the model. The rain shadow leeward of this range is often not resolved by GCMs, however CAM4 shows some evidence of this rain shadow. These changes related to orography and horizon-tal resolution are important and likely generalize to similar land surface features outside of India, where model biases have not been as carefully studied as they have been in heav-ily populated southern India. This improvement can be at-tributed to the CCSM4 finite-volume dynamical core, which replaces the spectral version of the CCSM3 and the inter-connected higher horizontal resolution (Neale et al., 2013). Additionally, large-scale features are improved. For example, the representation of the ITCZ during NH winter southward migration over the Maritime Continent is improved (Meehl et al., 2012).
There is an important process associated with monsoon precipitation, however, that may be imperfectly simulated across many CMIP5 GCMs. Zonal mean absorbed short-wave radiation is too high over the Southern Ocean (Kay et al., 2016). This cloud problem leads to a warmer Southern Ocean, which leads to anomalous SH atmospheric eddy flux to the subtropics from the extratropics, potentially damping the cooling response of our negative surface radiative forcing in the subtropical oceans. The effect of a transfer of heat from the SH extratropics into the Hadley cell already causes a rel-atively weak negative bias in the amount of interhemispheric heat transport from the south to north. Therefore, the mani-festation of this bias in G4Foam would be to partially offset our imposed cooling, lessening the need for interhemispheric energy transport to the SH and suppressing the surface return flow of moisture advection into the NH. Lower than observed interhemispheric energy transport would be associated with a weaker Asian monsoon. However, this feature is equally present in our G4Foam experiment and the comparison ex-periments G4SSA and RCP6.0, so is unlikely to appreciably affect the differences.
We compare G4Foam to two experiments. First is a spe-cific sulfate injection scenario, G4 Specified Stratospheric Aerosol (G4SSA; Xia et al., 2016). They used a prescribed stratospheric aerosol distribution roughly analogous to an-nual tropical emission into the stratosphere (at 60 mb) of 8 Tg SO2yr−1from 2020 to 2070. This produces a radiative forcing of about −2.5 W m−2. The G4SSA forcing ramps
down from 2069 to 2071 and then continues without addi-tional forcing from 2072 to 2089. In G4SSA tropospheric
aerosols are not affected by the prescribed stratospheric aerosols. Therefore we cannot evaluate how stratospheric aerosols would actually fall out and impact the chemistry, dynamics and thermodynamics of the troposphere from this experiment. Neely et al. (2016) offers more detail on the pre-scription of stratospheric aerosols in CAM4–Chem. The sec-ond simulation for comparison, which serves as the reference simulation for both G4Foam and G4SSA, is the Representa-tive Concentration Pathway 6.0 (RCP6.0) (Meinshausen et al., 2011) from 2004 to 2089. We have run three ensemble members each for G4Foam, G4SSA, and RCP6.0.
2.2 Ocean albedo enhancement approach
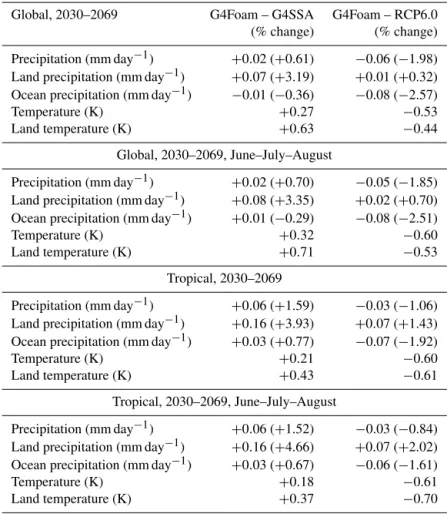
Table 1.Changes in temperature and precipitation in G4Foam relative to both G4SSA and RCP6.0, for the entire globe and for the Tropics (20◦S–20◦N) annually and in Northern Hemisphere summer, for the 40-year period beginning 10 years after the start of climate engineering.
Global, 2030–2069 G4Foam – G4SSA G4Foam – RCP6.0 (% change) (% change)
Precipitation (mm day−1) +0.02 (+0.61) −0.06 (−1.98) Land precipitation (mm day−1) +0.07 (+3.19) +0.01 (+0.32) Ocean precipitation (mm day−1) −0.01 (−0.36) −0.08 (−2.57) Temperature (K) +0.27 −0.53 Land temperature (K) +0.63 −0.44
Global, 2030–2069, June–July–August
Precipitation (mm day−1) +0.02 (+0.70) −0.05 (−1.85) Land precipitation (mm day−1) +0.08 (+3.35) +0.02 (+0.70) Ocean precipitation (mm day−1) +0.01 (−0.29) −0.08 (−2.51) Temperature (K) +0.32 −0.60 Land temperature (K) +0.71 −0.53
Tropical, 2030–2069
Precipitation (mm day−1) +0.06 (+1.59) −0.03 (−1.06) Land precipitation (mm day−1) +0.16 (+3.93) +0.07 (+1.43) Ocean precipitation (mm day−1) +0.03 (+0.77) −0.07 (−1.92) Temperature (K) +0.21 −0.60 Land temperature (K) +0.43 −0.61
Tropical, 2030–2069, June–July–August
Precipitation (mm day−1) +0.06 (+1.52) −0.03 (−0.84) Land precipitation (mm day−1) +0.16 (+4.66) +0.07 (+2.02) Ocean precipitation (mm day−1) +0.03 (+0.67) −0.06 (−1.61) Temperature (K) +0.18 −0.61 Land temperature (K) +0.37 −0.70
3 Results
The following results compare the G4Foam climate with the climates in G4SSA and RCP6.0 averaged over the period 2030–2069. While G4Foam and G4SSA forcing commences in 2020, the first ten years of both experiments are a period of transition. For that reason 2020–2029 is discarded from our comparisons. We analyze mainly annual average and JJA results, since JJA is meteorological summer in the NH and using JJA facilitates comparison with G4SSA, which reports results in terms of JJA (Xia et al., 2016).
3.1 Temperature and cloud response
The primary purpose of G4Foam is to assess the possibil-ity of reducing global mean surface temperature without ducing monsoon precipitation. The G4Foam simulations re-duce global mean surface temperature relative to RCP6.0 by 0.60 K and global mean land surface temperature by 0.51 K relative to RCP6.0. In JJA, G4Foam is 0.70 K cooler than RCP6.0 over land in the tropics, 20◦
S–20◦
N, during JJA (Table 1).
These temperature changes in G4Foam, relative to RCP6.0, result from an all-sky top-of-atmosphere forcing of
−1.5 W m−2 (global, year-round), and −1.9 W m−2 in the tropics during JJA only (Fig. 2). This JJA cooling in the trop-ics is of particular importance due to the dense population and heavy agricultural demand in the tropics, particularly north of the equator.
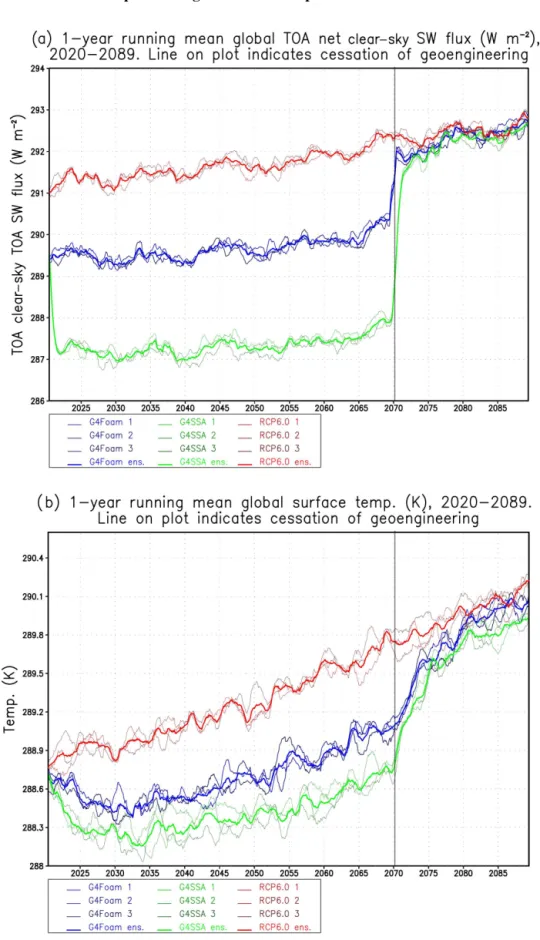
G4Foam does not achieve the same amount of cooling as G4SSA, which would reduce global mean surface tempera-ture by 0.92 K. All-sky top-of-atmosphere shortwave flux in G4SSA is reduced by 2.7 W m−2as compared to RCP6.0. In terms of global mean clear-sky top-of-atmosphere shortwave flux, relative to RCP6.0, G4Foam applies only 38 % of the forcing that is applied in G4SSA (Fig. 3). The G4Foam forc-ing is more efficient in reducforc-ing temperature than G4SSA, largely because there is an additional 1.1 W m−2of net cloud forcing in G4Foam relative to G4SSA (Fig. 2b).
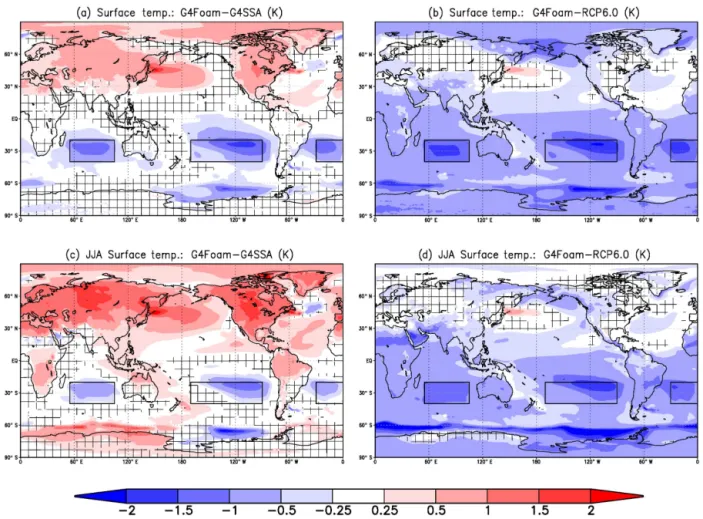
Figure 4. 2030–2069 surface temperature differences (K) between G4Foam and (a)G4SSA, (b)RCP6.0,(c) G4SSA during JJA, and (d)RCP6.0 during JJA. Hatched regions are areas withp> 0.05 (where changes are not statistically significant based on a pairedt test). Black boxes enclose foamed regions.
South Pacific foamed region. However, the cooling mixes rather well throughout the SH. Cross-equatorial flow and changes in the Hadley cell transmit this cooling into the NH tropics through the mechanisms described in Sect. 1.4, above. Some of this cooling in the NH tropics is then trans-mitted to the NH extratropics.
G4Foam is significantly cooler (p< 0.05) than RCP6.0 in almost all locations south of 30◦
N, in mid-latitude NH con-tinental regions windward of the Atlantic and Pacific oceans, and at very high latitudes. Figure 4d shows that G4Foam is less effective in cooling extratropical NH land regions during JJA. This is reasonable, since continental heating in the NH JJA season is more dominated by local heating than the other seasons, in which meridional energy transport plays a larger role. Figure 4a and c show that G4SSA is more effective over NH continents than G4Foam. A key weakness of G4Foam, if implemented alone, would be its failure to adequately reduce human suffering induced by heat stress in NH mid-latitudes during the summer as a result of ongoing global warming.
Since the G4Foam forcing alone, with the amplitude of the current experiments, would be insufficient to achieve any of
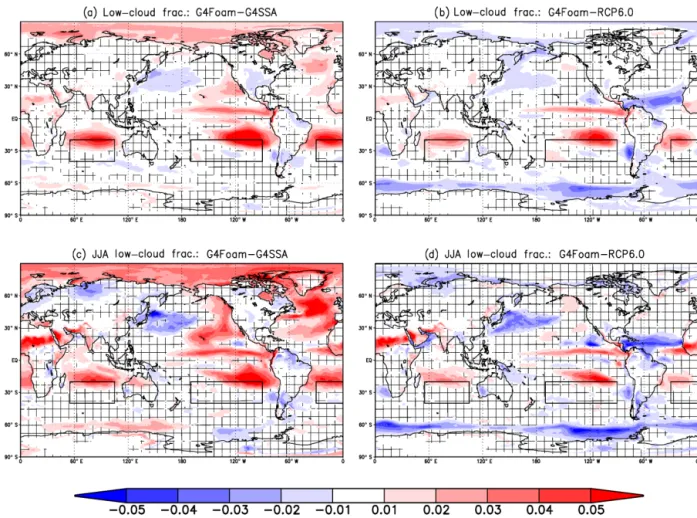
the objectives of the G4Foam experiment, positive feedbacks that enhance cooling and circulation responses must be trig-gered by the G4Foam forcing to enhance a resulting cooler, wetter climate. Figure 5 shows change in low-cloud fraction both year-round and in the JJA season. The largest change is in the northern half of the regions where foam is applied, and the area to the north of those foamed regions. The changes in low clouds in these regions are both large and statistically significant.
sur-Figure 5.2030–2069 low-cloud fraction difference (unitless) between G4Foam and(a)G4SSA,(b)RCP6.0,(c)G4SSA during JJA, and (d)RCP6.0 during JJA. Hatched regions are areas withp> 0.05 (where changes are not statistically significant based on a pairedt test). Black boxes enclose foamed regions.
face warming triggers more turbulence within the planetary boundary layer, which allows for enhanced cumulus mixing in the cloud layer, which entrains dry air and evaporates the marine stratocumulus layer.
The subtropical high-pressure systems are stronger in G4Foam, due to the stronger than normal Hadley cell, which enhances subsidence throughout the subtropics. Typically, a subsidence inversion is strongest over the center of the subtropical anticyclones, over cold currents (particularly the Peru Current), and over cooler than normal waters, which are subjected to enhanced upwelling in large part by trade winds on the periphery of the subtropical highs (DeSzoeke et al., 2016). The TWI becomes weaker and its base increases in height as it moves towards the west and towards the equator, as SSTs increase. This pattern is particularly evident in the Pacific, due to the larger geographical extent of the forced area.
Specifically, under G4Foam conditions, the increased low-cloud fraction areas are the result of the combination of en-hanced large-scale subsidence (stronger Hadley cell) and a cooler than normal ocean surface. The cooler than normal
surface waters are due to general cooling throughout the SH, as well as an increase in wind-driven upwelling over these ar-eas of incrar-eased low-cloud fraction, which are already prone to upwelling, a large fraction of low clouds, and high relative humidity.
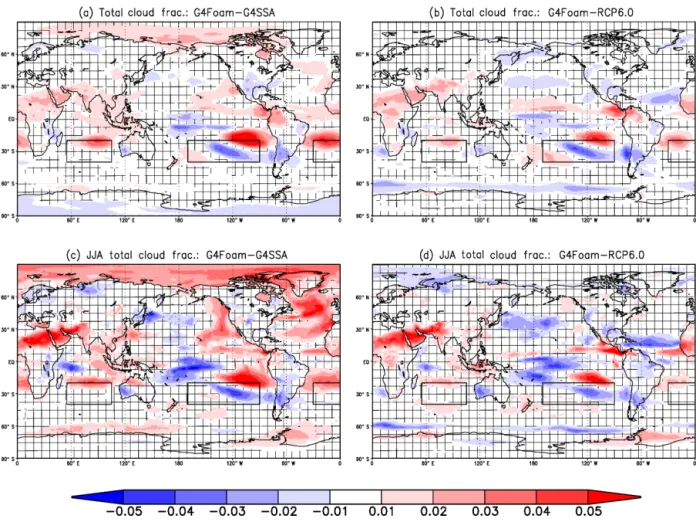
Figure 6.2030–2069 total cloud fraction difference (unitless) between G4Foam and(a)G4SSA,(b)RCP6.0,(c)G4SSA during JJA, and (d)RCP6.0 during JJA. Hatched regions are areas withp> 0.05 (where changes are not statistically significant based on a pairedt test). Black boxes enclose foamed regions.
enhanced low-cloud fraction response is similar to the sea-sonal cycle of marine low clouds around the periphery of the subtropical highs (Wood and Bretherton, 2004; Chiang and Bitz, 2005; Wood and Bretherton, 2006; George and Wood, 2010; Mechoso et al., 2014).
The relationship between the strength of the subtropical high, inversion strength, and marine cloud prevalence can be elucidated by analogy to the behavior of the very well-observed marine low clouds off of the California coast. The strength of the inversion and the prevalence of marine low clouds are modulated by the annual cycle with annual max-imum low-cloud extent in the summer, when the subtropical high is at its strongest. The increased low-cloud fraction re-sponse is not seen above the actual G4Foam-forced regions despite the cooler SST. The subsidence is so strong in these areas that the base of the inversion falls below the lifting con-densation level, and few clouds form (Fig. 5).
Another striking G4Foam feature is the large and statisti-cally significant increase in low clouds over land across cen-tral Africa, the Middle East, and Southeast Asia. These low clouds are coincident with the large cooling in Africa and the
Middle East, particularly during the JJA season relative to both G4SSA and RCP6.0 (Fig. 5c, d). These are very hot ar-eas and heat-related mortality and morbidity are of great con-cern. A similar increase in low clouds is evident in the trop-ical eastern Pacific. This is coincident with the mean north-ward displacement of the ITCZ in G4Foam with respect to G4SSA and RCP6.0, not with any changes in the El Niño– Southern Oscillation (ENSO).
In G4Foam, clouds are the key to changing the radiation budget in the tropics. In G4Foam there is a change in short-wave cloud forcing of −2.32 annually and −2.59 W m−2
during JJA, relative to G4SSA. Only very small increases in long-wave cloud forcing of 0.42 annually and 0.07 W m−2 in JJA counter this negative forcing. The overall change in cloud radiative forcing in the tropics is−1.90 annually and −2.52 W m−2 during JJA. Relative to RCP6.0, in G4Foam
there is a change in shortwave cloud forcing of−0.68
Figure 7.2030–2069 precipitation difference (%) between G4Foam and(a)G4SSA,(b)RCP6.0,(c)G4SSA during JJA, and(d)RCP6.0 during JJA. Hatched regions are areas withp> 0.05 (where changes are not statistically significant based on a pairedt test). Black boxes enclose foamed regions.
tropics is−0.49 annually and−0.61 W m−2during JJA when compared to RCP6.0
Total cloud fraction is shown in Fig. 6. Figure 6c and d are particularly striking in showing the increase in clouds over Africa and Southeast Asia during the JJA wet mon-soon season in those regions. Under G4Foam, these regions generally experience cloudier and cooler summers relative to RCP6.0 and are cloudier and only very slightly warmer on average compared to G4SSA. Some parts of the Sahel and the Middle East are actually slightly cooler in G4Foam than RCP6.0. These changes in temperature and cloudiness play a key role in the changes in the hydrological cycle under G4Foam, which we discuss next.
3.2 Hydrological cycle response
Relative to G4SSA, precipitation in G4Foam over land in the tropics increases by 3.2 % on an annual mean basis and by 3.9 % during JJA (Table 1). Tropical precipitation in G4Foam over land in the tropics increases by 1.4 % on an annual mean basis and by 2.02 % during JJA, when com-pared to RCP6.0. Each of these changes is statistically
signif-icant (p< 0.05). Regarding the temperature change relative to G4SSA, G4Foam is only about 0.3 K warmer in the trop-ics. Precipitation is expected to increase by between 1.5 and 3.0 % K−1as global mean temperature increases (Emori and Brown, 2005). The temperature difference between G4Foam and G4SSA can explain only a fraction of the precipitation increase. The statistically significant increase in land-only precipitation in the tropics in G4Foam relative to RCP6.0 occurs in a climate in which RCP6.0 is between 0.6 and 0.7 K warmer than G4Foam, depending on the season. Over the tropical oceans, in G4Foam, precipitation is reduced by 0.4 % on an annual mean basis and reduced by 0.3 % during JJA relative to G4SSA. There is a decrease of 2.6 % on an an-nual mean basis and a decrease of 2.5 % during JJA relative to RCP6.0.
relative to G4SSA over land by 3.5 %, despite G4Foam only being 0.3 K warmer than G4SSA.
The overall global precipitation difference between G4Foam and G4SSA or RCP6.0, when land and ocean are combined and all seasons and all latitudes are included, is relatively small, and close to the 1.5 to 3 % K−1range of pre-cipitation increase with temperature identified by Emori and Brown (2005). Globally, G4Foam is warmer than G4SSA by 0.3 K and there is 0.61 % (2.1 % K−1)more precipitation. G4Foam is cooler than RCP6.0 by 0.6 K and drier by 1.9 % (3.1 % K−1).
The spatial pattern of precipitation changes is shown in Fig. 7. Precipitation is greatly reduced over the ocean, par-ticularly in the SH, relative to both G4SSA and RCP6.0. Changes in precipitation poleward of 40◦ latitude in either hemisphere are largely due to the temperature dependence of precipitation. The changes in the SH subtropics are domi-nated by the shortwave forcing applied over the ocean gyres, which reduces both evaporation and precipitation in those ar-eas.
The changes in precipitation in the tropics are driven by a northward shift in the ITCZ. Large precipitation anomalies occur in a narrow band north of the equator and smaller pos-itive anomalies occur in broader regions, primarily over NH monsoon regions. Importantly, we see a statistically signif-icant increase in monsoon precipitation over the Sahel, the Middle East, and the Indian subcontinent as well as south-west Asia and the Maritime Continent on an annual mean basis in G4Foam relative to G4SSA (Fig. 7a). Relative to RCP6.0, these changes are not statistically significant over the Indian subcontinent or southwest Asia, but there are only very isolated and small areas in these regions in which there is any precipitation reduction, either on the annual mean or during JJA. Therefore, over much of heavily populated south-ern Asia, east of the Arabian Sea, G4Foam will be cooler than RCP6.0 without any notable mean precipitation differences. Most of these areas are expected to receive more rainfall as the planet warms. If this excess rainfall is not desirable in areas that are already wet, these results suggest that weaken-ing the hydrological cycle would require that G4Foam would have to be combined with an additional geoengineering tech-nique, such as stratospheric SRM.
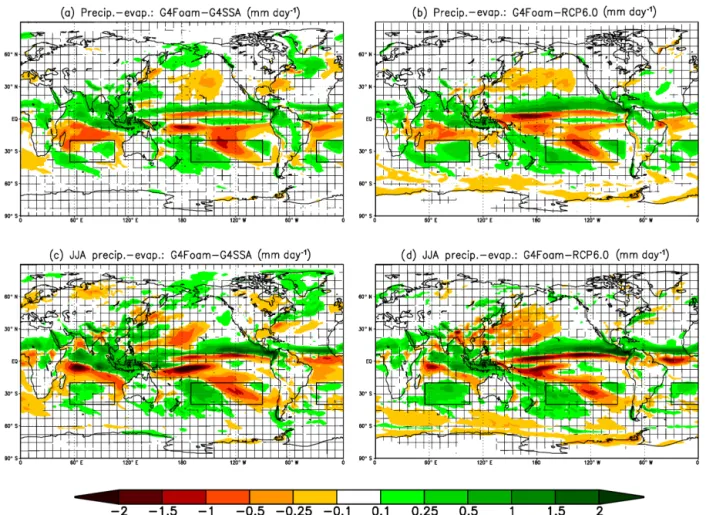
Relative to both G4SSA and RCP6.0, there is a great deal more precipitation all year and particularly during JJA over Central America, the northern Amazon, much of Africa, parts of the Arabian peninsula, and the Maritime Continent. This response is more robust than the response over South-east Asia due to the more direct dependence of rainfall in these regions on ITCZ position than in Southeast Asia, where the monsoon is also driven by numerous local and remote factors, including ENSO and the Indian Ocean dipole (IOD). Although these G4Foam simulations enhance rainfall over many heavily populated and highly cultivated regions, partic-ularly in the tropics, there are regions that would receive less precipitation and experience a decrease inP−E
(precipita-tion−evaporation) under this regime. Precipitation patterns for islands in the South Pacific are largely governed by the position and strength of the South Pacific Convergence Zone (SPCZ), which changes substantially under G4Foam due in part to the cooling and to the movement of gradients of tem-perature and pressure. Precipitation deficits over Madagascar and some regions in Africa and South America exceed 10 %. While the changes in precipitation are important and use-ful in describing the climate response in G4Foam, the change in precipitation minus evaporation between G4Foam and G4SSA or RCP6.0 is more relevant to total available mois-ture. Figure 8 shows precipitation minus evaporation. Specif-ically, Fig. 8a shows that precipitation minus evaporation in G4Foam is increased, and this increase is significant relative to G4SSA across the Sahel, all of southern Asia, the Mar-itime Continent, Central America, and the northern Amazon. These are all heavily populated regions that are heavily cul-tivated. Figure 8b shows a similar pattern, albeit with the re-gions with significantly higherP−Eis slightly suppressed in coverage, when G4Foam is compared to the warmer RCP6.0 rather than G4SSA. Figure 8c and d show changes inP−E
during JJA, the NH wet monsoon season, when water is likely needed the most. Due to variability in the monsoon, there is more heterogeneity in the JJA response than the an-nual response, particularly across Southeast Asia. TheP−E
gain, driven by a combination of increased precipitation, lower temperature, and increased cloudiness in these heavily cultivated regions, could be an important benefit of G4Foam. However, G4Foam increased precipitation to levels that ex-ceed that simulated in RCP6.0.
Figure 9 shows the differences of annual cycles from 2030 to 2069 for zonal mean precipitation, zonal mean precipi-tation minus evaporation, and zonal mean precipitable wa-ter between G4Foam and G4SSA and between G4Foam and RCP6.0. They illustrate the northward displacement of the ITCZ, with positive precipitation anomalies progressing poleward as the boreal summer monsoon progresses. Fig-ure 9f shows the difference in the zonal mean annual cycle for column-integrated precipitable water between G4Foam and RCP6.0. The striking feature here is that zonal mean precipitation is higher at key latitudes in the tropics, despite zonal mean column-integrated precipitable water being much lower at the same latitude.
Figure 8.2030–2069 precipitation minus evaporation difference (mm day−1) between G4Foam and(a)G4SSA,(b)RCP6.0,(c)G4SSA during JJA, and(d)RCP6.0 during JJA. Hatched regions are areas withp> 0.05 (where changes are not statistically significant based on a pairedttest). Black boxes enclose foamed regions.
4 Discussion
This paper is an analysis of a geoengineering climate model experiment. Although for this experiment, global warming is reduced without seriously affecting precipitation, as was found in previous stratospheric aerosol implementations, this does not argue for the implementation of climate engineer-ing. Any such decisions will need to balance all the risks and benefits of such implementation, and compare them to those from other possible responses to global warming.
4.1 Summary
G4Foam would reduce global mean surface temperature rel-ative to RCP6.0 by 0.6 K for the 40-year period starting 10 years after the implementation of geoengineering. Clear-sky top-of-atmosphere net shortwave flux is reduced by 1.5 W m−2in G4Foam relative to RCP6.0. This is achieved primarily by the shortwave forcing over the subtropical SH ocean gyres. Before accounting for feedbacks, temper-ature is more sensitive to the forcing applied in G4Foam
than G4SSA. However, global mean surface temperature in G4SSA is 0.3 K lower than G4Foam because of a larger change in all-sky top-of-atmosphere net shortwave flux (Fig. 3). Additionally, the latitudinal distribution of tem-perature reduction is different in G4Foam than in G4SSA. G4SSA is most effective in cooling the NH continents, while G4Foam most effectively cools the surface south of around 30◦
N (Fig. 4).
is-Figure 9. 2030–2069 monthly mean annual cycle of zonal mean precipitation (mm day−1) for (a) G4Foam minus G4SSA and (b) G4Foam minus RCP6.0, precipitation minus evaporation (mm day−1) for(c)G4Foam minus G4SSA and(d)G4Foam minus RCP6.0, and total precipitable water (mm) for(e)G4Foam minus G4SSA and(f)G4Foam minus RCP6.0.
sue in many of these areas and G4Foam describes a climate model response in which there is global cooling, but higher
P −Eis modeled for many regions, some of which are in need of greater water supply. However, in order to assess ac-tual changes in water supply, it would be necessary to analyze extreme events, as well as the economic and policy issues that ultimately determine the allocation of water resources in a given region.
Finally, both the changes in the spatial pattern and mag-nitude of changes in temperature and precipitation are far too large to be explained by the forcing alone. Instead, much of the temperature and hydrological response is the result of powerful cloud feedbacks and changes in the tropical merid-ional overturning circulation induced by the placement of the ocean albedo forcing.
4.2 The hydrological response
The dominant cause of the G4Foam hydrological response is the intensification of the southern Hadley cell and the
north-Figure 10. (a)Photosynthesis rate differences between G4SSA and RCP6.0 during years 2030–2069 (sulfate injection period, exclud-ing the first 10 years; Fig. 4a from Xia et al., 2016).(b) Photosynthe-sis rate anomaly between G4Foam and RCP6.0 during years 2030– 2069 of solar reduction. Hatched regions are areas withp> 0.05 (where changes are not statistically significant based on a paired ttest).
ward migration of the ITCZ in response to the asymmetric forcing. However, the precipitation response is not zonally homogeneous, as the regional and local mechanisms are also important to the distribution of precipitation.
First, we address the increase in precipitation over Central America. For this, we turn to literature concerning the de-cline of Mayan civilization in Central America. Summer in-solation in the NH began to decrease about 5000 years ago. The ITCZ migrated southward. This southward shift caused rainfall to decrease in the crucial summer growing season. Long droughts and eventually water shortages contributed to the civilization’s decline (Poore et al., 2004). In G4Foam, the ITCZ moves northward and the areas in which Mayan civ-ilization flourished, including Belize, Guatemala and parts of Mexico, once again receive a great deal more precipita-tion. This response is strong and consistent in each ensemble member (Figs. 6–8).
generally explains the G4Foam precipitation increase in the Sahel.
A surprising finding is that portions of the Arabian Penin-sula equatorward of 20◦
S experience precipitation increases of up to 1 mm day−1 during the JJA season. However, this northward migration of boreal summer precipitation is evi-dent in the paleoclimate record. Evidence of such precipita-tion is found in Fleitmann et al. (2003), who showed changes in δ18O in cave stalagmites in Oman, which indicate in-creased rainfall in Oman under the influence of northward movement of the ITCZ over the Indian Ocean in periods of relative warmth in the NH relative to the SH.
Changes in precipitation over the Maritime Continent are partially attributable to large-scale convergence and rising air in those regions, as they lie longitudinally between G4Foam forcing zones where subsidence is enhanced. However, the Indian Ocean dipole (Cai et al., 2012; Chowadry et al., 2012) and subtropical Indian Ocean dipole (SIOD) phenomena dis-cussed below are more likely to be the key drivers of the pre-cipitation response over the Maritime Continent.
In its positive phase, the SIOD features anomalously warm SSTs in the southwestern Indian Ocean, east and southeast of Madagascar, and cold anomalies of SST west of Australia. Stronger winds prevail along the eastern edge of the SH sub-tropical high over the Indian Ocean, which becomes inten-sified and shifted slightly to the south during positive SIOD events. This results in more evaporation over the eastern In-dian Ocean, which cools SSTs in the InIn-dian Ocean east of Australia (Suzuki et al., 2004). In the SIOD negative phase, the opposite is true. There is cooler water in the southwest Indian Ocean, near Madagascar, and warmer waters to the east, near Australia (Behera et al., 2001; Reason, 2001).
The negative phase of the SIOD features more precipita-tion in western Australia and the Maritime Continent. This negative SIOD phase is consistent with the SST pattern in the Indian Ocean forced by G4Foam. Therefore, the negative SIOD-like mean state in G4Foam appears to play a role in the enhanced rainfall in northwestern Australia and the Maritime Continent.
Based on both local and global changes in circulation, we expected a very large increase in the strength of the Indian monsoon. In addition to the planetary-scale changes asso-ciated with the ITCZ and the Hadley cell, the position of the semi-permanent high in the subtropical southern Indian Ocean also plays a large role in modulating the Indian sum-mer monsoon. Negative SIOD events during boreal winter are often followed by strong Indian summer monsoons. Dur-ing a negative SIOD event, the subtropical high in the Indian Ocean shifts northeastward as the season shifts from Decem-ber, January, and February to JJA. This causes a strengthen-ing of the monsoon circulation, intensifystrengthen-ing the Hadley cell locally during the JJA monsoon.
A negative IOD is associated with a weakened Asian mon-soon and an increase in precipitation over Australia and the Maritime Continent. In G4Foam, advection of cold water in
the Somali current into the equatorial western Indian Ocean creates a negative IOD-like response that partially counters the combination of the global-scale Hadley cell response and the forced SIOD, dampening the overall increase in the Indian monsoon. This warm west–cold east mean state in the equatorial Indian Ocean resembles a negative IOD mean state and it helps to explain the enhanced precipitation re-sponse in the Maritime Continent and the lower than ex-pected increase in precipitation over the Indian subconti-nent. The Asian monsoon and precipitation over the Mar-itime Continent are also governed in part by ENSO. How-ever, no changes in ENSO were evident in G4Foam rel-ative to G4SSA or RCP6.0. There is also no evident re-sponse of ENSO amplitude or frequency to any of several dif-ferent regimes of stratospheric geoengineering (Gabriel and Robock, 2015).
4.3 Caveats
The technology does not presently exist to actually deploy a stable, highly reflective layer of microbubbles on the ocean surface. While a stable, highly reflective, nondispersive foam has been developed in a saltwater solution, appropriate for climate engineering, this foam has not been tested outside the laboratory, much less on the surface of a large area of rarely quiescent ocean. The foam has not been immersed in a medium in which bacteria are present, and the interaction between the bacteria and the protein surfactant could damage the layer of microbubbles. Also, even though the diameter of these microbubbles is on the order of 10−6m, the demand for surfactant would likely overwhelm our current produc-tion capacity of whatever surfactant is chosen. The research on the engineering required to perform stratospheric geo-engineering by sulfate injection is much further along than research of microbubble deployment, which is still in its ear-liest stages.
However, since development of microbubble technology is underway, it is worthwhile to determine how such a tech-nology could be applied in a manner that would address se-rious climate issues. The progress being made in research associated with stratospheric geoengineering actually en-hances the relevance of researching the climate impact of this particular ocean surface geoengineering approach, as G4Foam was designed with an eye toward concurrent de-ployment with stratospheric geoengineering in the event that the stratospheric geoengineering were to cause the precip-itation deficits that many model studies have shown that it might.
re-sources. To some extent, making this value judgment is ger-mane and is a prerequisite to the discussion of any form of geoengineering. Even though G4Foam would be successful in increasingP−Ein more heavily populated areas,P−E
will almost certainly be reduced in remote regions, such as South Pacific islands. Is it ethical to pick winners and losers when the selection process is aimed at increasing the number of winners and decreasing the number of losers? Hypothet-ically, if G4Foam worked as described in this paper, from a purely consequentialist perspective, and with the sole objec-tive being increased utility for the human collecobjec-tive, G4Foam could be considered beneficial.
Finally, this paper is concerned with the climate response to surface albedo changes. We do not examine how plac-ing an actual layer of microbubbles in the ocean would change ocean circulation or impact chemistry and biology in the ocean. Evaluating the changes in the ocean, espe-cially changes in its circulation that are caused by the sur-face albedo modification, is one of the next issues to explore. The ocean regions we propose to brighten have low biologi-cal productivity and weak currents, but the possibility of re-mote impacts, due to changes in circulation having negative impacts on important ocean regions, is worth considering. 4.4 Future research
Whether or not a concurrent deployment of stratospheric geoengineering and ocean albedo modification could cool the entire planet while maintaining or enhancing the hydrologi-cal cycle, particularly in the tropics, is the next natural step in this research. Such research is motivated by the need to de-termine whether some combination of geoengineering tech-niques can be used to offset regional climate disparities that using one method of geoengineering alone could induce.
5 Data availability
Descriptions of data and links to output of this and other GeoMIP experiments, can be found at the Ge-oMIP homepage http://climate.envsci.rutgers.edu/GeGe-oMIP/ data.html. Additional data from this experiment can be found at http://climateresearch.envsci.rutgers.edu/corey. The un-derlying research data can be accessed by contacting the cor-responding author at [email protected].
Acknowledgements. We thank two anonymous referees for their valuable comments, which improved this paper. This work is supported by US National Science Foundation (NSF) grants AGS-1157525, GEO-1240507, and AGS-1617844. Computer simulations were conducted on the National Center for Atmo-spheric Research (NCAR) Yellowstone supercomputer. NCAR is funded by NSF. The CESM project is supported by NSF and the Office of Science (BER) of the US Department of Energy. The Pacific Northwest National Laboratory is operated for the US Department of Energy by Battelle Memorial Institute under
contract DE-AC05-76RL01830.
Edited by: L. M. Russell
Reviewed by: two anonymous referees
References
Aswathy, V. N., Boucher, O., Quaas, M., Niemeier, U., Muri, H., Mülmenstädt, J., and Quaas, J.: Climate extremes in multi-model simulations of stratospheric aerosol and marine cloud brighten-ing climate engineerbrighten-ing, Atmos. Chem. Phys., 15, 9593–9610, doi:10.5194/acp-15-9593-2015, 2015.
Aziz, A., Hailes, H. C., Ward, J. M., and Evans, J. R. G.: Long-term stabilization reflective foams in seawater, Roy. Soc. Ch., 95, 53028–53036, 2014.
Behera, S. K. and Yamagata, T.: Subtropical SST dipole events in the southern Indian Ocean, Geophys. Res. Lett., 28, 327–330, 2001.
Bonan, G. B., Lawrence, P. J., Oleson, K. W., Levis, S., Jung, M., Reichstein, M., Lawrence, D. M., and Swenson, S. C.: Improving canopy processes in the Community Land Model version 4 (CLM4) using global flux fields empirically in-ferred from FLUXNET data, J. Geophys. Res., 116, G02014, doi:10.1029/2010JG001593, 2011.
Broccoli, A. J., Dahl, K. A., and Stouffer, R. J.: The response of the ITCZ to Northern Hemisphere cooling, Geophys. Res. Lett., 33, L01702, doi:10.1029/2005GL024546, 2006.
Cai W., Van Rensch P., Cowan T., and Hendon H. H.: Telecon-nection pathways for ENSO and the IOD and the mechanism for impacts on Australian rainfall, J. Climate, 24, 3910–3923, doi:10.1175/2011JCLI4129.1, 2011.
Chao, W. C. and Chen, B.: The origin of the monsoons, J. Atmos. Sci., 58, 3497–3507. 2001.
Chiang, J. C. H. and Bitz, C. M.: Influence of high latitude ice cover on the marine Intertropical Convergence Zone, Clim. Dynam., 25, 477–496, 2005.
Chowdary, J. S., Xie, S.-P., Tokinaga, H., Okumura, Y. M., Kub-ota, H., Johnson, N., and Zheng, X.-T.: Interdecadal varia-tions in ENSO teleconnection to the Indo–western Pacific for 1870–2007, J. Climate, 25, 1722–1744, doi:10.1175/JCLI-D-11-00070.1, 2012.
Crutzen, P.: Albedo enhancement by stratospheric sulfur injections: A contribution to solve a policy dilemma?, Climatic Change, 77, 211–219, 2006.
Cvijanovic, I., Caldeira, K., and MacMartin, D.G.: Impacts of ocean albedo alteration on Arctic sea ice restoration and Northern Hemisphere climate, Environ. Res. Lett., 10, 044020, doi:10.1088/1748-9326/10/4/044020, 2015.
DeSzoeke, S. P., Verlinden, K. L., Yuter, S. E., and Mechem, D. B.: The Time Scales of Variability of Marine Low Clouds, J. Cli-mate, 29, 6463–6481, doi:10.1175/JCLI-D-15-0460.1, 2016. Dykema J. A., Keith D. W., Anderson J. G., and Weisenstein,
Emori, S. and Brown, S. J.: Dynamic and thermodynamic changes in mean and extreme precipitation under changed climate, Geo-phys. Res. Lett., 32, L17706, doi:10.1029/2005GL023272, 2005. Fleitmann, D., Burns, S. J., Mudelsee, M., Neff, U., Kramers, J., Mangini, A., and Matter, A.: Holocene forcing of the Indian monsoon recorded in a stalagmite from Southern Oman, Science, 300, 1737–1739, 2003.
Folland, C. K., Parker, D. E., and Palmer, T. N.: Sahel rainfall and worldwide sea temperatures 1901–85, Nature, 320, 602–607, 1986.
Frierson, D. M. W. and Hwang, Y.-T.: Extratropical influence on ITCZ shifts in slab ocean simulation of global warming, J. Cli-mate, 25, 720–733, 2012.
Gabriel, C. J. and Robock, A.: Stratospheric geoengineering im-pacts on El Niño/Southern Oscillation, Atmos. Chem. Phys., 15, 11949–11966, doi:10.5194/acp-15-11949-2015, 2015.
George, R. C. and Wood, R.: Subseasonal variability of low cloud radiative properties over the southeast Pacific Ocean, Atmos. Chem. Phys., 10, 4047–4063, doi:10.5194/acp-10-4047-2010, 2010.
Haywood, J. M., Jones, A., Bellouin, N., and Stephenson, D.: Asymmetric forcing from stratospheric aerosols im-pacts Sahelian rainfall, Nature Climate Change, 3, 660–665, doi:10.1038/nclimate1857, 2013.
Held, I. M. and Soden, B. J.: Robust responses of the hydrological cycle to global warming, J. Climate, 19, 5686–5699, 2006. Hurley, J. V. and Boos, W. R.: Interannual variability of monsoon
precipitation and local subcloud equivalent potential tempera-ture, J. Climate, 26, 9507–9527, 2013.
Hwang, Y.-T., Frierson, D. M. W., and Kang, S. M.: Anthropogenic sulfate aerosol and the southward shift of tropical precipitation in the late 20th century, Geophys. Res. Lett., 40, 2845–2850, doi:10.1002/grl.50502, 2013.
IPCC: Summary for Policymakers, in: Climate Change 2013: The Physical Science Basis, Contribution of Working Group I to the Fifth Assessment Report of the Intergovernmental Panel on Cli-mate Change, edited by: Stocker, T. F., Qin, D., Plattner, G.-K., Tignor, M., Allen, S. K., Boschung, J., Nauels, A., Xia, Y., Bex, V., and Midgley, P. M., Cambridge University Press, Cambridge, UK and New York, NY, USA, 2013.
Irvine, P. J., Ridgwell, A., and Lunt, D. J.: Climatic effects of surface albedo geoengineering, J. Geophys. Res., 116, D24112, doi:10.1029/2011JD016281, 2011.
Jones, A., Haywood, J., and Boucher, O.: Climate impacts of geo-engineering marine stratocumulus clouds, J. Geophys. Res., 114, D10106, doi:10.1029/2008JD011450, 2009.
Kang, S. M., Held, I. M., Frierson, D. M. W., and Zhao, M.: The response of the ITCZ to extratropical thermal forcing: Idealized slab-ocean experiments with a GCM, J. Climate, 21, 3521–3532, 2008.
Kay J. E., Wall C., Yettella V., Medeiros B., Hannay C., Caldwell P., and Bitz C.: Global climate impacts of fixing the Southern Ocean shortwave radiation bias in the community earth system model (CESM), J. Climate, 96, 1333–13349, doi:10.1175/JCLI-D-15-0358, 2016.
Keith, D. W., Duren, R., and MacMartin, D. G.: Field experiments on solar geoengineering: report of a workshop exploring a repre-sentative research portfolio, Philos. T. R. Soc. A, 372, 20140175, 2014.
Kharin, V. V., Zwiers, F. W., Zhang, X., and Hegerl, G. C.: Changes in temperature and precipitation extremes in the IPCC ensem-ble of Global Coupled Model Simulations, J. Climate, 20, 1419– 1444, doi:10.1175/JCLI4066.1, 2007.
Kravitz, B., Robock, A., Boucher, O., Schmidt, H., Taylor, K., Stenchikov, G., and Schulz, M.: The geoengineering model in-tercomparison project (GeoMIP), Atmos. Sci. Lett., 12, 162–167, doi:10.1002/asl.316., 2011.
Kravitz, B., Robock, A., Tilmes, S., Boucher, O., English, J. M., Irvine, P. J., Jones, A., Lawrence, M. G., MacCracken, M., Muri, H., Moore, J. C., Niemeier, U., Phipps, S. J., Sillmann, J., Storelvmo, T., Wang, H., and Watanabe, S.: The Geoengineering Model Intercomparison Project Phase 6 (GeoMIP6): simulation design and preliminary results, Geosci. Model Dev., 8, 3379– 3392, doi:10.5194/gmd-8-3379-2015, 2015.
Lamarque, J.-F., Emmons, L. K., Hess, P. G., Kinnison, D. E., Tilmes, S., Vitt, F., Heald, C. L., Holland, E. A., Lauritzen, P. H., Neu, J., Orlando, J. J., Rasch, P. J., and Tyndall, G. K.: CAM-chem: description and evaluation of interactive at-mospheric chemistry in the Community Earth System Model, Geosci. Model Dev., 5, 369–411, doi:10.5194/gmd-5-369-2012, 2012.
Latham, J., Bower, K., Choularton, T., Coe, H., Connoly, P., Cooper, G., Craft, T., Foster, J., Gadian, A., Galbraith, L., Iacovides, H., Johnston, D., Launder, B., Leslie, B., Meyer, J., Neuker-mans, A., Ormond, B., Parkes, B., Rasch, P., Rush, J., Salter, S., Stevenson, T., Wang, H., Wang, Q., and Wood, R.: Ma-rine cloud brightening, Philos. T. R. Soc. A, 370, 4217–4262, doi:10.1098/rsta.2012.0086, 2012.
Lindzen, R. S. and Hou, A. Y.: Hadley circulations for zonally aver-aged heating centered off the equator, J. Atmos. Sci., 45, 2416– 2427, 1988.
Manabe, S. and Stouffer, R. J.: Sensitivity of a global climate model to an increase of CO2concentration in the atmosphere, J. Geo-phys. Res., 85, 5529–5554, 1980.
Marcott, S. A., Shakun, J. D., Clark, P. U., and Mix, A. C.: A reconstruction of regional and global temperature for the past 11 300 years, Science, 339, 1198–1201, 2013.
Mechoso, C., Wood, R., Weller, R., Bretherton, C. S., Clarke, A., Coe, H., Fairall, C., Farrar, J. T., Feingold, G., and Garreaud, R.: Ocean-cloud-atmosphere-land interactions in the southeast-ern Pacific: The VOCALS Program, B. Am. Meteorol. Soc., 95, 357–375, 2014.
Meehl, G. A., Arblaster, J. M., Caron, J. M., Annamalai, H., Jochum, M., Chakraborty, A., and Murtugudde, R.: Monsoon regimes and processes in CCSM4. Part I: The Asian-Australian Monsoon, J. Climate, 25, 2583–2608, 2012.
Meinshausen, M., Smith, S. J., Calvin, K., Daniel, J. S., Kainuma, M. L. T., Lamarque, J.-F., Matsumoto, K., Montzka, S. A., Raper, S. C. B., Riahi, K., Thomason, A., Velders, G. J. M., and van Vuuren, D. P. P.: The RCP greenhouse gas concentrations and their extension from 1765 to 2300, Climatic Change, 109, 213– 241, doi:10.1007/s10584-011-0156-z, 2011.
Mengis, N., Martin, T., Keller, D. P., and Oschlies, A.: As-sessing climate impacts and risks of ocean albedo modifica-tion in the Arctic, J. Geophys. Res.-Oceans, 121, 3044–3057, doi:10.1002/2015JC011433, 2016.
Atmo-sphere Model (CAM4) in forced SST and fully coupled experi-ments, J. Climate, 26, 5150–5168, 2013.
Neely III, R. R., Conley, A. J., Vitt, F., and Lamarque, J.-F.: A consistent prescription of stratospheric aerosol for both radiation and chemistry in the Community Earth System Model (CESM1), Geosci. Model Dev., 9, 2459–2470, doi:10.5194/gmd-9-2459-2016, 2016.
Poore, R. Z., Quinn, T. M., and Verardo, S.: Century-scale movement of the Atlantic Intertropical Convergence Zone linked to solar variability, Geophys. Res. Lett., 31, L12214, doi:10.1029/2004GL019940, 2004.
Rasch, P. J., Latham, J., and Chen, C. C.: Geoengineering by cloud seeding: influence on sea ice and climate system, Environ. Res. Lett., 4, 45–112, doi:10.1088/1748-9326/4/4/045112, 2009. Reason, C. J. C.: Subtropical Indian Ocean SST dipole events and
southern African rainfall, Geophys. Res. Lett., 28, 2225–2228, doi:10.1029/2000GL012735, 2001.
Robock, A.: 20 reasons why geoengineering may be a bad idea, B. Atom. Sci., 64, 14–18, doi:10.2968/064002006, 2008.
Robock, A.: Bubble, bubble, toil and trouble. An editorial comment, Climatic Change, 105, 383–385, doi:10.1007/s10584-010-0017-1, 2011.
Robock, A.: Stratospheric aerosol geoengineering, Environ. Sci. Technol., 38, 162-185, 2014.
Robock, A.: Albedo enhancement by stratospheric sul-fur injection: More research needed, Earth’s Future, 4, doi:10.1002/2016EF000407, 2016.
Seitz, R.: Bright water: hydrosols, water conservation and climate change, Climatic Change, 105, 365–381, 2010.
Siegenthaler, U., Stocker, T. F., Monnin, E., Luthi, D., Schwander J., Stauffer, B., Raynaud, D., Barnola, J. M., Fischer, H., Mas-son, Delmotte, V., and Jouzel, J.: Stable carbon cycle-climate re-lationship during the late Pleistocene, Science, 310, 1313–1317, 2005.
Suzuki, R., Behera, S. K., Iizuka, S., and Yamagata, T.: The Indian Ocean subtropical dipole simulated using a CGCM, J. Geophys. Res., 109, C09001, doi:10.1029/2003JC001974, 2004.
Taylor, K. E., Stouffer, R. J., and Meehl, G. A.: An overview of CMIP5 and the experiment design, B. Am. Meteorol. Soc., 93, 485–498, doi:10.1175/BAMS-D-11-00094.1, 2012.
Tilmes, S., Fasullo, J., Lamarque, J.-F., Marsh, D. R., Mills, M., Al-terskjaer, K., Muri, H., Kristjánsson, J. E., Boucher, O., Schulz, M., Cole, J. N. S., Curry, C. L., Jones, A., Haywood, J., Irvine, P. J., Ji, D., Moore, J. C., Karam, D. B., Kravitz, B., Rasch, P. J., Singh, B., Yoon, J.-H., Niemeier, U., Schmidt, H., Robock, A., Yang, S., and Watanabe, S.: The hydrological impact of geoengineering in the Geoengineering Model Intercomparison Project (GeoMIP), J. Geophys. Res.-Atmos, 118, 11036–11058, doi:10.1002/jgrd.50868, 2013.
Tilmes, S., Mills, M. J., Niemeier, U., Schmidt, H., Robock, A., Kravitz, B., Lamarque, J.-F., Pitari, G., and English, J. M.: A new Geoengineering Model Intercomparison Project (GeoMIP) experiment designed for climate and chemistry models, Geosci. Model Dev., 8, 43–49, doi:10.5194/gmd-8-43-2015, 2015. Tilmes, S., Lamarque, J.-F., Emmons, L. K., Kinnison, D. E.,
Marsh, D., Garcia, R. R., Smith, A. K., Neely, R. R., Conley, A., Vitt, F., Val Martin, M., Tanimoto, H., Simpson, I., Blake, D. R., and Blake, N.: Representation of the Community Earth System Model (CESM1) CAM4-chem within the Chemistry-Climate Model Initiative (CCMI), Geosci. Model Dev., 9, 1853– 1890, doi:10.5194/gmd-9-1853-2016, 2016.
Trenberth, K. E., and Dai, A.: Effects of Mount Pinatubo volcanic eruption on the hydrological cycle as an ana-log of geoengineering, Geophys. Res. Lett., 34, L15702, doi:10.1029/2007GL030524, 2007.
Wood, R. and Bretherton, C. S.: Boundary layer depth, entrainment, and decoupling in the cloud-capped subtropical and tropical ma-rine boundary layer, J. Climate, 17, 3576–3588, 2004.
Wood, R. and Bretherton, C. S.: On the relationship between strat-iform low cloud cover and lower-tropospheric stability, J. Cli-mate, 19, 6425–6432, 2006.
Xia, L., Robock, A., Tilmes, S., and Neely III, R. R.: Stratospheric sulfate geoengineering could enhance the terrestrial photosynthe-sis rate, Atmos. Chem. Phys., 16, 1479–1489, doi:10.5194/acp-16-1479-2016, 2016.