www.ache.org.rs/CICEQ
Chemical Industry & Chemical Engineering Quarterly 18 (2) 233−243 (2012) CI&CEQ
AMINODDIN HAJI1
RUHOLLAH SEMNANI
RAHBAR2
1Textile Engineering Department,
Birjand Branch, Islamic Azad University, Birjand, Iran 2
Textile Engineering Department, Amirkabir University of Technology, Tehran, Iran
SCIENTIFIC PAPER
UDC 677.742.01 DOI 10.2298/CICEQ111020064H
STRUCTURE EVOLUTION AND MECHANICAL
BEHAVIOR OF POLY (ETHYLENE
TEREPHTHALATE) FIBERS DRAWN
AT DIFFERENT NUMBER OF
DRAWING STAGES
In this work, the structure, mechanical and thermal properties of PET fiber ob-tained by hot multi-stage drawing have been investigated in terms of their dependence on the number of drawing steps at an equivalent total draw ratio. Differential scanning calorimetry, birefringence, wide-angle x-ray diffraction, FTIR spectroscopy, tensile properties, and taut-tie molecules were used to characterize the fine structure and physical properties of the fibers. Results have been explained in terms of a higher drawing residence time at an equiva-lent drawing speed. For single stage drawn fiber, a high tensile strength is obtained, whereas a high initial modulus is obtained for fiber drawn at -stage drawing. According to the results, an important finding is that three-stage drawing process has the potential to produce high-modulus fibers. The enhanced fraction of taut-tie molecules is found in three-stage drawn fiber, which is believed to be one of the important factors leading to the high mo-dulus achieved in fibers drawn in hot multistage.
Keywords: hot drawing process, PET fiber, orientation, crystallinity, fraction of taut tie molecule.
Poly(ethylene terephthalate) (PET) is a semi-crystalline polymer of considerable commercial impor-tance that has various applications in fiber, film, or bottle form. PET fibers are generally produced by melt spinning. Fibers produced by this process may not have the required crystallinity or molecular orien-tation to provide specific mechanical properties. Ex-tensive studies of structure formation of PET during deformation have been carried out [1-17]. It has been well documented that controlled molecular orientation and microstructure formation in polymers gives rise to a change in tensile properties. Substantial improve-ments in the mechanical properties of PET fibers have been achieved by drawing. During the drawing pro-cess, structural parameters such as crystallinity, crys-tal perfection, cryscrys-tal size, cryscrys-tal orientation and amorphous orientation are altered [18].
Correspondening author: A. Haji; Textile Engineering Depart-ment, Birjand Branch, Islamic Azad University, Birjand, Iran. E-mail: [email protected]
Paper received: 20 October, 2011 Paper revised: 13 December, 2011 Paper accepted: 25 December, 2011
As-spun fibers have been drawn in several ways, from single-stage to three-stage drawing. Several re-ferences report that multi-stage drawing produced fi-ber that had better mechanical properties than single-stage drawing [19-22]. The morphology created upon hot-multistage drawing is critical for the properties achieved. Hot multi-stage drawing of fibers involves stretching in several successive steps in which a small amount of stretching occurs in each step. The hot multi-stage drawing is controlled by manipulating the machine variables such as drawing speed, tempe-rature of heated elements, draw ratio, number of drawing steps, etc.
EXPERIMENTAL
Preparation of samples
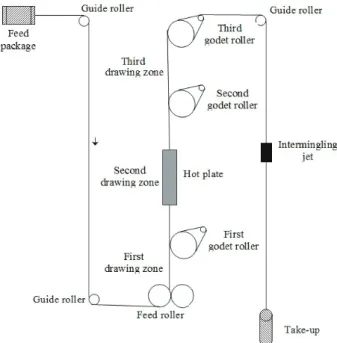
Low oriented PET yarn (LOY), 167 dtex (weight in grams of 10000 m filament), 34 filaments, was kindly supplied by Alyaf Co. (Iran). The as-spun fibers were made with PET with an intrinsic viscosity (IV) = = 0.65 dL/g as quoted by manufacturer. The as-spun fibers were collected at take-up velocity of 800 m/min. This kind of fiber has high capacity for stretching. The drawing was performed on an industrial Zinser draw-twisting machine (Germany), type 520-2. First, as- -spun fiber was drawn in single stage to the maximum draw ratio before breaking (DR = 5.140), and this de-termined draw ratio was selected as a total draw ratio for drawing in two-stage and three-stage drawing pro-cesses. The drawing setup is shown schematically in Figure 1. The different draw ratios of the drawn samp-les are shown in Table 1. The total draw ratio is cal-culated by multiplication of the draw ratios employed. The applied drawing conditions are listed in Table 2. These conditions were deduced from preliminary ex-periments.
Figure 1. Schematic diagram of hot multistage drawing system.
Methods
Yarn linear density (expressed in dtex) was de-termined in accordance with ASTM D 1577-96. Mean values are the average of five measurements.
Differential scanning calorimetry (DSC) curves were recorded on a DSC 2010 machine (TA Instru-ments, New Castle, DE, USA) to examine the thermal behavior of multifilament yarns. Approximately 5 mg of sample was used and the measurements of the samples were performed by heating from 20 to 300 °C at a rate of 10 °C/min under nitrogen atmosphere. From the heat of fusion, an apparent crystallinity (X) was determined by the following equation:
f c C
f
(%) 100 H H
X
H Δ − Δ =
Δ (1)
where XC is crystallinity percentage, ΔHf refers to the measured melting enthalpy, ΔHc is the crystallization enthalpy induced during DSC test and ΔHf° refers to 100% crystalline polymer, which in the case of PET equals to 140.1 J/g [23].
Fourier transform infrared (FTIR) measurements were recorded on a Nicolet 670 instrument over the range of 4000-400 cm-1 using a resolution of 4 cm-1. The powdered samples were dispersed in KBr and pressed into pellets for these measurements. An ave-rage of 40 scans was recorded in the transmission mode.
Birefringence was measured on a Ziess polari-zing microscope with a 30th order tilting compensator. The average birefringence was based on five indivi-dual fiber samples. The same microscope was used to measure the diameter of the fibers.
The wide-angle X-ray diffraction (WAXD) pat-terns of finely powdered samples were obtained by using a EQUINOX 1000 X-ray diffractometer (Inel, France) equipped with a nickel-filtered CuKα radiation (λ = 1.540 Å). The scattering intensities were re-corded every 0.031° in the range of 2θ = 10-35°. The equatorial diffraction profile was fitted into three Pear-son VII functional crystalline peaks according to Heu-vel and Huisman [24] with two Gaussian functional amorphous peaks at 17.5 and 23.5°, as reported by Murthy et al. [25].
The WAXD patterns were analyzed by curve-fit-ting procedure to obtain crystallinity and crystalline
Table 1. Applied draw ratios in different stages of a multistage drawing process
Sample 1st Stage draw ratio 2nd Stage draw ratio 3rd Stage draw ratio Total draw ratio
DR1 1.008 5.1 1 5.140
DR2 1.1 4.673 1 5.140
sizes. For this purpose, we used commercial software PeakFit. In the equatorial scans, first a straight line was drawn in diffractogram from 2θ = 10-35° and the area under the line was subtracted from the back-ground of the curve. No constraints were made for center and width of the peaks. An apparent crystal size (ACS) was calculated from the half-height width of the three crystalline reflections using the Scherrer Equation [26]:
cos
K
ACS λ
β θ
= (2)
where a K value of 0.94 is the correction factor for lattice distortion, λ is the X-ray wavelength, β repre-sents full width at half-maximum intensity of a pure equatorial reflection in radians, and θ is the diffraction angle.
Tensile properties were measured at 23-25 °C, 65% RH, using an EMT-3050 tensile tester (Elima Co., Iran). The cross-head speed of 500 mm/min was fixed for all measurements. The gauge lengths of 50 and 300 mm were employed for undrawn and drawn samples, respectively. From stress-strain plots, initial modulus, tenacity and percentage extension at maxi-mum load (breaking elongation) were evaluated. All the reported tensile properties represent the average value of the twenty readings, the sample being taken from different parts of the package.
The yarn shrinkages were measured after heat-ing a freely hung length of yarns in a circulatheat-ing air
oven controlled by an internal thermostat and moni-tored by an independent thermometer at 130 °C for 10 min according to DIN 53840, Part 1. The initial and final lengths were measured at room temperature and total shrinkage is defined as fraction of initial sample length remaining after exposure to elevated tempera-ture. The average of five measurements was reported as the shrinkage.
The fraction of taut-tie molecules (TTM) can be calculated based on a parallel series three phase mo-del with the assumption that the modulus of strained tie molecules is equal to that of the crystal along the molecular axis and obtained by the following equation [27]:
a c a a c a c c a a c
( ) ( )
(%)
( ) ( )
V E E E E E E
TTM
V E E E E E E
− − −
=
− − − (3)
where Va is the volume fraction of the amorphous region, E is the obtained modulus of sample, Ec is the crystal modulus along molecular axis (ca. 858 g/d) [28,29], and Ea is the modulus of amorphous phase except for tie molecules (ca. 18 g/d) [28].
RESULTS
Thermal analysis
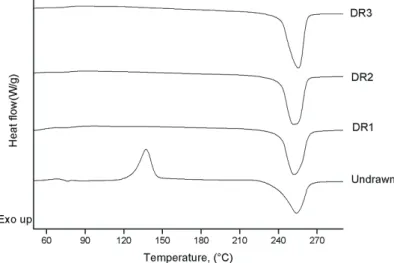
Figure 2 shows the DSC curves of the undrawn fiber and the samples drawn at different conditions. In the case of undrawn fiber, a Tg is observed. The Tg
Table 2. Operating conditions in drawing experiments
Temperature of feeding roller, °C
Temperature of first godet roller,°C
Temperature of hot plate, °C
Temperature of second godet
roller, °C
Temperature of third godet roller
°C
Drawing speed m/min
Intermingling jet pressure, bar
Spindle speed
rpm
Room temperature 50 130 130 Room
temperature 400 2 4000
occurrence is common and is observed for fibers spun at take-up speeds below 5000 m/min [30]. How-ever, it is not observed in the drawn fibers. This may be because the drawn fibers have relatively high crys-tallinity, while the crsytallinity of the as-spun fibers is only approximately 7.8% (Table 3). The DSC scan for undrawn fiber shows an exotherm at 100-150 °C that corresponds to the crystallization of amorphous mate-rial. This is absent in the drawn samples because more of the oriented material is crystallized during hot multi-stage drawing. This is in agreement with pre-vious works on PET [9,31,32].
The as-spun fiber has a broad melting range as shown in Figure 2. The broad melting range indicates the undrawn fiber possesses less uniform structure than the drawn fibers, which shows a narrow melting range. The width of the DSC peaks becomes nar-rower upon hot drawing, indicating the crystal size within the drawn samples becomes more homoge-nous. Moreover, the onset of melting temperature in-creases with drawing. Since the onset of melting tem-perature can be related to the crystal size and per-fection, it seems reasonable to say that larger crystal size and/or higher crystal perfection can be found upon hot drawing. It should be noted that during DSC measurement, samples tend to reorganize, and thus the obtained melting characteristics may not reflect the initial organization of the samples.
As can be seen in Table 3, there is no significant difference in the thermal properties of different drawn samples. It seems that the number of drawing stages did not have appreciable effect on the crystalline structures of the resultant drawn fibers.
Birefringence
The birefringence values (Δn) and filament dia-meter for undrawn and drawn fibers are plotted in Fi-gure 3. As observed, under drawing in hot condition, the filament diameter decreased substantially. The filament diameter in DR3 sample was slightly higher than those obtained for DR1 and DR2 samples. This indicated that DR3 sample contracted more on the package after drawing. The elastic behavior of the po-lymer could be the reason for this contraction. The birefringence data provided information about the overall orientation that increases upon drawing. Upon hot drawing, an increase in birefringence can be at-tributed to the orientation-induced crystallization as well as thermal-induced crystallization. For fibers drawn at single and two-stage drawing, the birefringence is higher than that value for drawn fiber at three-stage drawing. In semicrystalline polymers, crystalline and amorphous orientations are present and, assuming that the total birefringence is the sum of the crystalline and amorphous birefringence. There is no significant difference in crystallinity of the drawn samples (Table
Table 3. Thermal property characteristics of undrawn and drawn fibers
Sample Onset of melting, °C Melting temperature, °C Melting peak width, °C Crystallinity, %
Undrawn 238.2 253.9 19.1 7.80
DR1 241.4 252.7 16.1 43.31
DR2 241.4 253.6 15.6 42.14
DR3 241.5 253.5 15.4 42.19
3). On the other hand, birefringence of samples drawn at single and two-stage drawing is higher than drawn sample at three stages (Figure 3), suggesting that the crystalline and/or amorphous orientation changes with drawing. It seems that in spite of increased orientation in the crystalline region, there is some loss of orien-tation in the amorphous region due to relaxation in the fibers drawn at three stages. This led to a decrease in birefringence in this sample. It should be noted that the crystallites formed during drawing reduced the freedom of the chains to move, so decreasing the effects of the relaxation. These results suggested that no or little relaxation occurred in the fibers drawn in single and two-stages.
FTIR Analysis
FTIR spectra of the undrawn and drawn PET fi-bers are portrayed in Figure 4. Vibrational spectros-copy methods are very adequate to study conformer content. In PET structure, the ethylene glycol seg-ments coexist either in trans or gauche conformation. The trans conformation, which is related to straight parts of the molecules, can be present in both crys-talline and amorphous regions in the fibers. The gauche conformation related to disorganized parts of the mo-lecules can exist only in the amorphous region [33].
The drawing process is accompanied by confor-mation transitions. The change in the absorption ratio between the trans and gauche conformers can be used to quantify the conformational changes during drawing process. The bands near 1473, 1343, 973 and 848 cm-1 have been referred to in the literature as vibrational modes of the trans ethylene glycol of the
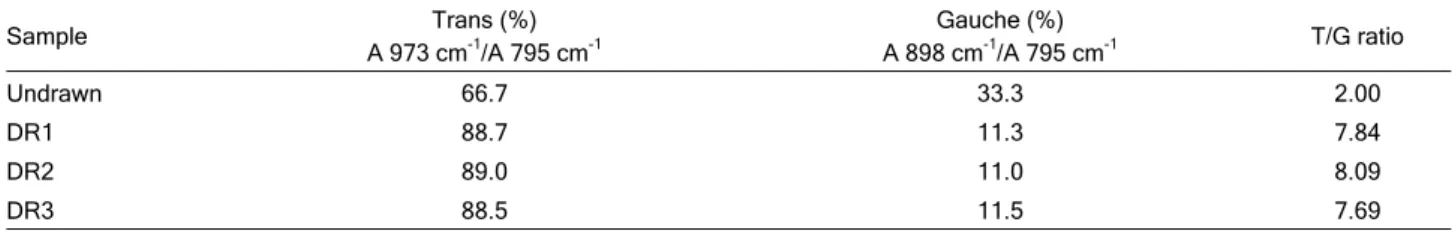
polymer chain, and the bands near 1453, 1372, 1042 and 898 cm-1 refer to the vibrations of the gauche ethylene glycol segment of the polymer chain [34,35]. For this study, the peak intensities were taken at wa-venumbers 973 cm-1 (O-CH2 stretching of the trans conformer at the ethylene glycol fragment) and 898 cm-1 (CH2 rocking of the gauche conformer) to calcu-late the relative percentage of each conformation. All of the calculated structural absorbance can be cor-rected by an internal reference which is necessary to compensate for the sample thickness. The reference band chosen should be a band independent of changes in physical structure, such as those representing trans, gauche and folded conformations. The band at 795 cm-1 was used as the internal reference band [35]. The trans (T) and gauche (G) content and struc-tural absorbance ratio (T/G) of undrawn and drawn PET fibers are shown in Table 4. It can be seen from Table 4 that the trans conformation of EG segment of PET fibers increased because of drawing. It seems that the chains located in the amorphous regions are pulled from their original and more random confor-mation to a new and more oriented one due to hot drawing. Moreover, it has been reported that the trans isomer allows a closer packing of molecules than the gauche isomer [34]. It implies that the increase in trans conformation content for the drawn samples might be associated with the increase in intermolecular packing. As can be observed from Table 4, the trans to gauche conformation ratio for the drawn samples did not show significant difference. This may be re-lated to the very similar crystallinity values of these samples as reported in Table 3.
WAXD Analysis
Equatorial X-ray diffraction patterns of the un-drawn and un-drawn samples are shown in Figure 5. The intensity curves of the equatorial scans of the drawn fibers were resolved into three crystalline peaks with two amorphous peaks. The as-spun fiber consisted predominately of the amorphous phase. This can be attributed to the very low crystallinity value in the un-drawn sample which could not be detected by X-ray diffraction. In contrast, all the drawn samples show clear crystalline reflections and three reflection planes (010), (110) and (100) were recognized. The XRD data obtained for undrawn and drawn fibers are listed in Table 5. The apparent crystal sizes of the three-stage drawn fiber are higher than those of the single and two-stage drawn fibers. Similar to the crystallinity values obtained by DSC (Table 3), the drawn fibers have essentially the same crystallinity, as shown in Table 5. The same crystallinity level and the small crystal dimensions imply that the number of crystals in the single-stage drawn fiber is greater than that of the three-stage drawn fiber. This means that the distance between crystals is shortened, i.e., shorter non-crystalline chains are formed.
Table 5. Crystal size, crystallinity and lateral order for the un-drawn and the hot un-drawn fibers
Lateral order, % Crsytallinity
% Crystal size, Å
Sample
L100
L110
L010
– –
22.62 24.64 29.74 Undrawn
20 53
28.57 27.09 41.84 DR1
19 50
27.79 28.04 41.41 DR2
17 51
31.84 31.32 51.53 DR3
The estimated crystal size along the plane normal to the (100) reflection is smaller than the (010) reflection. The dominance of the size for the (010) reflection is due to the stronger dipole-dipole interac-tions of C=O than the induced polarized interacinterac-tions of benzene molecules [36,37].
Lateral order (LO) parameter[18,38,39] can be related to several factors at same time, such as the crystallinity of the sample, reflection, size, and the distribution of the crystallites. It was calculated from the following equation:
% (1 ) 100
LO = −RF × (4)
Table 4. Percentages of trans and gauche conformations in undrawn and drawn PET fibers
Sample Trans (%)
A 973 cm-1/A 795 cm-1
Gauche (%)
A 898 cm-1/A 795 cm-1 T/G ratio
Undrawn 66.7 33.3 2.00
DR1 88.7 11.3 7.84
DR2 89.0 11.0 8.09
DR3 88.5 11.5 7.69
where RF is the resolution factor, which is given by the following expression:
1 2 3 1 1 2 3
2 ...
...
n n
m m m m
RF
h h h h
−
+ + + +
=
+ + + + (5)
where m1, m2, etc., are the heights of minima from the appropriate base line, and h1, h2, etc. are the heights of maxima from the same base line. Therefore, the resolution factor for PET fibers can be written as:
1 2 1 2 3
2
m m
RF
h h h
+ =
+ + (6)
where m1 and m2 corresponds to the minima between the planes (010) and (110) and the between planes (110) and (100), respectively; h1, h2, and h3 are the observed maxima diffraction peaks corresponding to the planes (010), (110) and (100).
Some authors [18,38] have used this parameter in substitution with the crystalline index measure-ment. In this case, it is being considered the total order rather than the absolute crsytallinity of the sample, due to its dependence to several crystalline parameters as already explained. A decrease in the
LO for the three-stage drawn sample could be ex-plained by the observed decrease in the crystallinty and/or total order of the system. A decrease in bire-fringence value of the three-stage drawn fiber (Figure 3) is also contributing to the loss of its total order. The formation of new crystallites within extended noncrys-talline domains of PET is responsible for the increase in LO parameter of single-stage drawn fiber.
Tensile properties
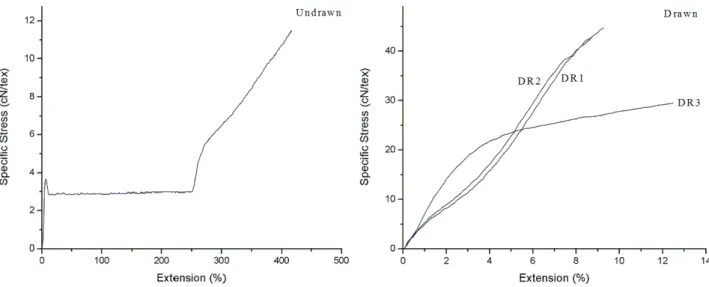
Figure 6 shows typical specific stress-extension curves of as-spun and drawn fibers. Three-stage drawn fibers showed distinctly different response to
the tensile load compared to the single and two-stage drawn fibers. The three-stage drawn fiber has higher and distinct yield behavior in the tensile test. The yield strength was calculated by identifying a point which is deviated from the initial linear region. It seems that the multistage drawing caused to the arrangements of the amorphous and crystalline region in parallel rather than in series. This parallel arrangement increased the yield strength, because in this case there are more tie molecules arranged in parallel than in series.
Tenacity, extension at break, and initial modulus of the undrawn and drawn fibers are shown in Figures 7-9, respectively. As can be seen in Figures 7 and 8, tenacity and initial modulus of the drawn samples both increased relative to their respective as-spun fiber. The highest tenacity value obtained for DR1 fol-lowed by DR2 and DR3. The tenacity value of the three-stage drawn sample is significantly lower than the other ones. The DR1 and DR2 samples show the same value for extension at break which is lower than that of obtained for the DR3 sample (Figure 9). An increase in the number of drawing steps gives rise to a significant increase in initial modulus value. The ini-tial modulus value of 748 cN/tex obtained for the DR3 sample is markedly higher than those obtained for the DR1 and DR2 samples. It has been shown that three- -stage drawing process produced fibers having lower tenacity and higher modulus when compared to the single and two-stage drawing processes at an equiva-lent total draw ratio. According to Figure 3, the three- -stage drawn fiber shows the least birefringence value among the samples as well as the drawn samples had the same crystallinity value (Table 3). So the higher initial modulus and lower tenacity values for the DR3 sample cannot be explained simply by crys-tallinity and orientation values. We will discuss the structure-property relationships in Discussion section.
Figure 7. Tenacity of the undrawn and hot drawn PET fibers.
Figure 8. Initial modulus of the undrawn and hot drawn PET fibers.
Figure 9. Extension at break of the undrawn and hot drawn PET fibers.
It should be noted that tensile modulus reflects the average of the structure, whereas tensile strength relates more to the weakest position in the structure. The drawing process improves the tensile modulus but also introduces defects such as inhomogenities and voids. These defects have little effect on the mo-dulus, which involves low strain, but play a significant role in tenacity, which is measured at the limiting strain of the material.
Shrinkage
Free shrinkage experiments were performed to investigate the changes of organization of the amor-phous phase depending on distribution of draw ratio in hot multi-stage drawing. As can be seen in Figure 10, the highest shrinkage values occurred at sample drawn in three-stage drawing. The pronounced shrink-age of the fibers drawn at three-stshrink-age drawing points to a high degree of molecular orientation present in the amorphous phase. Again, it could not be possible to explain the shrinkage results simply by crsytallinity and orientation. We will back to this case in Dis-cussion section.
Figure 10. Shrinkage values of the undrawn and hot drawn PET fibers.
DISCUSSION
mo-lecular mobility of PET fiber chains and the relaxation time was enhanced due to large heating time. So the chains were easy to disorientate, resulting in the de-crease of orientation in three-stage drawn sample (Fi-gure 3). In single and two stage drawing, there was not enough time for relaxation and therefore stress induced crystallization played an important role during the drawing processes. The final orientation in three-stage drawn fiber is slightly lower than those obtained for the single and two-stage drawn fibers because the orientation process stopped sooner at this kind of drawing. This may be attributed to the formation of a crystallite network which prevented the tie chains to be fully extended. Because of high molecular mobility at block heater and second godet roller in three-stage drawing process, very little molecular orientation is re-quired to induce crystallization, and therefore signifi-cant crystallization occurred before the tie chains to be fully extended [41].
At an equivalent drawing speed (here is 400 m/min), the fibers spend a much more time for draw-ing in three-steps than in sdraw-ingle and two-steps. By considering the number of wraps of yarn around each godet roller and godet rollers speeds as given in Table 6, at drawing speed of 400 m/min, the drawing residence time on draw godet rollers is 0.28, 1.83, and 2.09 s for the DR1, DR2, and DR3 samples, res-pectively. Thus in the case of DR3 sample, much more gradual changes in molecular structure over the drawing period occurred as compared to those drawn at single and two-stage drawing at equivalent total draw ratio and drawing speed.
Table 6. Godet roller speed for yarn drawing
Godet roller speed, m/min Sample
Third Second
First
– 400
78 DR1
– 400
85 DR2
400 307
85 DR3
It seems that we have two opposing effects during three-stage drawing, i.e., the relaxation of ori-ented amorphous chains and the crystallization of amorphous chains. During hot three-stage drawing, the thermal mobility enhanced due to applying heat in second godet roller and thereby the orientation re-laxation accelerated and this effect played a dominate role during the drawing process. Higher mobility of PET molecules at elevated temperatures is respon-sible for the different structure development. How-ever, the relaxation rate of the molecules exceeds the deformation rate of the sample at high temperature.
It appears that the initial modulus is not cor-related simply to crystallinity or birefringence. In the literature, a third phase, or so-called intermediate phase, or oriented mesophase, oriented amorphous phase, or taut-tie molecular phase has been discus-sed [27,42-45]. During three-stage drawing, the ade-quate energy supplied by high temperature and also higher deformation time caused the tie molecules between the adjacent fibrils to disentanglement and orient under drawing stress.
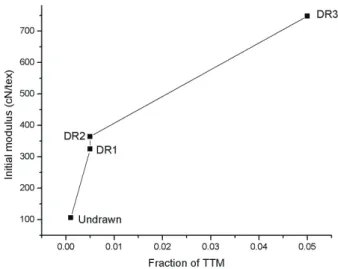
Figure 11 shows that the relationship between initial modulus and the fraction of taut-tie molecules of PET. The fraction of taut-tie chains in as-spun fiber is significantly lower than those of drawn fibers and drawing caused to transformation from folded crystal-line chains (FCC) to extended chain crystal (ECC), inducing an increase in fraction of taut-tie chains in the drawn samples. The fraction of taut-tie molecules in the three-stage drawn fiber is markedly higher than those obtained for the single and two-stage drawn fi-bers. It seems that the increase of taut-tie molecules fraction in the interfibrillar region is responsible for improving the initial modulus of three-stage drawn fi-bers.
Figure 11. The change of initial modulus with the fraction of taut-tie molecules.
lated to the lower orientation in the amorphous re-gions. The amorphous regions are the weak links in the fiber structure and therefore the lower order in these regions provides weaker links between the crystalline fibrils in the three-stage drawn sample, resulting in lower tenacity value for the DR3 sample (Figure 7).
Shrinkage is essentially an entropic phenolme-non. Shrinkage is caused mainly by randomization of strained, oriented, non-crystalline chains. Thus, a de-crease in the fraction of the oriented amorphous chains reduces shrinkage. Tomlin and colleagues [50] have noted a larger amount of interfibrillar material in-creases the free molecules farther away from the sur-face, and thus to contribute to shrinkage. Therefore, higher shrinkage in the three-stage drawn fiber could be attributed to the higher taut-tie molecules fraction in this sample.
CONCLUSION
Drawing of PET fibers at different number of steps of hot multi-stage was investigated to determine the internal structure and tensile properties. Relaxa-tion and crystallizaRelaxa-tion occur simultaneously during hot three-stage drawing. Upon three-stage drawing, more energy is available for PET chains to unfold and gradually participate in the arrangement of tie chains. By comparing the crystallinity of the samples, it was found that the number of the hot drawing stage has not a significant effect on the crystalline structures of the samples. The lowest birefringence value was ob-tained for the stage drawn fibers. The three-stage drawing process achieves the highest modulus and the lowest tenacity compared to the single and two–stage drawing of multifilament yarn. Three-stage drawing achieved a high fraction of taut-tie molecules, resulting in higher initial modulus and shrinkage va-lues compared to the single or two-stage drawn fibers at an equivalent total draw ratio. The decrease in te-nacity of the three-stage drawn fiber is related to a change in the interlamellar tie molecules and also a decrease in amorphous orientation.
Acknowledgment
The authors would like to acknowledge the fi-nancial support of Islamic Azad Uiversity, Birjand Branch.
REFERENCES
[1] N.S. Murthy, D.T. Grubb, K. Zero, C. J. Nelson, G. Chen, J. Appl. Polym. Sci. 70 (1998) 2527-2538
[2] A. Ajji, K.C. Cole, M.M. Dumoulin, I.M. Ward, Polym. Eng. Sci. 37 (1997) 1801-1808
[3] F. Chaari, M. Chaouche, J. Doucet, Polymer 44 (2003) 473-479
[4] J.F. Hotter, J.A. Cuculo, P.A. Tucker, B.K. Annis, J. Appl. Polym. Sci. 69 (1998) 2115-2131
[5] H.A. Hristov, J.W.S. Hearle, J.M. Schultz, A.D. Kennedy, J. Polym. Sci., B 33 (1995) 125-133
[6] D. Kawakami, C. Burger, S. Ran, C. Avila-Orta, I. Sics, B. Chu, S.-M. Chiao, B.S. Hsiao, T. Kikutani, Macromolecules 41 (2008) 2859-2867
[7] J.K. Keum, H.-J. Jeon, H.H. Song, J.-I. Choi, Y.-K. Son, Polymer 49 (2008) 4882-4888
[8] P. Lapersonne, J.-F. Tassin, L. Monnerie, J. Beautemps, Polymer 32 (1991) 3331-3339
[9] G. LeBourvellec, L. Monnerie, J.P. Jarry, Polymer 27 (1986) 856-860
[10] W. Okumura, Y. Ohkoshi, Y. Gotoh, M. Nagura, H. Ura-kawa, K. Kajiwara, J. Polym. Sci., B 42 (2004) 79-90 [11] J.M. Perena, R.A. Duckett, I.M. Ward, J. Appl. Polym. Sci.
25 (1980) 1381-1390
[12] F. Rietsch, R.A. Duckett, I.M. Ward, Polymer 20 (1979) 1133-1142
[13] D.R. Salem, Polymer 33 (1992) 3182-3188 [14] D.R. Salem, Polymer 33 (1992) 3189-3192
[15] H. Shirataki, A. Nakashima, K. Sato, K. Okajima, J. Appl. Polym. Sci. 64 (1997) 2631-2646
[16] L.V. Todorov, C.I. Martins, J.C. Viana, J. Appl. Polym. Sci. 120 (2011) 1253-1265
[17] T. Yamaguchi, K. Kim, T. Murata, M. Koide, S. Hitoosa, H. Urakawa, Y. Ohkoshi, Y. Gotoh, M. Nagura, M. Kotera, K. Kajiwara, J. Polym. Sci., B 46 (2008) 2126-2142
[18] N.V. Bhat, S.G. Naik, Text. Res. J. 54 (1984) 868-874 [19] A. Misra, B. Dutta, V.K. Prasad, J. Appl. Polym. Sci. 31
(1986) 441-455
[20] R.S. Rahbar, M.R.M. Mojtahedi, J. Eng. Fib. Fab. 6 (2011) 7-15
[21] G. Wu, M. Liu, X. Li, J.A. Cuculo, J. Polym. Sci., B 38 (2000) 1424-1435
[22] T. Hobbs, A.J. Lesser, Polymer 41 (2000) 6223-6230 [23] B. Wunderlich, Molecular Physics, Academic Press, New
York, 1980
[24] H.M. Heuvel, R. Huisman, K.C.J.B. Lind, J. Polym. Sci. Polym. Phys. Ed. 14 (1976) 921-940
[25] N.S. Murthy, S.T. Correale, H. Minor, Macromolecules 24 (1991)1185-1189
[26] L.E. Alexander, X-ray diffraction methods in polymer science, Wiley, New York,1969
[27] M. Kamezawa, K. Yamada, M. Takayanagi, J. Appl. Polym. Sci. 24 (1979) 1227-1236
[28] C.L. Choy, M. Ito, R.S. Porter, J. Polym. Sci. Polym. Phys. Ed. 8 (1983) 1427-1438
[29] T. Thistlethwaite, R. Jakeways, I.M. Ward, Polymer 29 (1988) 61-69
[31] M.V.S. Rao, R. Kumar, N.E. Dweltz, J. Appl. Polym. Sci. 32 (1986) 4439-4451
[32] S.A. Jabarin, Polym. Eng. Sci. 32 (1992) 1341-1349 [33] C.J.M. Van Den Heuvel, H.M. Heuvel, W.A. Fassen, J.
Veurink, L.J. Lucas, J. Appl. Polym. Sci. 49 (1993) 925-934 [34] S.-B. Lin, J. L. Koenig, J. Polym. Sci. Polym. Phys. Ed. 21
(1983) 2067-2083
[35] M. Yazdanian, I.M. Ward, H. Brody, Polymer 26 (1985) 1779-1790
[36] D. Kawakami, B.S. Hsiao, C. Burger, S. Ran, C. Avila-Orta, I. Sics, T. Kikutani, K.I. Jacob, B. Chu, Macromolecules 38 (2004) 91-103
[37] D. Kawakami, S. Ran, C. Burger, B. Fu, I. Sics, B. Chu, B. S. Hsiao, Macromolecules 36 (2003) 9275-9280
[38] D.R. Subramanian, A. Venkataraman, N.V. Bhat, J. Macromol. Sci., B 18 (1980) 177-193
[39] M.S. De Araújo, A. Lisbão Simal, J. Appl. Polym. Sci. 60 (1996) 2437-2451
[40] A. Ziabicki, Fundamentals of Fiber Formation, Wiley-In-terscience, London, 1976
[41] T. Sun, J. Pereira, R.S. Porter, J. Polym. Sci. Polym. Phys. Ed. 22 (1984) 1163-1171
[42] Y. Fu, B. Annis, A. Boller, Y. Jin, B. Wunderlich, J. Polym. Sci., B 32 (1994) 2289-2306
[43] T. Sun, A. Zhang, F.M. Li, R.S. Porter, Polymer 29 (1988) 2115-2120
[44] G. Wu, J.-D. Jiang, P.A. Tucker, J.A. Cuculo, J. Polym. Sci., B 34 (1996) 2035-2047
[45] H.A. Hristov, J.M. Schultz, J. Polym. Sci., B 28 (1990)1647- –1663
[46] P.B. Rim, C.J. Nelson, J. Appl. Polym. Sci. 42 (1991) 1807- –1813
[47] K.L. Peng, C.M. Roland, J. Polym. Sci., B 31 (1993)1339- –1345
[48] N.S. Murthy, C. Bednarczyk, P.B. Rim, C.J. Nelson, J. Appl. Polym. Sci. 64 (1997) 1363-1371
[49] R.J. Samuels, Structured Polymer Properties, John Wiley & Sons, New York, 1974
[50] D.W. Tomlin, C.M. Roland, L.I. Slutsker, J. Polym. Sci., B 31 (1993) 1331-1337.
AMINODDIN HAJI1
RUHOLLAH SEMNANI RAHBAR2
1Textile Engineering Department,
Birjand Branch, Islamic Azad University, Birjand, Iran
2
Textile Engineering Department, Amirkabir University of Technology, Tehran, Iran
NAUČNI RAD
STRUKTURNA EVOLUCIJA I MEHANI
Č
KO
PONAŠANJE POLI(ETILENTERAFTALAT) VLAKANA
IZVLA
Č
ENIH U VIŠESTEPENOM PROCESU
IZVLA
Č
ENJA
U ovom radu je analizirana zavisnost strukture, mehaničkih i toplotnih osobina PET vlakana dobijenih toplim višestepenim izvlačenjem od broja primenjenih stupnjeva
izvla-čenja pri ekvivalentnom ukupnom odnosu izvlačenja. Fina strukture i fizičke osobine vlakana su okarakterisane diferencijalnom skeninig kalorimetrijom, indeksom prelama-nja, X-analizom, FTIR spektroskopijom, zateznim osobinama i zategnutim molekulima. Rezultati su objašnjeni dužim vremenom boravka pri ekvivalentnoj brzini izvlačenja za-tegnutih vlakana. Vlakno dobijeno jednostepenim izvlačenjem ima visoku zateznu č vrs-toću, dok se vlakno dobijeno trostepenim izvlačenjem odlikuje visokim inicijalnim modu-lom. Rezultati pokazuju da trostepeni proces izvlačenja poseduje značajan potencijal za proizvodnju visokomodulnih vlakana. Povećan udeo zategnutih molekula se može naći u vlaknima dobijenim trostepenim procesom izvlačenja vlakna, za koji se veruje da je je-dan od važnih faktora koji dovode do visokog modula vlakana dobijenim višestepenim toplim izvlačenjem.