ACPD
11, 22619–22662, 2011Determination of the biogenic SOA fraction in the boreal
forest
E. Finessi et al.
Title Page
Abstract Introduction
Conclusions References
Tables Figures
◭ ◮
◭ ◮
Back Close
Full Screen / Esc
Printer-friendly Version Interactive Discussion
Discussion
P
a
per
|
Dis
cussion
P
a
per
|
Discussion
P
a
per
|
Discussio
n
P
a
per
|
Atmos. Chem. Phys. Discuss., 11, 22619–22662, 2011 www.atmos-chem-phys-discuss.net/11/22619/2011/ doi:10.5194/acpd-11-22619-2011
© Author(s) 2011. CC Attribution 3.0 License.
Atmospheric Chemistry and Physics Discussions
This discussion paper is/has been under review for the journal Atmospheric Chemistry and Physics (ACP). Please refer to the corresponding final paper in ACP if available.
Determination of the biogenic secondary
organic aerosol fraction in the boreal
forest by AMS and NMR measurements
E. Finessi1, S. Decesari1, M. Paglione1, L. Giulianelli1, C. Carbone1,
S. Gilardoni1, S. Fuzzi1, S. Saarikoski2, T. Raatikainen2,8, R. Hillamo2, J. Allan3, Th. F. Mentel4, P. Tiitta5,9, A. Laaksonen2,5, T. Pet ¨aj ¨a6, M. Kulmala6,
D. R. Worsnop2,6,7, and M. C. Facchini1
1
Institute for Atmospheric Sciences and Climate (ISAC), National Research Council (CNR), Bologna, Italy
2
Finnish Meteorological Institute (FMI), Helsinki, Finland
3
National Centre for Atmospheric Science & School of Earth, Atmospheric & Environmental Sciences, The University of Manchester, Manchester, UK
4
ACPD
11, 22619–22662, 2011Determination of the biogenic SOA fraction in the boreal
forest
E. Finessi et al.
Title Page
Abstract Introduction
Conclusions References
Tables Figures
◭ ◮
◭ ◮
Back Close
Full Screen / Esc
Printer-friendly Version Interactive Discussion
Discussion
P
a
per
|
Dis
cussion
P
a
per
|
Discussion
P
a
per
|
Discussio
n
P
a
per
|
5
Department of Applied Physics, University of Eastern Finland (UEF), Kuopio, Finland
6
Department of Physics, University of Helsinki, Finland
7
Aerodyne Research, Inc. Billerica, MA, USA
8
School of Earth and Atmospheric Sciences, Georgia Institute of Technology, Atlanta, GA, USA
9
Atmospheric Chemistry Research Group, North-West University, Potchefstroom, South Africa
Received: 7 July 2011 – Accepted: 3 August 2011 – Published: 10 August 2011
Correspondence to: E. Finessi ([email protected])
Published by Copernicus Publications on behalf of the European Geosciences Union.
ACPD
11, 22619–22662, 2011Determination of the biogenic SOA fraction in the boreal
forest
E. Finessi et al.
Title Page
Abstract Introduction
Conclusions References
Tables Figures
◭ ◮
◭ ◮
Back Close
Full Screen / Esc
Printer-friendly Version Interactive Discussion
Discussion
P
a
per
|
Dis
cussion
P
a
per
|
Discussion
P
a
per
|
Discussio
n
P
a
per
|
Abstract
The study investigates the sources of fine organic aerosol (OA) in the boreal forest, based on measurements including both filter sampling (PM1) and online methods and
carried out during a one-month campaign held in Hyyti ¨al ¨a, Finland, in spring 2007. Two aerosol mass spectrometers (Q-AMS, ToF-AMS) were employed to measure
on-5
line air mass concentrations of major non-refractory aerosol species, while the water extracts of the filter samples were analyzed by nuclear magnetic resonance (NMR) spectroscopy for organic functional group characterization of the polar organic fraction of the aerosol. AMS and NMR spectra were processed separately by non-negative factorization algorithms, in order to apportion the main components underlying the
10
submicrometer organic aerosol composition and depict them in terms of both mass fragmentation patterns and functional group compositions.
The NMR results supported the AMS speciation of oxidized organic aerosol (OOA) into two main fractions, which could be generally labelled as more and less oxidized organics. The more oxidized component was characterized by a mass spectrum
dom-15
inated by the m/z 44 peak, and in parallel by a NMR spectrum showing aromatic and aliphatic backbones highly substituted with oxygenated functional groups (car-bonyls/carboxyls and hydroxyls). Such component, contributing on average 50 % of the OA mass throughout the observing period, was associated with pollution outbreaks from the Central Europe. The less oxidized component showed features consistent with
20
less oxygenated aerosols and was enhanced in concomitance with air masses origi-nating from the North-to-West sector, in agreement with previous investigations con-ducted at this site. NMR factor analysis was able to separate two distinct components under the less oxidized fraction of OA. One of these NMR-factors was associated to the formation of terrestrial biogenic secondary organic aerosol (BSOA), based on the
25
ACPD
11, 22619–22662, 2011Determination of the biogenic SOA fraction in the boreal
forest
E. Finessi et al.
Title Page
Abstract Introduction
Conclusions References
Tables Figures
◭ ◮
◭ ◮
Back Close
Full Screen / Esc
Printer-friendly Version Interactive Discussion
Discussion
P
a
per
|
Dis
cussion
P
a
per
|
Discussion
P
a
per
|
Discussio
n
P
a
per
|
biogenic organic aerosols in Hyyti ¨al ¨a by oxidation and condensation mechanisms: re-active terpenes emitted by the boreal forest and compounds of marine origin, with the latter relatively more important when predominantly polar air masses reach the site.
This study is an example of how spectroscopic techniques, such as proton NMR, can add functional group specificity for certain chemical features (like aromatics) of OA with
5
respect to AMS. They can therefore be profitably be exploited to complement aerosol mass spectrometric measurements in organic source apportionment studies.
1 Introduction
Atmospheric aerosol particles directly impact air quality, visibility and the radiation bal-ance of the Earth, which in turn contributes to regulating the climate system on both
10
regional and global scales (Ravishankara, 2005; IPCC, 2007). Since organic com-pounds constitute a large fraction of submicrometer particles mass on the global scale, up to 90 % (Kanakidou et al., 2005; Zhang et al., 2007), their accurate quantification and source apportionment are necessary in order to determine their role in the above environmental issues and define efficient abatement strategies.
15
Secondary organic aerosols (SOA), formed by gas-to-particle conversion of oxidized vapors, and other oxygenated organic aerosols formed by chemical ageing of existing particles (Fuzzi et al., 2005), are expected to contribute to a large fraction of total or-ganic particulate mass outside urban areas (Baltensperger et al., 2005; Lanz et al., 2007). Nevertheless, current estimates of global SOA production remain inaccurate.
20
They vary by over 2 orders of magnitude, because they are not well constrained by or-ganic source apportionment studies (Simpson et al., 2007). The importance of biogenic sources is thought to be significant, given that global emissions of biogenic volatile or-ganic compounds (BVOCs) are up to ten times greater than those from anthropogenic sources (Calvert, 2002; Atkinson and Arey, 2003; Guenther et al., 1995). It is estimated
25
that biogenic volatile organic compound (BVOC) oxidation represents the largest SOA global source, ranging from 12 to 70 Tg yr−1(Hallquist et al., 2009).
ACPD
11, 22619–22662, 2011Determination of the biogenic SOA fraction in the boreal
forest
E. Finessi et al.
Title Page
Abstract Introduction
Conclusions References
Tables Figures
◭ ◮
◭ ◮
Back Close
Full Screen / Esc
Printer-friendly Version Interactive Discussion
Discussion
P
a
per
|
Dis
cussion
P
a
per
|
Discussion
P
a
per
|
Discussio
n
P
a
per
|
Combined experimental and modelling studies have investigated the formation of SOA from the photo-oxidation of several simple VOCs, such as alkyl-benzenes and terpenoids, obtaining a considerable amount of data for controlled (laboratory) condi-tions (Surratt et al., 2010; Paulot et al., 2009; Rickard et al., 2009; Cao et al., 2008; Ng et al., 2007; Song et al., 2007; Johnson et al., 2004). The evaluation of SOA formation
5
mechanisms in the field remains challenging because of multiple contributing sources, variable oxidant concentrations and composition, and the contribution of background gases and aerosols (De Gouw and Jimenez, 2009).
The elucidation of SOA chemical composition in ambient air, believed to encompass several hundreds of thousands of individual compounds (Goldstein and Galbally, 2007),
10
represents a major challenge for state-of-the-art analytical techniques. The recovery of gas-chromatographic/mass spectrometric (GC/MS) techniques with respect to to-tal aerosol organic carbon (OC) is normally below 15 % (Cahill et al., 2006). Hence, organic source apportionment methods based on GC/MS techniques rely on the ex-istence of source-specific molecular markers that are stable under atmospheric
con-15
ditions (Schauer et al., 1996; Claeys et al., 2004). However, the actual stability of important molecular markers, such as levoglucosan, has been questioned by recent observations (Capes et al., 2008).
An alternative approach is based on the integral chemical features of OC (e.g. mass fragments, functional groups, elemental ratios, isotopic ratios, ions, etc.) rather than
20
on individual species. Such a bulk approach has been proposed by using Fourier transform infrared (FTIR) (Russell et al., 2010, 2011) and proton nuclear magnetic resonance (1H-NMR) spectroscopies (Decesari et al., 2007, 2011). Most widespread applications exploit aerosol mass spectrometry (AMS) coupled with multivariate statis-tical analysis methods for the decomposition of the mass spectra timeline into
con-25
ACPD
11, 22619–22662, 2011Determination of the biogenic SOA fraction in the boreal
forest
E. Finessi et al.
Title Page
Abstract Introduction
Conclusions References
Tables Figures
◭ ◮
◭ ◮
Back Close
Full Screen / Esc
Printer-friendly Version Interactive Discussion
Discussion
P
a
per
|
Dis
cussion
P
a
per
|
Discussion
P
a
per
|
Discussio
n
P
a
per
|
(Zhang et al., 2005a, b, 2007), and positive matrix factorization (PMF) (Lanz et al., 2007; Ulbrich et al., 2009; Paatero et al., 1994). The most commonly identified PMF-AMS factors have been named hydrocarbon-like organic aerosol (HOA) and oxy-genated organic aerosol (OOA), and are thought to be strongly linked to primary and secondary organic aerosol (POA and SOA), respectively. In some environments, OOA
5
are further split into different types, including a more oxidized type, or OOA1, and a less oxidized one, OOA2, also called low-volatility and semivolatile oxidized organic aerosols, LV-OOA and SV-OOA, on the basis of parallel measurements of particle volatility and chemical composition (Jimenez et al., 2009).
Even if important insights on OA composition have been obtained so far, they are
10
often method-dependent, i.e. affected by the sensitivity of the employed methodology to specific chemical features of aerosol OC. Since each technique has its own strengths and weaknesses, a complementary approach is highly recommended.
The present manuscript explores the variability of organic aerosol composition dur-ing an intensive EUCAARI (Kulmala et al., 2009; Kerminen et al., 2010) field study
15
held in spring 2007 in Hyyti ¨al ¨a (Finland), employing 1H-NMR and AMS characteri-zation methods. The NMR analysis complements here the AMS charactericharacteri-zation by providing information on the functionalities, which are not speciated well by the AMS. On the other hand, AMS permits OA to be analysed at a higher time resolution. For the attribution of spectral fingerprints to natural and anthropogenic sources, use was
20
made of data acquired during reaction chamber experiments performed in the SAPHIR facility, J ¨ulich.
2 Experimental
Submicrometer aerosol particles were sampled during a one-month campaign in spring 2007 at the Finnish Station for Measuring Forest Ecosystem–Atmosphere Relations
25
(SMEAR II, Hari and Kulmala, 2005; http://www.atm.helsinki.fi/SMEAR/) located in Hyyti ¨al ¨a (61◦51′N, 24◦17′E, 181 m a.s.l.). This forestry station is located in the middle
ACPD
11, 22619–22662, 2011Determination of the biogenic SOA fraction in the boreal
forest
E. Finessi et al.
Title Page
Abstract Introduction
Conclusions References
Tables Figures
◭ ◮
◭ ◮
Back Close
Full Screen / Esc
Printer-friendly Version Interactive Discussion
Discussion
P
a
per
|
Dis
cussion
P
a
per
|
Discussion
P
a
per
|
Discussio
n
P
a
per
|
of a more than 40-year old Scots pine stand (Pinus Sylvestris L.), which homoge-neously surrounds the site for several hundreds meters. Tampere is the largest neigh-bouring city and is situated about 60 km S-SW. Measurements were carried out from 27 March to 17 May 2007. However, the present work focuses on the collection period of PM1filter samples analyzed by
1
H-NMR spectroscopy, i.e. the days from 29 March
5
to 19 April.
2.1 Aerosol measurements
Atmospheric particles were sampled by a suite of co-located online instruments throughout the campaign. A twin Differential Mobility Particle Sizer (DMPS) continu-ously monitored the size distribution of submicrometer aerosol particles and its
evo-10
lution with a 10 min time resolution (Aalto et al., 2001). Real-time measurements of the concentrations of non-refractory PM1 aerosol organic matter and inorganic ions
including sulphate, nitrate, ammonium and chloride were performed by two aerosol mass spectrometers running in parallel: (a) an Aerodyne Quadrupole Aerosol Mass Spectrometer (Q-AMS), and (b) a High Resolution Time-of-Flight Aerosol Mass
Spec-15
trometer (ToF-AMS). A thorough description of the instruments and associated calibra-tion and operacalibra-tion procedures is provided elsewhere (Jayne et al., 2000; Allan et al., 2003; Jimenez et al., 2003; Alfarra et al., 2004; De Carlo et al., 2006; Canagaratna et al., 2007). During the campaign, the ToF-AMS suffered from some technical prob-lems thus the Q-AMS data are used here for the absolute concentrations. However,
20
because of the higher spectral resolution, the ToF-AMS provided useful data for the interpretation of the presented data set.
The Q-AMS measurements started in early March and measurements continued up to the end of June, although here we focus on the NMR data taken in the period from 29 March to 19 April. Before 4 April the Q-AMS was operated by alternating between
25
ACPD
11, 22619–22662, 2011Determination of the biogenic SOA fraction in the boreal
forest
E. Finessi et al.
Title Page
Abstract Introduction
Conclusions References
Tables Figures
◭ ◮
◭ ◮
Back Close
Full Screen / Esc
Printer-friendly Version Interactive Discussion
Discussion
P
a
per
|
Dis
cussion
P
a
per
|
Discussion
P
a
per
|
Discussio
n
P
a
per
|
of every hour was spent on flux measurements, and during the remaining 30 min the Q-AMS was alternating between MS, pTOF and jump mass spectrum (JMS) modes (Crosier et al., 2007). Because only one sixth of the time was spent on mass concen-tration (the MS mode) measurements, the Q-AMS data increased in noise. Therefore, they are presented here as 30 min averages.
5
The so-obtained Q-AMS total mass concentrations compare fairly well with total par-ticle volume calculated from parpar-ticle size distributions (DMPS). However, it seems that the AMS/DMPS ratio changed during the 4–6 April break, when the AMS was prepared for flux measurements, being about 0.4 and 0.8 before and after the break, respectively. The most likely explanation for this is a bending of the particle inlet, which may have
10
led to the loss of particles. Ionization efficiency changes are unlikely, because the air beam signal did not change during this period.
The concentrations of major ionic species in submicrometer particles were also de-termined by a Particle-into-Liquid Sampler (PILS; Metrohm Peak Inc) coupled with two ion chromatographs (IC; Dionex ICS-2000) and using a virtual impactor (VI; Loo and
15
Cork, 1988) with a cut-off size of 1.3 µm prior to the PILS-ICs system (Orsini et al., 2003).
A high volume sampler (HiVol) working at 850 l min−1and configured to remove par-ticles with aerodynamic diameter larger than 1 µm was employed from 29 March to 19 April to collect fine particles on quartz-fiber filters (12 cm diameter, QMA grade).
20
The quartz-fiber filters were washed with Milli-Q water and heated for 1 h at 800◦C before sampling to reduce blank values. After sampling, lasting on average 10 h, the collected PM1filters were stored in a fridge at 4◦C until analysis.
Total Carbon (TC) content was measured directly from small sub-samples of the HiVol filters (about 2 % of sampled area) by evolved gas analysis. Measurements were
25
performed by a Multi N/C 2100 analyser (Analytik Jena, Germany) equipped with a module for solid samples, which are exposed to increasing temperature (up to 950◦C) in a pure oxygen carrier gas. Under these conditions all carbonaceous matter (organic, carbonate and elemental carbon) is converted into CO2 (Gelencser et al., 2000) and
ACPD
11, 22619–22662, 2011Determination of the biogenic SOA fraction in the boreal
forest
E. Finessi et al.
Title Page
Abstract Introduction
Conclusions References
Tables Figures
◭ ◮
◭ ◮
Back Close
Full Screen / Esc
Printer-friendly Version Interactive Discussion
Discussion
P
a
per
|
Dis
cussion
P
a
per
|
Discussion
P
a
per
|
Discussio
n
P
a
per
|
TC is measured as total evolved CO2 by a non-dispersive infrared (NDIR) analyser. The remaining portion of each HiVol filter was extracted with deionized ultra-pure water (Milli-Q) in a sonication bath for 1 h and the water extract was filtered on PTFE mem-branes (pore size: 0.45 µm) in order to remove suspended particles. Aliquots of the wa-ter extracts were used to dewa-termine the wawa-ter-soluble organic carbon (WSOC) content
5
by a Multi N/C 2100 total organic carbon analyser (Analytik Jena, Germany) equipped with a module for liquid samples. For each sample, parallel measurements of car-bonate carbon and total organic carbon were carried out: the difference between total soluble carbon and carbonate carbon results in WSOC (Rinaldi et al., 2007). The dif-ference between TC and WSOC and carbonate carbon resulted in the water-insoluble
10
carbon (WINC).
The remaining aliquots of the water extracts were dried under vacuum and re-dissolved in deuterium oxide (D2O) for functional group characterization by
proton-Nuclear Magnetic Resonance (1H-NMR) spectroscopy (Decesari et al., 2000). The
1
H-NMR spectra were acquired at 400 MHz with a Varian Mercury 400 spectrometer in
15
5 mm probes. Sodium 3-trimethylsilyl-(2,2,3,3-d4) propionate (TSP-d4) was prevalently
used as referred internal standard, adding 50 µl of a TSP-d4 0.05 % (w/w) solution in D2O (1.5 µmol H belonging to the standard in the probe). In some cases, methanol
(MeOH) was used as internal standard (0.5 µmol H) instead of TSP-d4. 1
H-NMR spec-troscopy in protic solvents provides the speciation of hydrogen atoms bound to carbon
20
atoms. On the basis of the range of frequency shifts (the chemical shift, ppm) in which the signals occur, they can be attributed to different H-C –containing functional groups. 2.2 Factor analysis of AMS and NMR spectral data sets
The time-dependent organic mass spectra from the Q-AMS measurements were se-lected for the Positive Matrix Factorization (PMF). The analysis was performed applying
25
ACPD
11, 22619–22662, 2011Determination of the biogenic SOA fraction in the boreal
forest
E. Finessi et al.
Title Page
Abstract Introduction
Conclusions References
Tables Figures
◭ ◮
◭ ◮
Back Close
Full Screen / Esc
Printer-friendly Version Interactive Discussion
Discussion
P
a
per
|
Dis
cussion
P
a
per
|
Discussion
P
a
per
|
Discussio
n
P
a
per
|
was performed as described in Ulbrich et al. (2009). The PMF analysis turned out to be quite difficult due to noisy data series, a leak of air signal (m/z 28) to organic
m/z 29, an electronic interference problem manifested as a transient series of peaks withm/z 10 difference, and relatively low variations in organic oxidation state, at least compared with the 2005 data series (Raatikainen et al., 2010). Zero-averaged noise
5
was not in itself a problem, merely decreasing the relative error (Q/Qexp) to a value
much lower than one. An additional explanation for the low Q/Qexp is that original single ion noise may have been overestimated. To avoid finding a noise factor, the
m/z 29 peak was down weighted by a factor of five. In order to try to remove the periodic electronic interference explicitly, test calculations were performed where one
10
factor was allowed to vary without the non-negativity constraint. This interference was found to vary around zero. To investigate numerical stability, the PMF solution space was explored by varying seeds, numbers of factors (1–5), and rotational parameter FPEAK. After this processing, it was very clear that a good solution could not be found for more than two factors. Indeed, a two-component PMF analysis, where the factors
15
were identified as OOA1 and OOA2 provided reasonable solutions having fairly iden-tical concentration time series andQ/Qexp values for FPEAK values from−0.4 to 0.4.
The main difference between these solutions is the fraction of m/z 44 peak (f44) of OOA2 ranging from 0.00 to 0.08, for FPEAK greater than−0.08 and lower than−0.16,
respectively. An average solution with OOA2 f44=0.04 and FPEAK=−0.12 was thus
20
selected as the final solution, being zero f44 values not expected.
Like the Q-AMS, the ToF-AMS was able to resolve two factors reliably: OOA1 and OOA2. The additional variance provided by higher-order solutions did not show any distinctly new features in the profile spectra and were deemed to be more indicative of technical issues with the instrument, such as subtle nonlinearities introduced by
25
thresholding or signal saturation. It should be noted that PMF analysis has been per-formed successfully on datasets subsequently obtained with the same instrument (Al-lan et al., 2010; Robinson et al., 2010). Therefore, the lack of additional factors should be taken as indicative of the lack of variation in total mass terms within the dataset,
ACPD
11, 22619–22662, 2011Determination of the biogenic SOA fraction in the boreal
forest
E. Finessi et al.
Title Page
Abstract Introduction
Conclusions References
Tables Figures
◭ ◮
◭ ◮
Back Close
Full Screen / Esc
Printer-friendly Version Interactive Discussion
Discussion
P
a
per
|
Dis
cussion
P
a
per
|
Discussion
P
a
per
|
Discussio
n
P
a
per
|
further supporting the conclusion that OOA1 and OOA2 were the only significant fac-tors present, limited by the short time period (two weeks) of Tof-AMS sampling. In the ToF-AMS case, a solution with FPEAK=−0.5 was chosen, as non-negative values
re-sulted in solutions where the f44 value of OOA2 was zero. It should also be borne in mind that many choices of FPEAK would probably produce valid solutions, while
nega-5
tive FPEAK values tend to produce factors whose time series are more distinct but with more similar mass spectra and vice versa for the positive values (Allan et al., 2010). In the light of the findings of Morgan et al. (2010) and Ng et al. (2010), a solution where the f44 value was non-zero was deemed more chemically meaningful. In this instance, the OOA1 factor had an f44 of 0.17 and an f43 of 0.09, while OOA2 had an f44 of 0.09
10
and an f43 of 0.12.
The NMR spectral dataset was also processed by factor analysis (FA) methodolo-gies, in order to establish contributions and spectral profiles of major components of WSOC. It should be noted that the carbon fraction insoluble in water (WINC) was not analyzed by NMR in this study. The raw NMR spectra were subjected to several
pre-15
processing steps prior to FA, in order to avoid any misleading source of variability. All the spectra were corrected for the baseline drift using a polynomial fit of the baseline in blank samples. After accurate alignment of the spectra using the internal standards as references for the chemical shift scale (Tsp-d4=0 ppm; methanol=3.36 ppm), the
peaks of contaminants identified in blank samples were systematically removed from
20
the dataset. In order to limit the effect of possible small variations in NMR peak po-sition, the original resolution of the spectra was decreased by binning over 0.03 ppm and 0.01 ppm intervals, that provided matrices of 400 and 200 points, respectively. The resulting spectral dataset was processed using three different factor analysis algo-rithms, namely: (1) the PMF 3.0v software using the multilinear engine algorithm
pro-25
ACPD
11, 22619–22662, 2011Determination of the biogenic SOA fraction in the boreal
forest
E. Finessi et al.
Title Page
Abstract Introduction
Conclusions References
Tables Figures
◭ ◮
◭ ◮
Back Close
Full Screen / Esc
Printer-friendly Version Interactive Discussion
Discussion
P
a
per
|
Dis
cussion
P
a
per
|
Discussion
P
a
per
|
Discussio
n
P
a
per
|
Since PMF also requires uncertainties, an uncertainty matrix was derived here from the noise to signal ratios of the NMR spectra. Moreover, due to constrains to the num-ber of variables in the PMF, this algorithm could be applied only to low-resolution spec-tra, 200 points, while N-NMR-GRA and MCR-ALS were employed for the factorization of both 200 and 400 points spectra.
5
3 Results and discussion
3.1 Concentrations of main submicrometer aerosol components 3.1.1 On-line measurements results
Between 29 March and 19 April, the air concentrations of the major aerosol species experienced large variations (Fig. 1). The highest organics loads were observed at the
10
beginning of the period, from 29 to 30 March, when sulphate, nitrate and ammonium concentrations also peaked, as registered by the AMS and by the PILS-IC systems. Medium to relatively high concentrations were recorded in other two episodes on 10–11 and 15–17 April. During the remaining days, the concentrations of the above aerosol components were very low: 0.49±0.54 µg m−3 (organic matter), 0.21±0.14 µg m−3
15
(sulphate), 0.05±0.05 µg m−3(nitrate) and 0.06±0.07 µg m−3 (ammonium) based on
the Q-AMS measurements. On the same days of background conditions, sodium and chloride ions showed highest concentrations, as measured by the PILS-IC system (Fig. 1b). The good correlation observed between sodium and chloride concentrations indicates that they originate mainly from sea salt.
20
The PM1 potassium ion, often used as stable tracer for biomass burning plumes
(Andreae, 1983; Ma et al., 2003), showed very high levels in the first period, between 28 and 30 March, and occurred in significant concentrations only sporadically in the remaining part of the campaign (Fig. 1c).
In order to evaluate whether these concentration time trends coincided with
25
ACPD
11, 22619–22662, 2011Determination of the biogenic SOA fraction in the boreal
forest
E. Finessi et al.
Title Page
Abstract Introduction
Conclusions References
Tables Figures
◭ ◮
◭ ◮
Back Close
Full Screen / Esc
Printer-friendly Version Interactive Discussion
Discussion
P
a
per
|
Dis
cussion
P
a
per
|
Discussion
P
a
per
|
Discussio
n
P
a
per
|
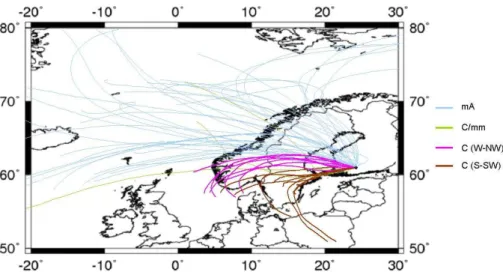
Lagrangian Integrated Trajectory, http://ready.arl.noaa.gov/HYSPLIT.php) was used to calculate back-trajectories (BTs) every day from 29 March to 19 April. A plot of the 48 h backward BTs at 500 m above ground level and calculated every 4 h, is reported in Fig. 2. The analysis of the BTs showed that higher PM1 sea salt levels were regis-tered when the site was influenced by air masses originated from the Norwegian Sea
5
and from the Arctic, while the highest aerosol mass concentrations of sulphate, nitrate, ammonium and organics occurred in concomitance with continental air masses, which is consistent with previous observations at the Hyyti ¨al ¨a station (Allan et al., 2006; Cav-alli et al., 2006; Tunved et al., 2006; Raatikainen et al., 2010). Figure 3 summarizes the chemical composition patterns averaged over periods corresponding to the main
10
BTs typologies observed, i.e. marine/Arctic (m/A), continental/modified marine (C/mm), continental from the West-to-NorthWest sector (C(W-NW)) and continental from the South-to-SouthWest sector (C(S-SW)).
The particle size distributions as measured by the DMPS (Fig. 4) appear as well to fit this preliminary classification of the observation period based on BT typologies.
15
Several new particle formation episodes were detected throughout the observation pe-riod, except for the first days when C(S-SW) prevailed and only accumulation mode particles were observed. Freshly formed particles were clearly a significant source of Aitken mode particles during the experiment, even in moderately polluted periods as C/mm and C(W-NW).
20
3.1.2 Off-line analysis results
The PM1 total carbonaceous (TC) mass concentrations spanned from less than 1 up
to 8.5 µg C m−3, as shown by filter measurements (Fig. 5, upper panel). The sam-pled carbonaceous mass was primarily constituted by polar, oxygenated compounds, while the water-soluble organics fraction (WSOC) being generally high, accounted on
25
average for more than 70 % of the total carbon.
ACPD
11, 22619–22662, 2011Determination of the biogenic SOA fraction in the boreal
forest
E. Finessi et al.
Title Page
Abstract Introduction
Conclusions References
Tables Figures
◭ ◮
◭ ◮
Back Close
Full Screen / Esc
Printer-friendly Version Interactive Discussion
Discussion
P
a
per
|
Dis
cussion
P
a
per
|
Discussion
P
a
per
|
Discussio
n
P
a
per
|
WSOC has to be multiplied by a coefficient included between 1.8 and 2.00 to be con-verted in water-soluble organic matter (WSOM).
The Q-AMS organics concentrations, averaged over the filter sampling times, are also reported in Fig. 5 for comparison. Even if well correlating throughout the whole period (R=0.93), Q-AMS OM concentrations were quite lower than filter water-soluble
5
organic matter, still pointing to some particles loss.
The functional group distributions of the NMR-detected WSOC are also reported in the lower panel of Fig. 5. Since 1H-NMR spectroscopy is mainly sensitive to protons attached to carbon atoms (i.e. H-C bonds), H/C ratios based on the stoichiometry ex-pected for each functional group (Tagliavini et al., 2006), were used to convert the
con-10
centrations of organic non-exchangeable hydrogen atoms into organic carbon concen-trations. The main functional groups identified include: (i) “alkyls” (HC-C<), i.e. aliphatic groups bound to saturated carbon atoms, such as methyls/methylenes/methynes; (ii) oxygen-containing aliphatic groups, like “carbonyls/carboxyls” (HC-C=O), i.e. alkyls adjacent to unsaturated carbon atoms, and like “hydroxyls” (HC-O), i.e. alkyls directly
15
attached to oxygen atoms such as alcohols, ethers/esters, and (iii) “aromatics” (H-Ar). In addition, nitrogen- and sulfur-containing groups, such as “amines” (HC-N), and sul-fonic groups (HC-SO3, such as methane sulfonic acid, “MSA”, were detected.
On average, the WSOC fraction comprising NMR-detectable organic carbon atoms was 50 %. The missing carbon could be due to: (a) the presence of carbons not
car-20
rying protons, as in compounds containing highly branched chains or fully substituted aryls (Moretti et al., 2008), and (b) a fraction of WSOC constituted by semi-volatile organics that may be lost during the evaporation step prior to the NMR measurement. Few laboratory tests, consisting in replicated WSOC measurements prior and after the evaporation step, showed that the carbon fraction due to the evaporation accounted
25
in average for less than 30 % of the WSOC mass. Thus it means that overall the de-tected functional groups represent the major WSOC composition. On the contrary for the samples collected in the background regime the evaporative losses resulted par-ticularly increased, reaching up to 70 % of the WSOC mass, indicating a substantial
ACPD
11, 22619–22662, 2011Determination of the biogenic SOA fraction in the boreal
forest
E. Finessi et al.
Title Page
Abstract Introduction
Conclusions References
Tables Figures
◭ ◮
◭ ◮
Back Close
Full Screen / Esc
Printer-friendly Version Interactive Discussion
Discussion
P
a
per
|
Dis
cussion
P
a
per
|
Discussion
P
a
per
|
Discussio
n
P
a
per
|
contribution of semi-volatile organics in such particles. These observations were also confirmed by OC measurements performed on a series of back up filters of PM1 sam-ples collected during the same campaign but at lower time resolution than those used for this manuscript. Indeed, the ratio of the back up OC up to the front OC resulted dramatically increased for samples collected when marine air masses prevailed.
5
3.2 Oxygenated organic aerosol composition 3.2.1 AMS factors
The time-dependent organic mass spectra recorded by the two AMSs (Q-AMS and ToF-AMS) were separately processed by the PMF methods as described in the ex-perimental section, and exploring solutions with 2 up to 5 factors. Two types of
oxy-10
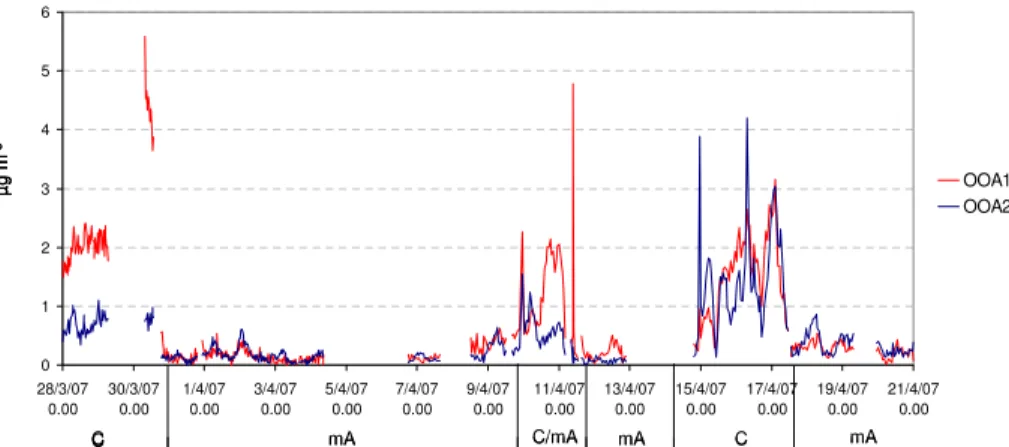
genated organic aerosol (OOA) groups, namely OOA1 and OOA2, were particularly stable within all tested solutions and accounted for most of the organic mass signal in both datasets. Concerning results from Q-AMS data, the final OOA1 and OOA2 mass spectra are shown in Fig. 6 and time series in Fig. 7.
The mass spectra of these two OOA components, with the ions at m/z 44 (CO+2)
15
dominating the OOA type 1 andm/z 43 (mostly C2H3O+) dominating the OOA type 2,
closely match those most commonly isolated in previous studies (Zhang et al., 2007; Lanz et al., 2007). Overall, they strongly resemble those found at Hyyti ¨al ¨a in spring 2005 (Raatikainen et al., 2010). In the cited studies, the OOA1 represented the more oxidized, aged organic fraction, and the OOA2 represented the less oxidized, fresher
20
secondary organics.
Other commonly found organic groups, such as hydrocarbon-like (HOA) and biomass burning organic aerosol (BBOA), were not isolated here. On average, the
m/z 57 peak, which is often related to HOA (e.g. Lanz et al., 2007) and also BBOA (Aiken et al., 2009), is less than 1 % of the total organic signal. There are a few time
25
ACPD
11, 22619–22662, 2011Determination of the biogenic SOA fraction in the boreal
forest
E. Finessi et al.
Title Page
Abstract Introduction
Conclusions References
Tables Figures
◭ ◮
◭ ◮
Back Close
Full Screen / Esc
Printer-friendly Version Interactive Discussion
Discussion
P
a
per
|
Dis
cussion
P
a
per
|
Discussion
P
a
per
|
Discussio
n
P
a
per
|
Since the unit mass resolution of the Q-AMS prevents an unambiguous identification of the ions in the mass spectra, within this dataset the oxygen content of the organic groups was estimated on the basis of the linear fit between oxygen to carbon atomic ratio (O:C) and theirm/z 44 peaks (Aiken et al., 2008). The estimated O:C ratios for the OOA1 and OOA2 isolated from the Q-AMS dataset were, respectively, 0.73 and
5
0.23. These values turned out to be very close to those obtained by Raatikainen, 2010 (i.e. 0.77±0.10 and 0.23±0.08), and were also similar to 0.73 and 0.17 averages from
several observations (Ng et al., 2010).
Unfortunately the ToF-AMS data covered mainly the second half of the campaign, overlapping with the Q-AMS and NMR data for a limited time interval, with C(W-NW)
10
and partially m/A prevailing. Nevertheless the analysis of the high-resolution ToF-AMS spectra enabled the direct determination of the molecular ratios within this time interval. Elemental analysis was performed on the W mode high resolution data according to Aiken et al. (2007, 2008). On average, the H:C ratio was estimated to be 1.36, the O:C ratio 0.64 and the OM:OC ratio 1.97. No statistically significant variation was found
15
within the measurement period. As part of the work of Robinson et al. (2010), the 82 peak was investigated specifically for signs of methylfuran, which was associated with isoprene SOA in the tropics. While a peak was identified, it was found to be much smaller compared to tropical datasets, indicating that the process was not significant in this environment.
20
3.2.2 NMR factors
A total of seventeen 1H-NMR spectra at 200 points resolution were subjected to the factorization models mentioned in the experimental section (PMF, N-NMF-GRA and MCR-ALS) and the solutions resulting from factors 2 up to 8 were explored. Within all the models, most of the variance turned out to be explained by a limited number of
25
factors, the residual of the order of the baseline noise being for more than 3 factors. The largest drop in theQ/Qexpratios was registered between two and three factors, but
additional factors continued to reduceQ/Qexptoward 1 until no strong change in slope
ACPD
11, 22619–22662, 2011Determination of the biogenic SOA fraction in the boreal
forest
E. Finessi et al.
Title Page
Abstract Introduction
Conclusions References
Tables Figures
◭ ◮
◭ ◮
Back Close
Full Screen / Esc
Printer-friendly Version Interactive Discussion
Discussion
P
a
per
|
Dis
cussion
P
a
per
|
Discussion
P
a
per
|
Discussio
n
P
a
per
|
was observable for more than five factors. Beyond five factors, two or more factors were found to be strongly correlated, suggesting that the measurements were not adequate to differentiate additional independent factors. In the following discussion, the analysis is limited to the most simple and conservative solutions with three and four factors.
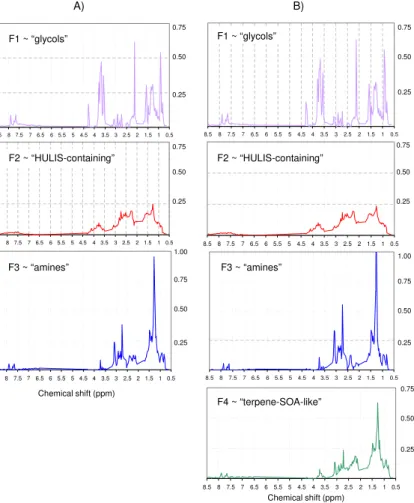
Profiles and loadings resulting for 3- and 4-factor solutions are shown in Figs. 8
5
and 9. Only profiles from a single model (MCR-ALS) are reported for sake of clarity. Concerning the factor loadings, the values obtained by the three models were generally convergent, particularly in the three factor case (Fig. 9a). Conversely, the 4-factor case appears more affected by a certain degree of rotational ambiguity of the models in splitting the F3 and F4 factors, especially for samples collected on 15 and 16 April
10
(Fig. 9b), with better results obtained with higher resolution, 400 points (not shown). The isolated NMR factors are described as follows.
F1: the first factor (hereinafter referred to as “glycols” factor) is characterized by com-pounds with hydroxyl (or ether) linkages and n-butyl chains, showing a spectrum similar to commercial butyl-glycols that, to our knowledge, finds no equivalents in other
atmo-15
spheric environments. Such factor contributed randomly to the set of samples (Fig. 9) but was completely absent in blank samples, thus excluding any filter contaminations prior/post sampling. Nonetheless positive artefacts or accidental contaminations dur-ing the sampldur-ing cannot be definitely ruled out.
F2: the second factor (hereinafter referred to as “HULIS-containing” factor) has
20
spectral features similar to those characterizing samples collected in sites impacted by anthropogenic emissions (Fig. 10a), and already reported in literature (Decesari et al., 2000, 2007). In terms of functional group distribution, polluted samples typi-cally show a more pronounced band of aromatics (visible in the range between 6.5– 8.5 ppm) with respect to samples collected in remote locations. Besides this feature,
25
ACPD
11, 22619–22662, 2011Determination of the biogenic SOA fraction in the boreal
forest
E. Finessi et al.
Title Page
Abstract Introduction
Conclusions References
Tables Figures
◭ ◮
◭ ◮
Back Close
Full Screen / Esc
Printer-friendly Version Interactive Discussion
Discussion
P
a
per
|
Dis
cussion
P
a
per
|
Discussion
P
a
per
|
Discussio
n
P
a
per
|
regime, and to a much lesser extent, it contributed to the less polluted samples col-lected in the final part of the campaign, C(W-NW). Moreover, the concentrations for this factor were positively correlated (R=0.99) with those of potassium ion, pointing again to a mix of combustion sources, i.e. long-range transported pollution/wood burn-ing products. This is in agreement with recent results from satellite-based data couplburn-ing
5
aerosol and fires, which assess wildfires in Eastern Europe with significant impacts on the fine aerosol load even in the Scandinavian region, particularly in April (Barnaba et al., 2011).
F3: the third factor (hereinafter referred to as “amines” factor) included intense peaks attributable to low-molecular weight alkyl amines, i.e. diethyl and dimethyl
10
amines (DEA, DMA), and to methane-sulphonic acid (MSA), overlapping a broad back-ground band in the aliphatic region (0.5–4.5 ppm). Such compounds (MSA and di-alkyl amines) have previously been found by the authors in clean marine OA (Fig. 10b) (Fac-chini et al., 2008; Decesari et al., 2011). Moreover, this factor accounted mainly for the OA composition when concentrations reached very low levels during the background
15
regime (m/A), but it also contributed to the rise of concentrations during the last days of the sampling period, C (W-NW). The air mass origin from the Atlantic during the first two weeks of April, together with the presence of MSA and di-alkyl amines, suggest that the “amines” factor can be impacted by biogenic marine sources.
F4: the fourth factor (hereinafter referred to as “terpene-SOA-like” factor) is found
20
prevalently in the samples collected between 15 and 17 April , C(W-NW) and also, to a lesser extent, in the 30 March sample (Fig. 9). Unlike the “HULIS-containing” factor profile, aromatic protons (H-Ar) are scarcely visible in the “terpene-SOA-like” factor, except for two weak peaks, also present in the “glycols” and “amines” profiles, which may be due to defective splitting. Besides this, main distinguishing features of this
25
factor is the presence of single peaks overlapping the background signal in the region between 0.7–1.8 ppm which comprises non-fuctionalized alkyls (HC-C), e.g. methyl or methylene groups. Again, aliphatic alcohols and ethers/esters (HC-O) also contribute to characterizing the profile of such “terrestrial biogenic” factor in the range of chemical
ACPD
11, 22619–22662, 2011Determination of the biogenic SOA fraction in the boreal
forest
E. Finessi et al.
Title Page
Abstract Introduction
Conclusions References
Tables Figures
◭ ◮
◭ ◮
Back Close
Full Screen / Esc
Printer-friendly Version Interactive Discussion
Discussion
P
a
per
|
Dis
cussion
P
a
per
|
Discussion
P
a
per
|
Discussio
n
P
a
per
|
shifts between 3.3–4.5 ppm. By comparing the spectral profile of F4 with reference
1
H-NMR spectra of ambient and laboratory-generated water-soluble aerosols, the best match was found with the BSOA produced in the SAPHIR simulation chamber during photo-oxidation and ozonolysis of terpene mixtures, representative of VOCs emitted by conifer tree species (Fig. 10c). In particular, the closest similarity was found with BSOA
5
generated with mixtures of monoterpenes (MT) and sesquiterpenes (SQT), including: α/β-pinene, limonene,∆3-carene, ocimene,β-caryophyllene andα-farnesene (Finessi et al., 2011).
3.2.3 Comparison between AMS and NMR factors for OA source attribution Major components underlying the oxygenated organic aerosol fraction isolated from
10
NMR data were compared to those apportioned by AMS and averaged upon filter sam-pling times (Fig. 11). As explained above, the NMR-factor “glycols” are suspected to be contaminations, and are excluded from the following analysis. It should be noted that no filter samples were collected at night-time during the background period, and therefore the off-line NMR analyses did not account for the nocturnal peaks of OOA2
15
observed by the AMSs in such conditions.
In order to compare NMR and AMS factor loadings, the concentration metrics used by the two techniques need to be homogenized, in an attempt to retrieve equivalent organic mass concentrations from the organic non-exchangeable hydrogen concentra-tions provided by1H-NMR analysis. As a first step, water-soluble organic carbon
con-20
centrations comprising the NMR factors were derived from hydrogen concentrations by using factor-specific H/WSOC ratios. The latter were extrapolated from WSOC and
1
H-NMR measurements for spectral datasets representative for source types of the OA of interest to the present study. In particular, H/C molar ratios values of 0.8, 0.9 and 1 were used for the “terpene-SOA-like”, “amines” and “HULIS-containing”
NMR-25
ACPD
11, 22619–22662, 2011Determination of the biogenic SOA fraction in the boreal
forest
E. Finessi et al.
Title Page
Abstract Introduction
Conclusions References
Tables Figures
◭ ◮
◭ ◮
Back Close
Full Screen / Esc
Printer-friendly Version Interactive Discussion
Discussion
P
a
per
|
Dis
cussion
P
a
per
|
Discussion
P
a
per
|
Discussio
n
P
a
per
|
(Tagliavini et al., 2006). The WSOC concentrations estimated using such H/WSOC factors account for fully-substituted carbon atoms, which cannot be directly detected by1H-NMR analysis. However, the sum of WSOC concentrations derived for the three factors is still lower than the measured WSOC, probably because of losses of volatile compounds during sample preparation. Finally, to derive equivalent organic matter
5
concentrations, a simple conversion factor of 1.8 was used to convert WSOC load-ings into water-soluble organic mass concentrations (µg m−3). Along with the NMR-detected WSOC components, both the unaccounted-WSOC and the WINC fractions are included in Fig. 11 to facilitate comparison with AMS-detected OM. The conver-sion coefficients 1.8 and 1.4 were used to derive organic mass concentrations of the
10
unaccounted-WSOM and WIOM, respectively.
The OA mass concentrations reconstructed by the two independent techniques turned out to be in overall agreement, following fairly the same trend throughout the whole observation period.
Even if the very few time-integrated filter samples cannot account for the great
vari-15
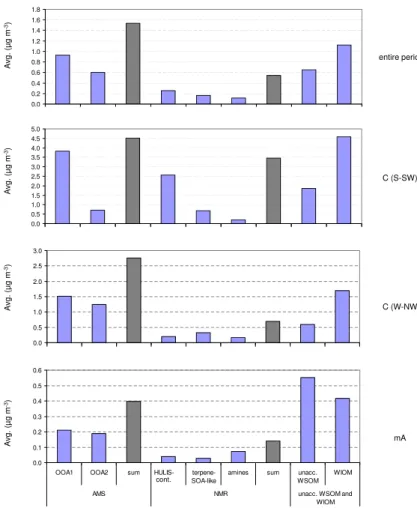
ability of OA composition observed by the online methods, when averaging the AMS factors over the filter sampling times, the OA composition patterns were comparable to those obtained by off-line measurements. The comparison between the patterns obtained by the AMS and NMR techniques is facilitated when looking at the averaged data over each distinct regime and the entire observing period (Figs. 12 and 13).
20
Two types of oxygenated organic components attributable to more and less oxi-dized organics, respectively, appeared particularly stable in all tested solutions used for factor analysis. They accounted for most of the detected mass in both method-ologies (Fig. 13) and are attributable to a more and a less oxidized organic fraction. The more oxidized, aged organic fraction, represented by the AMS OOA1 and by the
25
NMR “HULIS-containing” factors, accounted for about 50 % of the detected organic mass in both cases, when considering the entire period (Fig. 13). This fraction, la-belled as “more oxidized”, shows a mass spectrum dominated by the m/z 44 (CO+2) peak, and in parallel a NMR spectrum enriched in oxidized functional groups, such as
ACPD
11, 22619–22662, 2011Determination of the biogenic SOA fraction in the boreal
forest
E. Finessi et al.
Title Page
Abstract Introduction
Conclusions References
Tables Figures
◭ ◮
◭ ◮
Back Close
Full Screen / Esc
Printer-friendly Version Interactive Discussion
Discussion
P
a
per
|
Dis
cussion
P
a
per
|
Discussion
P
a
per
|
Discussio
n
P
a
per
|
carbonyls/carboxyls and hydroxyls. Additionally, it shows high correlation coefficients with sulphate, ammonium, nitrate and potassium ions, and particularly contributed to the organic mass during the so-called continental regime from the South-to-SouthWest sector. Thus, for all the above reasons, it has been linked to transported pollution, in-cluding wood burning products. By contrast, the second major component, labelled as
5
less oxidized, is represented by the AMS OOA2 and by the NMR factors related to bio-genic OA, and greatly contributed to enhancing the OA mass during the marine/Arctic and C(W-NW) regimes.
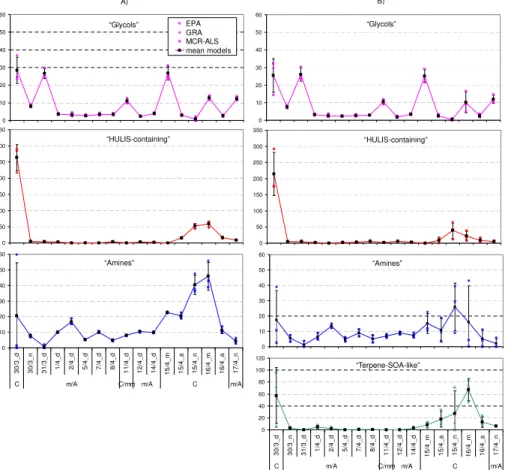
The NMR factor analysis further isolated two distinct components within the a less oxidized OA fraction, namely the “amines” and “terpene-SOA-like” factors. Their
rel-10
ative concentrations appeared strongly dependent on the air mass regime. Indeed, when prevalently polar air masses reached the site (m/A regime), the NMR analysis assigned about 50 % of WSOC to the “amines” factor. This was based on similarities with spectral signatures of aerosol collected in clean marine environments, including MSA and alkyl amines signals and, therefore could be linked to a biogenic OA source
15
of marine origin. By contrast, the “terpene-SOA-like” factor is related to terrestrial sec-ondary products originating from the gas-to-particle conversion of VOCs emitted by conifer forests, on the basis of similarities with BSOA formed in chamber experiments with monoterpenes plus sesquiterpenes. Overall, a significant fraction of WSOC can be assigned to the terrestrial biogenic factor throughout the whole period (about 30 %),
20
indicating a persistent source active in the area around the sampling site. It was also particularly enriched during the so-called C(W-NW) regime, reaching up to 50 % of the detected WSOC. The back-trajectories analysis showed that air masses influenc-ing the site durinfluenc-ing the C(W-NW) period originated mainly from North West, under-going a marine to continental transition over the Scandinavian forest area. Thus the
25
ACPD
11, 22619–22662, 2011Determination of the biogenic SOA fraction in the boreal
forest
E. Finessi et al.
Title Page
Abstract Introduction
Conclusions References
Tables Figures
◭ ◮
◭ ◮
Back Close
Full Screen / Esc
Printer-friendly Version Interactive Discussion
Discussion
P
a
per
|
Dis
cussion
P
a
per
|
Discussion
P
a
per
|
Discussio
n
P
a
per
|
transition (Allan et al., 2006; Cavalli et al., 2006; Tunved et al., 2006; Raatikainen et al., 2010). Since a few short pollution episodes were still detected during this period, a higher particle concentration may be also considered as a possible explanation for the BSOA enhancement with respect to low concentration periods, e.g. by acting as condensation sink for locally emitted gaseous precursors. However, the same
com-5
position patterns are not observed during the C(S-SW) period, when still high particle concentrations were registered but the air masses originated from Central Europe. In summary, the longer time spent over the Boreal forest by the air masses reaching the site within C(W-NW) remains the most plausible explanation of the observed BSOA enrichment.
10
4 Conclusions
Submicrometer organic aerosol characterization was performed in the Finnish forest environment at Hyyti ¨al ¨a, exploiting parallel AMS and NMR measurements with aim of source apportionment. The three-week EUCAARI campaign carried out in April 2007 covered different atmospheric conditions and transport patterns, from very clean
back-15
ground to fairly polluted regimes. Results from factor analysis applied separately on AMS and NMR spectral datasets showed that air mass origin had a strong impact on organic composition, in agreement with findings of previous investigations at this site. Two types of oxygenated organic components, one more and one less oxidized, ap-peared to be particularly stable within any tested solution used for the factor analysis
20
applied, mostly accounting for the detected mass for both methodologies. The more ox-idized component, defined as OOA1 for AMS and “HULIS-containing” for NMR, showed a mass spectrum dominated by the m/z 44 peak and a NMR spectrum enriched in oxidized functional groups, such as carbonyls/carboxyls and hydroxyls. This com-ponent correlated clearly with pollution/wood burning outbreaks in Central Europe.
25
By contrast, the less oxidized component, showing features consistent with fresher aerosols, was strongly enhanced in concomitance with air masses originating from the North to West sector.
ACPD
11, 22619–22662, 2011Determination of the biogenic SOA fraction in the boreal
forest
E. Finessi et al.
Title Page
Abstract Introduction
Conclusions References
Tables Figures
◭ ◮
◭ ◮
Back Close
Full Screen / Esc
Printer-friendly Version Interactive Discussion
Discussion
P
a
per
|
Dis
cussion
P
a
per
|
Discussion
P
a
per
|
Discussio
n
P
a
per
|
NMR factor analysis further isolated two distinct subcomponents within such less oxidized OA fraction, that were respectively linked to terrestrial and marine biogenic sources on the basis of similarities with spectral fingerprints and back-trajectory analy-sis. Overall, such terrestrial and marine biogenic components contributed equally to OA mass (about 30 % each) when averaging over the whole observing period, but showed
5
relative abundances strongly depending on the North-to-West air-mass transition. In summary, the findings trace and quantify at least two independent sources originating biogenic secondary organic aerosols in Hyyti ¨al ¨a through oxidation and condensation phenomena: a first source involving products of marine origin, which is more important during low aerosol concentration regimes with predominantly polar air masses, and a
10
second source involving reactions of locally emitted terpenes, which becomes more important with increasing time spent by air masses over the Boreal forest.
The complementary approach exploited here between independent source appor-tionment methods has proven to give a more complete and accurate picture of organic aerosol variability, and has provided the opportunity to trace biogenic SOA in the
envi-15
ronment.
Acknowledgements. Main part of the work in this paper has been funded with FP6 project EUCAARI (Contract 34684) and by ACCENT (Atmospheric Composition Change the European Network of Excellence). This research has received also funding from the Finnish Cultural Foundation and the Academy of Finland Centre of Excellence program (project no 1118615).
20
FMI and University of Helsinki are gratefully acknowledged for the research support at the Hyyti ¨al ¨a station.
References
Aalto, P., H ¨ameri, K., Becker, E., Weber, R., Salm, J.,M ¨akel ¨a, J., Hoell, C., O’Dowd, C., Karls-son, H., HansKarls-son, H.-C., V ¨akev ¨a, M., Koponen, I., Buzorius, G., and Kulmala, M.: Physical
25
characterization of aerosol particles during nucleation events, Tellus B, 53, 344–358, 2001. Aiken, A. C., DeCarlo, P. F., and Jimenez, J. L.: Elemental analysis of organic species with
ACPD
11, 22619–22662, 2011Determination of the biogenic SOA fraction in the boreal
forest
E. Finessi et al.
Title Page
Abstract Introduction
Conclusions References
Tables Figures
◭ ◮
◭ ◮
Back Close
Full Screen / Esc
Printer-friendly Version Interactive Discussion
Discussion
P
a
per
|
Dis
cussion
P
a
per
|
Discussion
P
a
per
|
Discussio
n
P
a
per
|
Aiken, A. C., DeCarlo, P. F., Kroll, J. H., Worsnop, D. R., Huffman, J. A., Docherty, K. S., Ulbrich, I. M., Mohr, C., Kimmel, J. R., Sueper, D., Sun, Y., Zhang, Q., Trimborn, A., Northway, M., Ziemann, P. J., Canagaratna, M. R., Onasch, T. B., Alfarra, M. R., Pr ´ev ˆot, A. S. H., Dommen, J., Duplissy, J., Metzger, A., Baltensperger, U., and Jimenez, J. L.: O/C and OM/OC ratios of primary, secondary, and ambient organic aerosols with high-resolution time-of-flight aerosol
5
mass spectrometry, Environ. Sci. Technol., 42, 4478–4485, 2008.
Alfarra, M. R., Paulsen, D., Gysel, M., Garforth, A. A., Dommen, J., Pr ´ev ˆot, A. S. H., Worsnop, D. R., Baltensperger, U., and Coe, H.: A mass spectrometric study of secondary organic aerosols formed from the photooxidation of anthropogenic and biogenic precursors in a re-action chamber, Atmos. Chem. Phys., 6, 5279–5293, doi:10.5194/acp-6-5279-2006, 2006.
10
Allan, J., Jimenez, J., Williams, P., Alfarra, M., Bower, K., Jayne, J., Coe, H., and Worsnop, D.: Quantitative sampling using an aerodyne aerosol mass spectrometer 1. Techniques of data interpretation and error analysis, J. Geophys. Res., 108, 4090, doi:10.1029/2002JD002358, 2003.
Allan, J. D., Alfarra, M. R., Bower, K. N., Coe, H., Jayne, J. T., Worsnop, D. R., Aalto, P.
15
P., Kulmala, M., Hy ¨otyl ¨ainen, T., Cavalli, F., and Laaksonen, A.: Size and composition measurements of background aerosol and new particle growth in a Finnish forest during QUEST 2 using an Aerodyne Aerosol Mass Spectrometer, Atmos. Chem. Phys., 6, 315– 327, doi:10.5194/acp-6-315-2006, 2006.
Allan, J. D., Williams, P. I., Morgan, W. T., Martin, C. L., Flynn, M. J., Lee, J., Nemitz, E.,
20
Phillips, G. J., Gallagher, M. W., and Coe, H.: Contributions from transport, solid fuel burning and cooking to primary organic aerosols in two UK cities, Atmos. Chem. Phys., 10, 647–668, doi:10.5194/acp-10-647-2010, 2010.
Andreae, M. O.: Soot carbon and excess fine potassium: Long range transport of combustion-derived aerosols, Science, 220, 1148–1151, 1983.
25
Atkinson, R. and Arey, J.: Gas-phase tropospheric chemistry of biogenic volatile organic compounds: a review, Atmos. Environ., 37, Supplement, 2, S197–S219, 2003.
Baltensperger, U., Kalberer, M., Dommen, J., Paulsen, D., Alfarra, M. R., Coe, H., Fisseha, R., Gascho, A., Gysel, M., Nyeki, S., Sax, M., Steinbacher, M., Prevot, A. S. H., Sj ¨ogren, S., Weingartner, E., and Zenobi, R.: Secondary organic aerosols from anthropogenic and
30
biogenic precursors, Faraday Discuss., 130, 265–278, 2005.
Barnaba, F., Angelini, F., Curci, G., and Gobbi, G. P.: An important fingerprint of wildfires on the European aerosol load, Atmos. Chem. Phys. Discuss., 11, 2317–2354,
ACPD
11, 22619–22662, 2011Determination of the biogenic SOA fraction in the boreal
forest
E. Finessi et al.
Title Page
Abstract Introduction
Conclusions References
Tables Figures
◭ ◮
◭ ◮
Back Close
Full Screen / Esc
Printer-friendly Version Interactive Discussion
Discussion
P
a
per
|
Dis
cussion
P
a
per
|
Discussion
P
a
per
|
Discussio
n
P
a
per
|
11-2317-2011, 2011.
Cahill, T. M., Seaman, V. Y., Charles, M. J., Holzinger, R., and Goldstein, A. H.: Secondary organic aerosols formed from oxidation of biogenic volatile organic com-pounds in the Sierra Nevada Mountains of California, J. Geophys. Res., 111, D16312, doi:10.1029/2006JD007178, 2006.
5
Calvert, J. G., Atkinson, R., Becker, K. H., Kamens, R. M., Seinfeld, J. H., Wallington, T. J., and Yarwood, G.: The Mechanisms of Atmospheric Oxidation of Aromatic Hydrocarbons, Oxford University Press, New York, 2002.
Canagaratna, M., Jayne, J., Jimenez, J., Allan, J., Alfarra, M., Zhang, Q., Onasch, T., Drewnick, F., Coe, H., Middlebrook, A., Delia, A., Williams, L., Trimborn, A., Northway, M., De-Carlo,
10
P., Kolb, C., Davidovits, P., and Worsnop, D.: Chemical and microphysical characterization of ambient aerosols with the Aerodyne aerosol mass spectrometer, Mass Spectrom. Rev., 26, 185–222, doi:10.1002/mas.20115, 2007.
Cao, G. and Jang, M.: Secondary organic aerosol formation from toluene photooxidation under various NOxconditions and particle acidity, Atmos. Chem. Phys. Discuss., 8, 14467–14495,
15
doi:10.5194/acpd-8-14467-2008, 2008.
Capes, G., Johnson, B., McFiggans, G., Williams, P. I., Haywood, J., and Coe, H.: Aging of biomass burning aerosols over West Africa: Aircraft measurements of chemical com-position, microphysical properties, and emission ratios, J. Geophys. Res., 113, D00C15, doi:10.1029/2008JD009845, 2008.
20
Cavalli, F., Facchini, M. C., Decesari, S., Emblico, L., Mircea, M., Jensen, N. R., and Fuzzi, S.: Size-segregated aerosol chemical composition at a boreal site in southern Finland, during the QUEST project, Atmos. Chem. Phys., 6, 993–1002, doi:10.5194/acp-6-993-2006, 2006. Claeys, M., Graham, B., Vas, G., Wang, W., Vermeylen, R., Pashynska, V., Cafmeyer,
J., Guyon, P., Andreae, M. O., Artaxo, P., and Maenhaut, W.: Formation of
Sec-25
ondary Organic Aerosols Through Photooxidation of Isoprene, Science, 303, 1173, doi:10.1126/science.1092805, 2004.
Crosier, J., Jimenez, J. L., Allan, J. D., Bower, K. N., Williams, P. I., Alfarra, M. R., Canagaratna, M. R., Jayne, J. T., Worsnop, D. R., and Coe, H.: Technical Note: Description and Use of the New Jump Mass Spectrum Mode of Operation for the Aerodyne Quadrupole Aerosol Mass
30
Spectrometers (Q-AMS), Aerosol Sci. Technol., 41(9), 865–872, 2007.
ACPD
11, 22619–22662, 2011Determination of the biogenic SOA fraction in the boreal
forest
E. Finessi et al.
Title Page
Abstract Introduction
Conclusions References
Tables Figures
◭ ◮
◭ ◮
Back Close
Full Screen / Esc
Printer-friendly Version Interactive Discussion
Discussion
P
a
per
|
Dis
cussion
P
a
per
|
Discussion
P
a
per
|
Discussio
n
P
a
per
|
Field-deployable, high-resolution, time-of-flight aerosol mass spectrometer, Anal. Chem., 78, 8281–8289, 2006.
Decesari, S., Facchini, M. C., and Fuzzi, S.: Characterization of water-soluble organic com-pounds in atmospheric aerosols: a new approach, J. Geophys. Res., 105, 1481–1489, 2000. Decesari, S., Mircea, M., Cavalli, F., Fuzzi, S., Moretti, F., Tagliavini, E., and Facchini, M. C.:
5
Source attribution of water-soluble organic aerosol by nuclear magnetic resonance spec-troscopy, Environ. Sci. Technol., 41, 2479–2484, 2007.
Decesari, S., Finessi, E., Rinaldi, M., Paglione, M., Fuzzi, S., Stephanou, E., Tziaras, T., Spy-ros, A., Ceburnis, D., O’Dowd, C. D., Dall’Osto, M., Harrison, R., Allan, J., Coe, H., and Facchini, M. C.: Primary and secondary marine organic aerosols over the North Atlantic
10
Ocean during the MAP experiment, J. Geophys. Res., under review, 2011.
De Gouw, J. and Jimenez, J. L.: Organic Aerosols in the Earth’s Atmosphere, Environ. Sci. Technol., 43, 7614–7618, 2009.
Facchini, M. C., Decesari, S., Rinaldi, M., Carbone, C., Finessi, E., Mircea, M., Fuzzi, S., Moretti, F., Tagliavini, E., Ceburnis, D., and O’Dowd, C. D.: An important source of marine
15
secondary organic aerosol from biogenic amines, Environ. Sci. Technol., 42(24), 9116–9121, 2008.
Fuzzi, S., Andreae, M. O., Huebert, B. J., Kulmala, M., Bond, T. C., Boy, M., Doherty, S. J., Guenther, A., Kanakidou, M., Kawamura, K., Kerminen, V.-M., Lohmann, U., Russell, L. M., and P ¨oschl, U.: Critical assessment of the current state of scientific knowledge, terminology,
20
and research needs concerning the role of organic aerosols in the atmosphere, climate, and global change, Atmos. Chem. Phys., 6, 2017–2038, doi:10.5194/acp-6-2017-2006, 2006. Gelencser, A., Hoffer, A., Molnar, A., Krivacsy, Z., Kiss, G., and Meszaros, E.: Thermal
be-haviour of carbonaceous aerosol from continental background site, Atmos. Environ., 34, 823–831, 2000.
25
Goldstein, A. H. and Galbally, I. E.: Known and unexplored organic constituents in the earth’s atmosphere, Environ. Sci. Technol., 41, 1514–1521, 2007.
Guenther, A., Hewitt, C. N., Erickson, D., Fall, R., Geron, C., Gredel, T., Harley, P., Klinger, L., Lerdau, M., Mckay, W. A., Pierce, T., Scholes, B., Steinbrecher, R., Tallamraju, R., Taylor, J., and Zimmerman, P.: A: A global model of natural volatile organic compound emissions, J.
30
Geophys. Res., 100(D5), 8873–8892, doi:10.1029/94JD02950, 1995.
Hallquist, M., Wenger, J. C., Baltensperger, U., Rudich, Y., Simpson, D., Claeys, M., Dommen, J., Donahue, N. M., George, C., Goldstein, A. H., Hamilton, J. F., Herrmann, H., Hoffmann,