www.atmos-chem-phys.net/13/6289/2013/ doi:10.5194/acp-13-6289-2013
© Author(s) 2013. CC Attribution 3.0 License.
Atmospheric
Chemistry
and Physics
Geoscientiic
Geoscientiic
Geoscientiic
Geoscientiic
Updated aerosol module and its application to simulate secondary
organic aerosols during IMPACT campaign May 2008
Y. P. Li1,2,3, H. Elbern2,3, K. D. Lu1, E. Friese2, A. Kiendler-Scharr3, Th. F. Mentel3, X. S. Wang1, A. Wahner3, and Y. H. Zhang1
1State Key Joint Laboratory of Environmental Simulation and Pollution Control, College of Environmental Sciences and
Engineering, Peking University, Beijing, China
2Rhenish Institute for Environmental Research at the University of Cologne, Cologne, Germany
3Institut f¨ur Energie- und Klimaforschung Troposph¨are (IEK-8), Forschungszentrum J¨ulich, J¨ulich, Germany
Correspondence to:Y. H. Zhang ([email protected])
Received: 20 February 2013 – Published in Atmos. Chem. Phys. Discuss.: 6 March 2013 Revised: 24 May 2013 – Accepted: 30 May 2013 – Published: 3 July 2013
Abstract. The formation of Secondary organic aerosol (SOA) was simulated with the Secondary ORGanic Aerosol Model (SORGAM) by a classical gas-particle partitioning concept, using the two-product model approach, which is widely used in chemical transport models. In this study, we extensively updated SORGAM including three major modifi-cations: firstly, we derived temperature dependence functions of the SOA yields for aromatics and biogenic VOCs (volatile organic compounds), based on recent chamber studies within a sophisticated mathematic optimization framework; sec-ondly, we implemented the SOA formation pathways from photo oxidation (OH initiated) of isoprene; thirdly, we im-plemented the SOA formation channel from NO3-initiated
oxidation of reactive biogenic hydrocarbons (isoprene and monoterpenes). The temperature dependence functions of the SOA yields were validated against available chamber exper-iments, and the updated SORGAM with temperature depen-dence functions was evaluated with the chamber data. Good performance was found with the normalized mean error of less than 30 %. Moreover, the whole updated SORGAM module was validated against ambient SOA observations rep-resented by the summed oxygenated organic aerosol (OOA) concentrations abstracted from aerosol mass spectrometer (AMS) measurements at a rural site near Rotterdam, the Netherlands, performed during the IMPACT campaign in May 2008. In this case, we embedded both the original and the updated SORGAM module into the EURopean Air pol-lution and Dispersion-Inverse Model (EURAD-IM), which showed general good agreements with the observed
meteo-rological parameters and several secondary products such as O3, sulfate and nitrate. With the updated SORGAM
mod-ule, the EURAD-IM model also captured the observed SOA concentrations reasonably well especially those during night-time. In contrast, the EURAD-IM model before update un-derestimated the observations by a factor of up to 5. The large improvements of the modeled SOA concentrations by up-dated SORGAM were attributed to the mentioned three mod-ifications. Embedding the temperature dependence functions of the SOA yields, including the new pathways from isoprene photo oxidations, and switching on the SOA formation from NO3 initiated biogenic VOC oxidations, contributed to this
enhancement by 10, 22 and 47 %, respectively. However, the EURAD-IM model with updated SORGAM still clearly un-derestimated the afternoon SOA observations up to a factor of two.
1 Introduction
it is still a challenging work to simulate SOA using chemi-cal transport models, as both the diagnosis and prediction of the fine particle pollution from local to global scales are still uncertain, yet form a basis for projecting climate change and regional air pollution control.
Several chemical transport models (CTM), such as GEOS-CHEM, Community Multiscale Air Quality (CMAQ), and PM Comprehensive Air Quality Model (PMCAMx) (Fu et al., 2008; Carlton et al., 2010; Lane et al., 2008), were em-ployed to simulate SOA formation. However, there was large uncertainty of current models to predict SOA in the atmo-sphere due to the large varieties of SOA precursors and pro-cesses involved in formation of SOA (Hallquist et al., 2009). A new study even indicated that the equilibrium partition-ing method used in traditional models might be questionable at real atmospheric conditions (Perraud et al., 2012). Widely used frameworks to simulate SOA formation processes in-clude e.g., the two-product model approach (Odum et al., 1996), methods based on volatility basis set (VBS, Donahue et al., 2006) such as the 2D-VBS (Jimenez et al., 2009) and statistical oxidation model (SOM, Cappa et al., 2013). Addi-tionally in recent studies, other new frameworks such as the condensed aromatic kinetics (Kamens et al., 2011; Zhou et al., 2011) and the functional group oxidation model (Zhang et al., 2012) were developed as well.
The EURopean Air pollution and Dispersion-Inverse Model (EURAD-IM, Elbern et al., 2007) is an Eulerian model running from local to continental scale. EURAD-IM is primarily used for chemical weather forecast and advanced data assimilation studies over Europe. Previous studies on a high ozone episode (Monteiro et al., 2012) and a dust storm (Chervenkov and Jakobs, 2011) indicated good perfor-mances of EURAD-IM. Colette et al. (2011) compared six CTMs including BOLCHEM, CHIMERE, EMEP, EURAD, OSLOCTM2 and MOZART used for simulations of the Eu-ropean air quality. It was found that EURAD-IM was best in simulating NO2and PM10 among all six CTMs. The SOA
module in EURAD, namely, Secondary ORGanic Aerosol Model (SORGAM, Schell et al., 2001), is based on the two-product approach, but the performance of the SOA simula-tions by EURAD-IM is rarely evaluated against European ambient measurements.
Fundamental knowledge of SOA formation was largely developed in the last two decades. New precursors or new pathways of the oxidation of known precursors were rec-ognized and sequentially implemented into the model. The photo oxidation products of monoterpenes and aromatics were firstly considered and determined to contribute to the aerosol budget due to their relative large carbon skeleton (Kavouras et al., 1998; Odum et al., 1997). In contrast, iso-prene, the most prominent ambient volatile organic compo-nent (VOC; Kesselmeier and Staudt, 1999; Guenther et al., 1996, 2006) was initially not considered to be a possible SOA precursor, as it is a small molecule (Pandis et al., 1991). However, interesting indications that isoprene could be an
important SOA precursor started to appear when Claeys et al. (2004) detected two polyols containing the isoprene skele-ton in ambient aerosol samples. Furthermore, followed by the parameterization given by Kroll et al. (2006), a global model study estimated that including the isoprene generated SOA formation increased the simulated aerosol burden by a factor of two (Henze and Seinfeld, 2006). In a recent kinetic study, Paulot et al. (2009) proposed that isoprene derived epoxides and the subsequent formation of polymers on aerosols could be one important physical mechanism for isoprene SOA for-mation. Moreover, recent studies also highlighted the impor-tance of reactive nitrogen compounds in global SOA forma-tion. For example, NO3radical initiated oxidation of VOCs
was found to be very important for SOA formation during nighttime conditions (Fry et al., 2009, 2011; Rollins et al., 2009; Pye et al., 2010).
In addition to the chemistry, ambient conditions such as temperature and humidity can also strongly influence the SOA production rates as observed in a series of chamber experiments. Temperature was reported as an important fac-tor (Chung and Seinfeld, 2002), influencing the SOA yield from a given gas phase precursor-oxidant combination. The influence of temperature is manifold as it can affect the gas-phase oxidation mechanism, thus shifting the product dis-tribution, as well as the partitioning of vapors between the gas phase and the particulate phase. Photo-oxidation experi-ments in a temperature-controlled chamber showed that, for three aromatic hydrocarbons (toluene, m-xylene and 1,2,4-trimethylbenzene), α-pinene and n-undecane (Takekawa et al., 2003), the SOA yield at 283 K was approximately twice as much than at 303 K. On the other hand, at very low temperature (between 243 K and 273 K), positive tempera-ture dependence was observed and ascribed to changes in chemical kinetics (Jonsson et al., 2008). For SOA formed fromm-xylene, a transition point near 290–292 K was ob-served for SOA density, volatility, hygroscopicity and el-emental composition, when the experimental temperatures were increased. This indicated that simply employing the en-thalpy of vaporization was not sufficient in predicting tem-perature dependent SOA formation (Qi et al., 2010). In addi-tion, the influence of humidity on SOA formation was shown in former works (Seinfeld et al., 2001; Seinfeld and Pankow, 2003). More SOA mass was produced from the same amount ofα-pinene under humid than under dry conditions, with the total yield increasing about four times at both high and low temperatures (Tillmann et al., 2010). Here reaction channels involving water led to the formation of products with lower vapor pressures.
the temperature dependence of mass stoichiometric and par-titioning coefficients. Stanier et al. (2008) used experimen-tal smog chamber data of α-pinene ozonolysis to param-eterize the aerosol mass fractions. Based on the theory of absorptive partitioning and the method of the VBS, a non-linear least squares fitting tool was employed to calculate the mass stoichiometric coefficient and the enthalpy of va-porization. However, the parameterizations in recent works (e.g., Saathoff et al., 2009) were usually derived from one group of experiments, which might not be representative. In some cases (Stanier et al., 2008) temperature sensitivity was considered based on multi-researches, but without providing an explicit function to describe the relations among the re-searches. In most chemical transport models (e.g., Henze and Seinfeld, 2006; Carlton et al., 2010), mass stoichiometric and partitioning coefficients are set to constant values at a refer-ence temperature (298 K), and the enthalpy of vaporization is applied to calculate values at other temperatures. However, in many cases the enthalpy of vaporization is not known well, which might result in large uncertainties.
In the present work, we updated the aerosol module SORGAM with temperature dependent parameterizations of SOA formation considering published chamber experiments of relevance (indicated by the suffix T), we included the SOA formation pathways from isoprene oxidation (indicated by I), and the degradation products initiated by NO3oxidation
were also considered (N). The stepwise updated SORGAM-TIN module was first validated in a box model framework with chamber experiments and then tested in the EURAD-IM platform in a case study. Model and measurement com-parison of the SOA concentrations at a rural location near Rotterdam (the Netherlands) further proved the success of these updates under real European atmospheric conditions.
2 Methodology
2.1 Current aerosol module in EURAD-IM
Within EURAD-IM, the aerosol dynamics such as nucle-ation, condensnucle-ation, coagulnucle-ation, diffusion, sedimentnucle-ation, aerosol–cloud interaction, etc. are simulated by the Modal Aerosol Dynamics Model for Europe (MADE) (Ackermann et al., 1998). However, the initial MADE aerosol chemistry module only treated inorganic ions and water. To consider the formation of secondary organic aerosols, SORGAM was de-veloped and implemented into MADE (Schell et al., 2001). In SORGAM, both anthropogenic and biogenic hydrocar-bons are first oxidized by oxidants like OH, NO3 and O3.
The mass transfer from gas to particle phase is then driven by the gas/particle partitioning of the low volatility oxida-tion products formed in gas phase. According to the available chamber experimental results, the fractional aerosol coeffi-cient is used for the oxidations of alkanes and anthropogenic terminal and internal alkenes, while the two-product model is
applied for other reactive organic gases including aromatics and terpenes.
For the two-product model approach (Odum et al., 1996) used in SORGAM, the produced SOA from oxidation of cer-tain hydrocarbon precursor is expressed by
Y =M0α1K1 1+K1M0
+M0α2K2 1+K2M0
, (1)
whereY is the mass fractional yield of SOA,M0 is the
to-tal aerosol organic mass concentration,αi is the mass sto-ichiometric coefficient, andKi is a partitioning coefficient. The subscripts 1 and 2 in Eq. (1) denote the two categories of oxidation products, normally one is assumed to be semi-volatile and the other is attributed to low-semi-volatile condens-able vapors. In the original SORGAM, the mass stoichiomet-ric coefficientsαi are set to be constants, and the influence of temperature is solely introduced through partitioning coeffi-cientsKi whose temperature dependence is expressed using the Clausius–Clapeyron equation (Pankow, 1987).
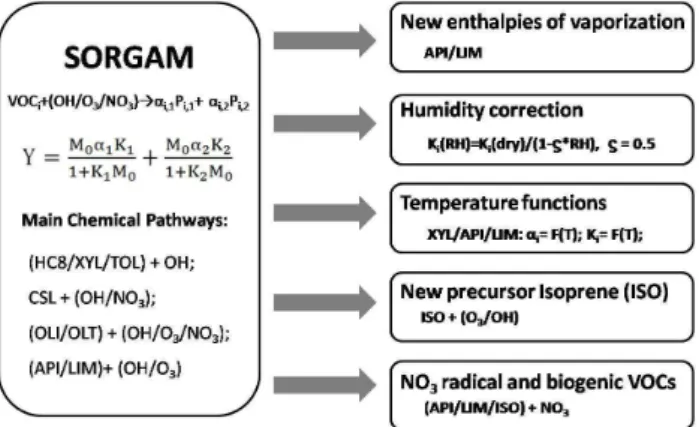
In this work, we updated the SORGAM model to SORGAM-TIN in the following five aspects (for a schematic view see Fig. 1): (1) enthalpies of vaporization were updated according to a recent study (Saathoff et al., 2009); (2) the influence of aerosol water content on the SOA yield was considered by a simplified RH (relative humidity) depen-dence correction; (3) unified temperature dependent func-tions of mass stoichiometric coefficients and partitioning co-efficients for the two-product approach were derived accord-ing to available chamber experiments; (4) the SOA produced from isoprene oxidation products was considered; and (5) the SOA produced from the degradation products of biogenic VOCs by NO3was considered as well.
2.2 Update of enthalpies of vaporization
The SOA two-product species in MADE/SORGAM and their molecular weights and enthalpies of vaporization were listed in Table 1. The enthalpies of vaporization of every product from all precursors were the same in the original SORGAM (Schell et al., 2001) with the following exceptions: the en-thalpies of vaporization of the products of α-pinene and limonene were updated according to Saathoff et al. (2009); molecular weights and enthalpies of vaporization of the prod-ucts of isoprene were taken from Carlton et al. (2010) and Kleindienst et al. (2009).
2.3 Humidity correction
For the parameterization of SOA formation, the effect of hu-midity was considered in this study. According to Prisle et al. (2010), the activity suppression in the Raoult’s law region is a linear function of RH for any organic compoundi:
Table 1.SOA two-product species in SORGAM module.
RACM Precursor Classes Oxidants SOA Model Classes MW (g mol−1) 1H
vap(kJ mol−1)
TOL, XYL, CSL OH/NO3 ARO1 150 156
ARO2 150 156
HC OH ALK1 140 156
OLT, OLI O3/OH/NO3 OLE1 140 156
API O3/OH/NO3 API1 184 24a
API2 184 59a
LIM O3/OH/NO3 LIM1 200 25a
LIM2 200 55a
ISO O3/OH/NO3 ISO1 96b 39c
ISO2 96b 39c
aSaathoff et al. (2009) bCarlton et al. (2010) cKleindienst et al. (2009)
Bold type: updates of original SORGAM
(TOL: toluene and less reactive aromatics; XYL: xylene and more reactive aromatics; CSL: cresol and other hydroxyl substituted aromatics; HC: alkanes; OLT: terminal alkenes; OLI: internal alkenes; API:α-pinene and other cyclic terpenes with one double bond; LIM: limonene and other cyclic diene-terpenes; ISO: isoprene.)
Fig. 1.A schematic view of the updates we applied to the original SORGAM module.
C∗i(RH)=τiC∗i(dry, ) (3) whereτi,ςi,Ci∗and RH denote organic activity coefficient, hydrophilicity coefficient, saturation mass concentration and relative humidity, respectively. Based on α-pinene ozonol-ysis, Prisle et al. (2010) estimated the range of ς varying from 0.33 to 0.67, and within the error limits nearly all the results could be represented byς=0.5. Therefore in this study,ς was set to 0.5 for all organic compounds included in SORGAM-TIN. SinceCi∗ is the reciprocal of the parti-tioning coefficientKi,Ki(RH) can be expressed asKi(dry)/ (1−ς·RH). Equation (1) can thus be rearranged to
Y=M0α1K1/(1−ς·RH) 1+K1M0/(1−ς·RH)
+M0α2K2/(1−ς·RH) 1+K2M0/(1−ς·RH)
. (4)
2.4 Temperature dependent functions of mass stoichio-metric coefficients and partitioning coefficients
It was found that the original parameterization ofαi andKi in SORGAM could not describe the available recent cham-ber experimental results appropriately. With newly available laboratory data collected and reviewed, we deduced new pa-rameterizations of αi andKi with sophisticated non-linear optimization software packages such as Lsqnonlin, Eureqa (Schmidt and Lipson, 2009) and Nl2sol (Dennis et al., 1981). The above humidity correction was included in this param-eterization as well. Takingα-pinene as an example, atT = 293 K andM0=5 µg m−3, the yield of SOA increased 2.5 %
at RH=50 %, as calculated by Eq. (4). In Fig. 2, the method-ological framework of the parameterization was depicted, which included three major steps.
Firstly, the selected chamber experimental data were grouped into different temperature bins to deduce the relation between parameters and the temperature in each bin. Accord-ing to Eq. (1), experimentally determinedY andM0are used
as input data while the other four parameters (α1,K1, α2,K2)
were deduced in each temperature bin with Lsqnonlin (an op-timization tool in Matlab to solve non-linear least squares problems). The results of this step can be summarized as
YTi=F (M0, α1(Ti) , α2(Ti) , K1(Ti) , K2(Ti) ).
Fig. 2.Technical frame of parameterization of mass stoichiometric coefficients and partitioning coefficients. First step: grouping ex-perimental data, second step: fitting parameters in each group, third step: deriving temperature dependent functions, last step: optimiz-ing parameter functions.
The functionsFiderived in the second step were tested in a box model framework. However, the model–measurement inter-comparison results were not as satisfying as expected (see Sect. 3.2), due to the different algorithm utilized in Eureqa and SORGAM. Therefore, in a third step, the lo-calized parameterization of the functionsFi for SORGAM has to be further deduced. This kind of optimization was achieved with the Nl2sol model, which is an adaptive nonlin-ear least-squares algorithm. Herein, the residual vector, i.e., the differences of simulated and observed values, is a contin-uously differentiable functionR(x)=(R1(x),. . .,Rn(x))T ofpparametersx=(x1,. . .,xp)T. Vectorxwas introduced in the temperature functions like Fi(T , x), and the initial value ofx was set as 1.0. Nl2sol attempts to find a param-eter vector x∗ that minimizes the sum of squares function
F (x)=PRi(x)2(Dennis et al., 1981). In this way, the final functionsFi (T , x∗)with best compatibility for SORGAM were obtained.
Due to the limited amount of chamber experiments for toluene, the temperature dependence functions for the pa-rameterizations of toluene were extrapolated from those of
m-xylene. In a study by Takekawa et al. (2003) both toluene and m-xylene were investigated under similar experimen-tal conditions. We subdivided these experiments into two temperature groups, namely, 283 K and 303 K. By assuming that the oxidation products ofm-xylene and toluene had the same partitioning coefficientKi, we thus derived the mass stoichiometric coefficient of toluene:αtoluene=x·αm−xylene,
x >1 (Vivanco et al., 2011). We then solved x by Eq. (1)
for both temperature groups according to available chamber experiments (Takekawa et al., 2003). Linear interpolation be-tween the two temperatures was performed to get the func-tion for factorx:
x=(T−283)·0.12+1.2. (5)
2.5 Mechanistic updates
In the original SORGAM, SOA produced from isoprene was not considered. In contrast, as outlined in recent laboratory and field studies (e.g., Claeys et al., 2004; Kroll et al., 2006; Henze and Seinfeld, 2006; Paulot et al., 2009), isoprene could be a more important precursor of SOA than previously thought. Nevertheless, the laboratory results about the SOA yield from isoprene were still limited (Chhabra et al., 2010; Dommen et al., 2006; Kroll et al., 2006), so there are not enough data available to derive temperature dependent func-tions ofαandK. Instead, a constantαvalid at 295 K deter-mined by the OH oxidation of isoprene was adapted accord-ing to Henze and Seinfeld (2006).
ISO+OH→0.0288·ISO1+0.232·ISO2 (6) The set of parameters shown in Eq. (6) is widely used in CTMs, including GEOS-Chem and CMAQ (Henze and Se-infeld, 2006; Carlton et al., 2010). In addition, the reaction of isoprene and ozone was not included, since this reaction channel does not produce SOA (Pye et al., 2010).
In the original SORGAM, the SOA yields from reactions of NO3 with terpenes are assumed to be zero according
to Griffin et al. (1999) and the reaction of NO3 with
iso-prene is not considered. In this study, oxidation ofα-pinene, limonene and isoprene by NO3 radical was taken into
ac-count according, to the current state of knowledge (Pye et al., 2010). The partitioning coefficientsKi forα-pinene and limonene were calculated with the temperature functions in Table 3. The mass stoichiometric coefficientsαi for the re-action of isoprene with NO3were set to the largest value
ex-perimentally determined by Ng et al. (2008):
ISO+NO3→0.217·ISO1+0.217·ISO2. (7)
The mass stoichiometric coefficients αi for α-pinene and limonene were referred to the NO3 experiments as shown
by Table 4 of Griffin et al. (1999). In those experiments, an extremely high aerosol yield (α=1)was determined for the NO3 oxidation of bicyclic terpenes. To be compatible with
the two-product model applied in SORGAM, it was assumed there were two products with the same stoichiometric coeffi-cients of 0.5:
API+NO3→0.5·API1+0.5·API2, (8)
LIM+NO3→0.5·LIM1+0.5·LIM2. (9)
The mechanistic update of the SORGAM module with re-spect to the NO3oxidation in this study is in line with the
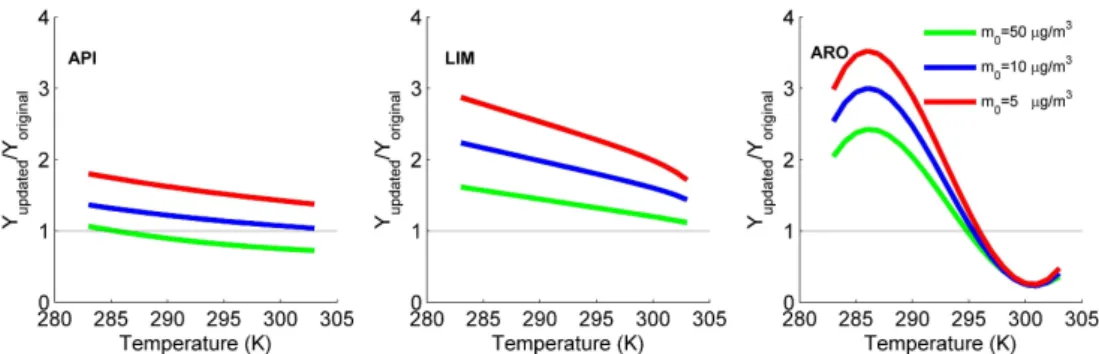
Fig. 3.Temperature dependence of the ratio between the updated SOA yields (Yupdated)calculated with temperature parameterizedαandK
and the original SOA yields (Yoriginal)used in SORGAM for mechanistic categories API, LIM and ARO for 3 different mass concentrations.
3 Results and discussions
3.1 Unified temperature parameterized functions – α(T )andK(T )
According to recent chamber studies, the SOA yields were found to vary significantly for different parent hydrocarbons and experiment conditions such as temperature. Since data are relatively abundant to characterize the temperature de-pendence for α-pinene, limonene and m-xylene, chamber studies with similar experimental conditions were used to de-rive unified temperature parameterized functions forα and
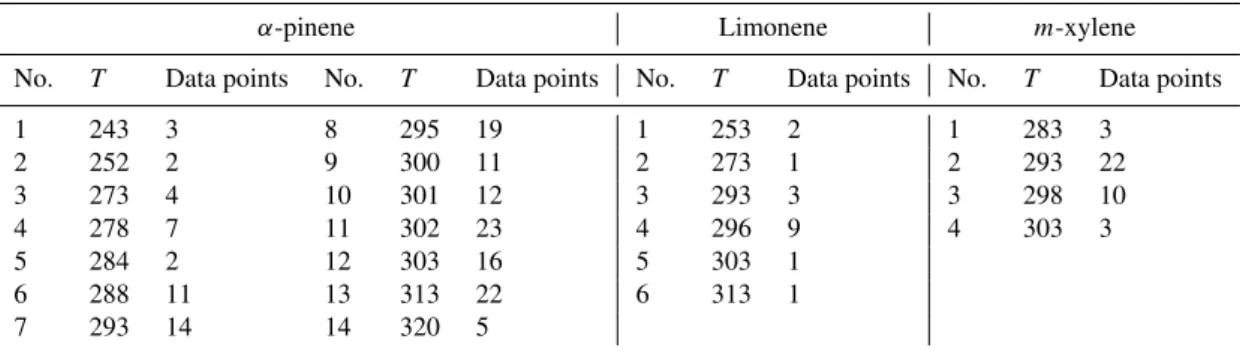
K. In this study, we grouped the available ozonolysis exper-iments forα-pinene and limonene, and photo-oxidation (OH initiated) experiments form-xylene (Chen and Hopke, 2010; Cocker et al., 2001a, b; Griffin et al., 1999; Hoffmann et al., 1997; Kamens et al., 1999; Odum et al., 1996; Offenberg et al., 2007; Pathak et al., 2007a, b; Presto et al., 2005; Presto and Donahue, 2006; Saathoff et al., 2009; Sarwar et al., 2007; Takekawa et al., 2003; Warren et al., 2009; Yu et al., 1999) as described in Table 2. Due to the fact that records ofα -pinene chamber data were more abundant than others, we were able to define 14 temperature bins ranging from 243 to 320 K. Limonene data, available in the temperature range of 253 to 313 K, was divided into 6 bins. Only 4 bins were used for m-xylene, since the temperature range of experimental data was quite limited (283 to 303 K).
Following the methodology described in Sect. 2.4, we de-rived unified temperature dependent functions for the mass stoichiometric coefficientα(T )and for the gas-particle par-titioning coefficient K(T ) for α-pinene, limonene and m -xylene, as shown in Table 3. We limited the form of the func-tions as the fundamental arithmetic in Eureqa to make them more tractable. On the other hand, the accuracy was consid-ered as well. If a linear function could not reflect the rela-tion between temperature and a parameter, the order of the function was increased, but not higher than 3. In SORGAM-TIN, the derivedα(T )andK(T )are extended to all oxida-tion pathways ofα-pinene, limonene andm-xylene assuming that similar oxidation products are produced from OH, NO3
and O3. According to the main reaction pathway of each
pre-cursor, the uncertainty of the extrapolation was estimated no more than 24 %.
To evaluate the effect of the newly derived α(T ) and
K(T ), the temperature dependence of the ratio of the
up-dated SOA yield against the original yield (Yupdated/Yoriginal)
for α-pinene, limonene and m-xylene are further analyzed and displayed in Fig. 3. Limited by the available experimen-tal data, the derivedα(T ) andK(T ) is only suitable from 283 K to 304 K. In case the temperature exceeds the scales, theα(T )andK(T )will be set asα(283),K(283) andα(304),
K(304) respectively. In Fig. 3, the yields are calculated based on Eq. (1), and threeM0 values (5, 10, 50 µg m−3)are
se-lected for different cases. Forα-pinene, updated SOA yields are higher at lowM0concentration (Yupdated/Yoriginal up to
1.80 and 1.37 with M0=5 and 10 µg m−3 at lower
tem-perature, respectively). However, whenM0 is high, the
up-dated yields are lower at higher temperatures (>286 K). For limonene, systematic higher SOA yields are shown in the up-dated model, with the ratio ofYupdated/Yoriginal up to 2.87,
2.24 and 1.62 at lower temperature, based on differentM0
load, respectively. For m-xylene, the updated SOA yields are higher (Yupdated/Yoriginal up to 2.43, 3.00 and 3.52 at
differentM0)at lower temperatures (<295 K) while lower
(Yupdated/Yoriginaldown to about 0.24) at higher temperatures
(>295 K).
3.2 Performance of the derivedα(T )andK(T )in chamber experiments
In chamber experiments forα-pinene, the oxidant was ozone, and the concentrations ofα-pinene ranged from 45 to 692 µg m−3(average: 229 µg m−3). In about half of the
experi-ments, seed aerosol was used (as (NH4)2SO4or NH4HSO4).
Table 2.Temperature grouping of the ozonolysis experiments ofα-pinene and limonene, and photo-oxidation (OH initiated) experiments of m-xylene for deriving unified temperature parameterized functions forαandK.
α-pinene Limonene m-xylene No. T Data points No. T Data points No. T Data points No. T Data points
1 243 3 8 295 19 1 253 2 1 283 3
2 252 2 9 300 11 2 273 1 2 293 22
3 273 4 10 301 12 3 293 3 3 298 10
4 278 7 11 302 23 4 296 9 4 303 3
5 284 2 12 303 16 5 303 1 6 288 11 13 313 22 6 313 1 7 293 14 14 320 5
The data in each group was taken from different references, listed as following:
α-pinene: Cocker et al. (2001a); Griffin et al. (1999); Hoffmann et al. (1997); Kamens et al. (1999); Offenberg et al. (2007); Pathak et al. (2007a, b); Presto et al., (2005); Presto and Donahue (2006); Saathoff et al. (2009); Warren et al. (2009); Yu et al. (1999).
Limonene: Saathoff et al. (2009); Sarwar et al. (2007); Chen and Hopke (2010). m-xylene: Takekawa et al. (2003); Cocker et al. (2001b); Odum et al. (1996).
Table 3a.The unified temperature parameterized functionsα(T )for mass stoichiometric coefficient (α).
species α1 α2
α-pinene α1=0.03315+T−13179.377.17 α2=6186T.77+0.0659·T−40.296 limonene α1=2.018e−3·T−0.3114 α2=3.32−0.0106·T
m-xylene α1=4.912e−5·T3+12.67·T−0.0432·T2−1237.702 α2=8.180e−5·T3+21.18·T−0.0721·T2−2071.922
Table 3b.The unified temperature parameterized functionsK(T )for gas-particle partitioning coefficient (K).
species K1 K2
α-pinene K1= 2.419
3.658e−4·T2−0.181·T+22.35 K2=121.175·T2−586114605..5481·T+7319862.5
limonene K1= 1000.55
T−245.94−16.7212 K2=T−227228.58.84−1.0581
m-xylene K1=2.675e−3·T3+691.21·T−2.356·T2−67553.914 K2=5.952e−6·T3+1.55·T−5.256e−3·T2−151.349
aerosols in these experiments, and the RH was lower than 10 % in most of cases. Form-xylene, the oxidant was OH radical, and the concentrations ofm-xylene were in the range of 256 to 2114 µg m−3(average: 1123 µg m−3). Sulfate seed
aerosols were used in the experiments, and the RH was low (<10 %) in more than 75 % of the experiments.
We further validated the derivedα(T )andK(T )by com-paring the modeled results against available chamber ex-periments. Original SORGAM model and SORGAM-TIN were employed to simulate the SOA formed byα-pinene, limonene andm-xylene, and the SOA by isoprene was also tested in the SORGAM-TIN.
In Fig. 4, the original model usually overestimates SOA concentration for all three precursors; but for these precur-sors the simulated SOA concentrations are closest to the ob-servation data by SORGAM-TIN. Due to fewer data points available from only one experiment at a fixed temperature, the simulation of isoprene SOA performs very well.
To evaluate the performance of each model quantitatively, normalized mean bias (NMB) and normalized mean errors
(NME) were calculated by the following formulae:
NMB= n P i=1
(Csi−Cio) n P i=1
Cio
×100 %,NME= n P i=1
|Csi−Cio| n P i=1
Cio
×100 %,
whereCis andCioare simulated and observed SOA concen-tration respectively.
Fig. 4.Comparisons of observed chamber experiment data (x-axis) with original SORGAM (green) and SORGAM-TIN (pink) simulations (y-axis) for(a)α-pinene,(b)limonene,(c)m-xylene, and(d)isoprene.
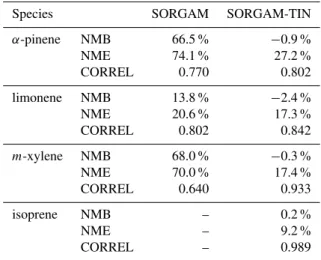
Table 4.Evaluation of box model simulations with SORGAM and SORGAM-TIN for all species.
Species SORGAM SORGAM-TIN α-pinene NMB 66.5 % −0.9 % NME 74.1 % 27.2 % CORREL 0.770 0.802 limonene NMB 13.8 % −2.4 % NME 20.6 % 17.3 % CORREL 0.802 0.842
m-xylene NMB 68.0 % −0.3 % NME 70.0 % 17.4 % CORREL 0.640 0.933 isoprene NMB – 0.2 %
NME – 9.2 %
CORREL – 0.989
simulated values for the optimized functions are higher than those for the original model (R as 0.802 vs. 0.770 for α -pinene; 0.842 vs. 0.802 for limonene; 0.933 vs. 0.640 for
m-xylene). According to the results in Table 4, the simulated SOA concentration by the SORGAM-TIN agreed well with observations in chamber experiments.
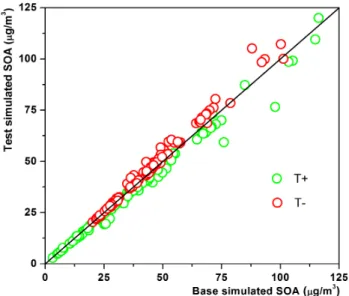
We took α-pinene as an example to show the influence of temperature. In Fig. 5, the temperature test cases are computed with±5 K. Although the temperature influences both reaction rate and partitioning coefficient, it can be seen
that simulated SOA concentrations increased with decreas-ing temperature, with changes of+9 % and−6 % in average at low and high temperatures, respectively. It is noticed that when the mass of SOA is low, the influence of temperature is higher, because with a lowM0a small change of SOA
con-centration may lead to a large rate of change.
3.3 The application of SORGAM-TIN in EURAD-IM
3.3.1 The campaign in Cabauw
Within the frame of the EUCAARI project, a comprehensive field campaign – IMPACT (Intensive Measurement Period At Cabauw Tower) campaign – was conducted in May 2008 in Cabauw, the Netherlands. The measurement site, namely, the Cabauw Experimental Site for Atmospheric Research (CE-SAR), is located in the center of the Netherlands (51.972◦N,
4.926◦E).
During the campaign, the temperature in Cabauw was be-tween 283 and 298 K, with the average temperature higher in the first half part than in the second part. The prevailing wind was easterly wind of continental origin induced by an anti-cyclone regime till 15 May and changed to northerly wind during 15–17 May, due to the passage of a frontal system. Strong precipitation occurred on 16 and 17 May, and another precipitation event took place at the end of the month.
Fig. 5.Box model sensitivity study on temperature for SOA mass produced fromα-pinene The base case is the same as the final result in Fig. 4, and the test cases are calculated with 5 K higher (T+)and 5 K lower (T−) temperature.
semi-volatile oxygenated organic aerosol (SV-OOA) and low-volatile OOA (LV-OOA) factors from AMS measure-ments (Mensah et al., 2012) followed by a positive matrix factorization (PMF) analysis (Docherty et al., 2008). In pre-vious studies, Docherty et al. (2008) calculated the concen-tration of SOA by some widely used methods, such as EC and CO tracer methods, water soluble organic carbon con-tent, chemical mass balance of organic molecular markers and PMF results from AMS data. The comparison of pre-dicted SOA/OA ratios by these methods showed that the ra-tio obtained by the AMS (aerosol mass spectrometer)-PMF method was the median and very close to the average of the results of these methods. Therefore the results derived from the AMS-PMF method were considered to be a good observational estimation of SOA concentrations. However, the AMS-PMF method also contains two major uncertain-ties: one is the accuracy of the AMS measurement itself, which is mainly limited by the uncertainty of the applied collection efficiency (Canagaratna et al., 2007); the other is the uncertainty of the subsequent PMF analysis (Ulbrich et al., 2009). With respect to the Caubauw dataset, the ap-plied collection efficiency of AMS measurement was val-idated against a SMPS instrument; the inorganic and or-ganic compositions measured by AMS were inter-compared against MARGA and TD-PTR-MS, respectively (Mensah et al., 2012). In general, reasonable good agreements between AMS and MARGA, and between AMS and TD-PTR-MS were achieved.
Fig. 6.Time series of observed (black dots) and simulated (gray line)(a)ozone,(b)sulfate and(c)nitrate in Cabauw May 2008.
3.3.2 EURAD-IM modeling system
The EURAD-IM used in this study simulates the physical and chemical evolution of trace gases and aerosols in the tro-posphere and lower stratosphere. The meteorological fields needed by EURAD-IM were computed using MM5 version 3 (Grell et al., 1994). The RACM-MIM-GK chemical mech-anism (Stockwell et al., 1997; Geiger et al., 2003; Karl et al., 2006; Lu et al., 2012) was used to describe the atmospheric gas phase chemistry. The aerosol module used is MADE con-taining SORGAM. The spatial distribution of anthropogenic emissions was derived from a high-resolution emission in-ventory (Kuenen et al., 2011) for the year 2007 based on the TNO emission inventory for 2005 (Denier van der Gon et al., 2010). Biogenic emissions were taken from Symeonidis et al. (2008) or calculated using the parameterizations of Lamb et al. (1993) for regions where the data is not available in Symenoidis et al. (2008). A horizontal resolution of 45 km was chosen, the atmosphere was divided into 23 vertical lay-ers, and the height of the near surface layer was 35 m.
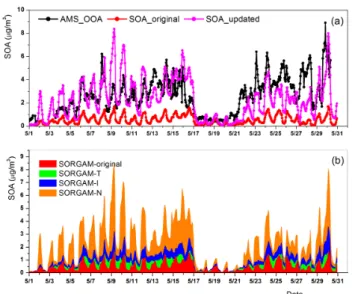
Fig. 7.Time series of AMS OOA and simulated SOA concentra-tion in Cabauw 2008.(a)Black: observation; red: simulation results of original SORGAM; pink: results of SORGAM-TIN.(b)Green: increased SOA concentration by the temperature functions; blue: increased SOA concentration by isoprene; orange: increased SOA concentration by NO3chemical pathways.
3.3.3 The simulation of SOA with SORGAM-TIN in Cabauw
Comparisons of simulated SOA concentrations by both the SORGAM and SORGAM-TIN and the observed SOA con-centrations as represented by the sum of LV-OOA and SV-OOA from AMS measurements are shown in Fig. 7. In Fig. 7a, the observed SOA concentration is strongly under-estimated by SORGAM, while it is in general reasonably re-produced by SORGAM-TIN.
Following the division of the generic synoptic sys-tem as discussed in Hamburger et al. (2011) the model– measurement inter-comparisons are further studied for two selected periods: (1) the first half of May (1–15 May), which was controlled by subsiding air masses due to an anticyclone event, and (2) the second half of May (18–31 May), which was dominated by a westerly frontal passage. As mentioned above, precipitation occurred on 16 and 17 May.
The Benelux states always experienced the most serious air pollution over Europe in both periods as characterized by the airborne measurements and ground measurements at Caubaw (Hamburger et al., 2011). Interestingly, the ob-served SOA concentrations were much better reproduced by SORGAM-TIN for the first period than for the second pe-riod. The difference between these two periods was that the air was quite stagnant in the first period while constant west-erly inflow took place during the second period. Addition-ally, the EURAD-IM model also overestimated the temper-ature at the second period. Therefore, an underestimation of the observed SOA concentration in the second period may
be attributed to deficits of the transport term or temperature corrections of K andα. In the first period, apart from the general good agreement, the SORGAM-TIN strongly over-estimated the observed SOA concentrations on 9 May. An-other strong overestimation of SOA by SORGAM-TIN for 16 May can be attributed to a general failure of the EURAD-IM system to simulate time, location, and intensity of pre-cipitation. This general failure was also found in the large model–measurement discrepancy of O3, sulfate and nitrate,
as discussed above (Fig. 6). However, the reason for the large discrepancy on 9 May is probably due to errors of the SORGAM-N framework since the other parameters were well simulated in the EURAD-IM system.
To separate the contribution of the newly added SOA pa-rameterizations, a cumulative plot of the SOA concentrations modeled by the individual updates (Table 5 to summarize the sensitivity studies tested with the EURAD-IM system) is shown in Fig. 7b.
The original SORGAM can only predict 20 % of the ob-served SOA concentration. The application of bothα(T )and
K(T )enhanced the simulated SOA concentration up to 27 %
of the observation, with an increment of 7 %. Moreover, the addition of isoprene SOA further increased the SOA concen-tration by 15 % of the observation on average. Lastly, includ-ing NO3oxidation as SOA formation pathways leads to an
average increment of SOA by 32 % of the observation. Over-all, the modeled SOA concentration by SORGAM-TIN on average reproduced 88 % of the observation.
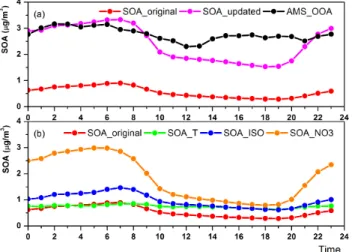
Figure 8 further shows the averaged diurnal variation of the observed and modeled SOA concentration by SORGAM, SORGAM-TIN and the three important mechanistic updates as summarized in Table 5, including the effect of each im-provement. The temperature functions usually increase the SOA concentration in the daytime and even decrease the con-centration during the early morning. Adding isoprene does not change the diurnal variation of the SOA concentration, but increases the concentration on average. Employing NO3
pathways immensely increases the SOA concentration dur-ing nighttime since the NO3 chemistry often becomes
sig-nificant at nighttime due to the small NO concentration and missing insolation.
Fig. 8.Mean diurnal profiles of observed and modeled SOA con-centrations in Cabauw from 5–29 May 2008.(a)Black: observa-tion; red: simulation results of original SORGAM; pink: results of the updated SOA module.(b)Green: original SORGAM with tem-perature functions; blue: original SORGAM with isoprene; orange: original SORGAM with NO3chemical pathways.
anthropogenic and biogenic precursors showed that anthro-pogenic SOA could promote the formation and persistence of biogenic SOA (Emanuelsson et al., 2013). Underestimated OH concentrations and missing interaction processes of an-thropogenic and biogenic SOA could thus at least partially explain the underestimated SOA concentration in the after-noon.
We compare this study to other similar reports regard-ing the SOA simulation in Europe. The simulation with the CHIMERE model in Paris, spring 2007, was reported by Sciare et al. (2010), who found that the SOA was underes-timated possibly due to missing potential sources of SOA in the model such as the aging of POA and oligomeriza-tion. Couvidat et al. (2012) simulated the SOA formation from isoprene oxidation with two sets of parameterizations (Henze and Seinfeld, 2006; Couvidat and Seigneur, 2011), and found out that the latter (Couvidat and Seigneur, 2011) calculated higher concentrations of isoprene SOA than the former (Henze and Seinfeld, 2006). The former is currently widely used in different CTMs and may underestimate iso-prene produced SOA masses. Bergstr¨om et al. (2012) used the EMEP model with VBS method to simulate long-term OC (organic carbon) over Europe, covering 2002–2007. Dif-ferent VBS schemes were employed, and the results indi-cated that considering aging of POA and primary emissions of semi-volatile components could significantly increase the simulated SOA concentrations. By comparing to these other model–measurement comparisons, we recognized that the missing of aerosol aging processes, the missing oligomeriza-tion process, the missing contribuoligomeriza-tions from primary emitted semi-volatile organic compounds (SVOCs) and the parame-terization of isoprene SOA formation process (e.g., the major
Table 5.The performance of adjusted models.
Simulations/ Simulations/ observation original simulation Original SORGAM 0.20 1.00 SORGAM-T 0.27 1.35 SORGAM-I 0.35 1.75 SORGAM-N 0.52 2.60 SORGAM-TIN 0.88 4.40
SOA products were identified as 2-methyltetrols in both lab-oratory and field studies, cf. Claeys et al., 2004; Fu et al., 2010) could be possible reasons for the afternoon SOA un-derestimations with SORGAM-TIN as well.
Overall the normalized mean error for the updated model in this period was 32.7 %, which is similar to the results in other studies by PMCAMx (Tsimpidi et al., 2010; Murphy et al., 2010), and much better than the NME of 80.1 % by the original SORGAM
4 Conclusions
As a continuous effort of the EURAD-IM development, we extensively updated the SORGAM module in EURAD-IM in this study. The new module, SORGAM-TIN, received three major modifications: (1) temperature dependent func-tions of SOA yields, (2) photo oxidation products from iso-prene and (3) NO3 initiated oxidation products from
bio-genic VOCs. To derive the temperature dependent func-tions of SOA yields, we summarized the recently published chamber experimental results for α-pinene, limonene and
m-xylene and set them into a series of temperature inter-val defined bins. The optimization software Lsqnonlin, Eu-reqa and Nl2sol were employed to deduce temperature de-pendent functions in three steps through nonlinear optimiza-tions. In addition, the influences of relative humidity, tem-perature and contributions of anthropogenic VOCs to SOA formation were also considered. However, they only show marginal contributions to SOA simulations. The SORGAM-TIN was shown to perform well in reproducing chamber ex-periments, with normalized mean errors of less than 30 % in the box model. In contrast, the normalized mean error for the original SORGAM module is much worse especially for
the simulated SOA concentration with SORGAM-TIN could explain on average 88 % of the observed SOA. The largely improved model results were mainly contributed to the im-plementation of temperature dependentα (T )andK(T ), the photo oxidation of isoprene and the NO3initiated oxidation
of biogenic VOCs, contributing 7, 15 and 32 % of the obser-vations, respectively.
However, there are still significant daytime measurement– model discrepancies for SORGAM-TIN, especially for the afternoon hours. Details of the remaining discrepancies re-main speculative and still need to be explored in future, when more laboratory and field data are available. In princi-ple, in SORGAM-TIN, considerations of aerosol aging pro-cesses (Rudich et al., 2007; Donahue et al., 2012) are miss-ing, and the assumption of all SOA being formed in ther-modynamic equilibrium processes may be wrong (Perraud et al., 2012). In addition, due to a general underestimation of ambient OH concentrations reported for forest, rural and suburban areas (Stone et al., 2012), the production rates of the oxidation products during daytime are uncertain as well. Moreover, according to our model tests performed herein, the reactions of the NO3radical with biogenic VOCs are found
to be important for SOA formation. More laboratory and field experiments on this aspect are therefore required in the future. Oligomerization processes, mixed precursors, multi-phase and multigenerational reactions should be included in future work as well.
Acknowledgements. We acknowledge financial support by the National Natural Science Foundation of China (Major Program: 21190052&Innovative Research Group: 41121004), Strategic Priority Research Program of the Chinese Academy of Sciences (grant no. XDB05010500) and by EU-project CityZen (grant no. 212095) and PEGASOS (grant no. 265307). Discussions with M. Zheng are gratefully acknowledged.
The service charges for this open access publication have been covered by a Research Centre of the Helmholtz Association.
Edited by: H. Su
References
Ackermann, I. J., Hass, H., Memmesheimer, M., Ebel, A., Binkowski, F. S., and Shankar, U.: Modal aerosol dynamics model for Europe: Development and first applications, Atmos. Environ., 32, 2981–2999, 1998.
Bergstr¨om, R., Denier van der Gon, H. A. C., Pr´evˆot, A. S. H., Yttri, K. E., and Simpson, D.: Modelling of organic aerosols over Eu-rope (2002–2007) using a volatility basis set (VBS) framework: application of different assumptions regarding the formation of secondary organic aerosol, Atmos. Chem. Phys., 12, 8499–8527, doi:10.5194/acp-12-8499-2012, 2012.
Canagaratna, M. R., Jayne, J. T., Jimenez, J. L., Allan, J. D., Al-farra, M. R., Zhang, Q., Onasch, T. B., Drewnick, F., Coe, H.,
Middlebrook, A., Delia, A., Williams, L. R., Trimborn, A. M., Northway, M. J., DeCarlo, P. F., Kolb, C. E., Davidovits, P., and Worsnop, D. R.: Chemical and microphysical characterization of ambient aerosols with the aerodyne aerosol mass spectrometer, Mass Spectrom. Rev., 26, 185–222, 2007.
Cappa, C. D., Zhang, X., Loza, C. L., Craven, J. S., Yee, L. D., and Seinfeld, J. H.: Application of the Statistical Oxidation Model (SOM) to Secondary Organic Aerosol formation from photoox-idation of C12 alkanes, Atmos. Chem. Phys., 13, 1591–1606, doi:10.5194/acp-13-1591-2013, 2013.
Carlton, A. G., Bhave, P. V., Napelenok, S. L., Edney, E. D., Sarwar, G., Pinder, R. W., Pouliot, G. A., and Houyoux, M.: Model Rep-resentation of Secondary Organic Aerosol in CMAQv4.7, Envi-ron. Sci. Technol., 44, 8553–8560, 2010.
Chen, X. and Hopke, P. K.: A chamber study of secondary organic aerosol formation by limonene ozonolysis, Indoor Air, 20, 320– 328, 2010.
Chervenkov, H. and Jakobs, H.: Dust storm simulation with regional air quality model – Problems and results, Atmos. Environ., 45, 3965–3976, 2011.
Chhabra, P. S., Flagan, R. C., and Seinfeld, J. H.: Elemental analysis of chamber organic aerosol using an aerodyne high-resolution aerosol mass spectrometer, Atmos. Chem. Phys., 10, 4111–4131, doi:10.5194/acp-10-4111-2010, 2010.
Chung, S. H. and Seinfeld, J. H.: Global distribution and climate forcing of carbonaceous aerosols, J. Geophys. Res.-Atmos., 107, 4407, doi:10.1029/2001JD001397, 2002.
Claeys, M., Graham, B., Vas, G., Wang, W., Vermeylen, R., Pashyn-ska, V., Cafmeyer, J., Guyon, P., Andreae, M. O., Artaxo, P., and Maenhaut, W.: Formation of secondary organic aerosols through photooxidation of isoprene, Science, 303, 1173–1176, 2004. Cocker, D. R., Clegg, S. L., Flagan, R. C., and Seinfeld, J. H.: The
effect of water on gas-particle partitioning of secondary organic aerosol. Part I: alpha-pinene/ozone system, Atmos. Environ., 35, 6049–6072, 2001a.
Cocker, D. R., Mader, B. T., Kalberer, M., Flagan, R. C., and Seinfeld, J. H.: The effect of water on gas-particle partition-ing of secondary organic aerosol: II. m-xylene and 1, 3, 5-trimethylbenzene photooxidation systems, Atmos. Environ., 35, 6073–6085, 2001b.
Colette, A., Granier, C., Hodnebrog, Ø., Jakobs, H., Maurizi, A., Nyiri, A., Bessagnet, B., D’Angiola, A., D’Isidoro, M., Gauss, M., Meleux, F., Memmesheimer, M., Mieville, A., Rou¨ıl, L., Russo, F., Solberg, S., Stordal, F., and Tampieri, F.: Air quality trends in Europe over the past decade: a first multi-model assess-ment, Atmos. Chem. Phys., 11, 11657–11678, doi:10.5194/acp-11-11657-2011, 2011.
Couvidat, F. and Seigneur, C.: Modeling secondary organic aerosol formation from isoprene oxidation under dry and humid condi-tions, Atmos. Chem. Phys., 11, 893–909, doi:10.5194/acp-11-893-2011, 2011.
Couvidat, F., Debry, E., Sartelet, K., and Seigneur, C.: A hy-drophilic/hydrophobic organic ((HO)-O-2) aerosol model: De-velopment, evaluation and sensitivity analysis, J. Geophys. Res.-Atmos., 117, D10304, doi:10.1029/2011JD017214, 2012. Denier van der Gon, H., Visschedijk, A., Kuenen, J., van der Brugh,
Composi-tion and Climate, Geophys. Res. Abstracts, Vol. 12, EGU2010-10800-1, 2010.
Dennis, J. E., Gay, D. M. and Welsch, R. E.: ALGORITHM 573 – NL2SOL – AN ADAPTIVE NON-LINEAR LEAST-SQUARES ALGORITHM E4, Acm T. Math. Software., 7, 369–383, 1981. Docherty, K. S., Stone, E. A., Ulbrich, I. M., DeCarlo, P. F., Snyder,
D. C., Schauer, J. J., Peltier, R. E., Weber, R. J., Murphy, S. M., Seinfeld, J. H., Grover, B. D., Eatough, D. J., and Jimenez, J. L.: Apportionment of Primary and Secondary Organic Aerosols in Southern California during the 2005 Study of Organic Aerosols in Riverside (SOAR-1), Environ. Sci. Technol., 42, 7655–7662, 2008.
Dommen, J., Metzger, A., Duplissy, J., Kalberer, M., Alfarra, M. R., Gascho, A., Weingartner, E., Prevot, A. S. H., Verheggen, B., and Baltensperger, U.: Laboratory observation of oligomers in the aerosol from isoprene/NO(x) photooxidation, Geophys. Res. Lett., 33, L13805, doi:10.1029/2006gl026523, 2006.
Donahue, N. M., Robinson, A. L., Stanier, C. O., and Pandis, S. N.: Coupled partitioning, dilution, and chemical aging of semivolatile organics, Environ. Sci. Technol., 40, 2635–2643, 2006.
Donahue, N. M., Henry, K. M., Mentel, T. F., Kiendler-Scharr, A., Spindler, C., Bohn, B., Brauers, T., Dorn, H. P., Fuchs, H., Till-mann, R., Wahner, A., Saathoff, H., NauTill-mann, K. H., Mohler, O., Leisner, T., Muller, L., Reinnig, M. C., Hoffmann, T., Salo, K., Hallquist, M., Frosch, M., Bilde, M., Tritscher, T., Barmet, P., Praplan, A. P., DeCarlo, P. F., Dommen, J., Prevot, A. S. H., and Baltensperger, U.: Aging of biogenic secondary organic aerosol via gas-phase OH radical reactions, P. Natl. Acad. Sci. USA, 109, 13503–13508, 2012.
Elbern, H., Strunk, A., Schmidt, H., and Talagrand, O.: Emission rate and chemical state estimation by 4-dimensional variational inversion, Atmos. Chem. Phys., 7, 3749–3769, doi:10.5194/acp-7-3749-2007, 2007.
Emanuelsson, E. U., Hallquist, M., Kristensen, K., Glasius, M., Bohn, B., Fuchs, H., Kammer, B., Kiendler-Scharr, A., Nehr, S., Rubach, F., Tillmann, R., Wahner, A., Wu, H.-C., and Mentel, Th. F.: Formation of anthropogenic secondary organic aerosol (SOA) and its influence on biogenic SOA properties, Atmos. Chem. Phys., 13, 2837–2855, doi:10.5194/acp-13-2837-2013, 2013. Fry, J. L., Kiendler-Scharr, A., Rollins, A. W., Wooldridge, P. J.,
Brown, S. S., Fuchs, H., Dub´e, W., Mensah, A., dal Maso, M., Tillmann, R., Dorn, H.-P., Brauers, T., and Cohen, R. C.: Organic nitrate and secondary organic aerosol yield from NO3oxidation ofβ-pinene evaluated using a gas-phase
kinet-ics/aerosol partitioning model, Atmos. Chem. Phys., 9, 1431– 1449, doi:10.5194/acp-9-1431-2009, 2009.
Fry, J. L., Kiendler-Scharr, A., Rollins, A. W., Brauers, T., Brown, S. S., Dorn, H.-P., Dub´e, W. P., Fuchs, H., Mensah, A., Rohrer, F., Tillmann, R., Wahner, A., Wooldridge, P. J., and Cohen, R. C.: SOA from limonene: role of NO3in its generation and
degrada-tion, Atmos. Chem. Phys., 11, 3879–3894, doi:10.5194/acp-11-3879-2011, 2011.
Fu, P. Q., Kawamura, K., Pavuluri, C. M., Swaminathan, T., and Chen, J.: Molecular characterization of urban organic aerosol in tropical India: contributions of primary emissions and sec-ondary photooxidation, Atmos. Chem. Phys., 10, 2663–2689, doi:10.5194/acp-10-2663-2010, 2010.
Fu, T.-M., Jacob, D. J., Wittrock, F., Burrows, J. P., Vrekous-sis, M., and Henze, D. K.: Global budgets of atmospheric gly-oxal and methylglygly-oxal, and implications for formation of sec-ondary organic aerosols, J. Geophys. Res.-Atmos., 113, D15303, doi:10.1029/2007jd009505, 2008.
Geiger, H., Barnes, I., Bejan, J., Benter, T. and Spittler, M.: The tro-pospheric degradation of isoprene: an updated module for the re-gional atmospheric chemistry mechanism, Atmos. Environ., 37, 1503–1519, 2003.
Grell, G. A., Dudhia, J., and Stauffer, D. R.: A description of the fifth generation Penn State/NCAR mesoscale model (MM5); NCAR TN-398+IA, technical report, National Center for Atmo-spheric Research, Boulder, Colorado, 1994.
Griffin, R. J., Cocker, D. R., Flagan, R. C., and Seinfeld, J. H.: Or-ganic aerosol formation from the oxidation of biogenic hydrocar-bons, J. Geophys. Res.-Atmos., 104, 3555–3567, 1999. Guenther, A., Zimmerman, P., Klinger, L., Greenberg, J., Ennis, C.,
Davis, K., Pollock, W., Westberg, H., Allwine, G., and Geron, C.: Estimates of regional natural volatile organic compound fluxes from enclosure and ambient measurements, J. Geophys. Res.-Atmos., 101, 1345–1359, 1996.
Guenther, A., Karl, T., Harley, P., Wiedinmyer, C., Palmer, P. I., and Geron, C.: Estimates of global terrestrial isoprene emissions using MEGAN (Model of Emissions of Gases and Aerosols from Nature), Atmos. Chem. Phys., 6, 3181–3210, doi:10.5194/acp-6-3181-2006, 2006.
Hallquist, M., Wenger, J. C., Baltensperger, U., Rudich, Y., Simp-son, D., Claeys, M., Dommen, J., Donahue, N. M., George, C., Goldstein, A. H., Hamilton, J. F., Herrmann, H., Hoff-mann, T., Iinuma, Y., Jang, M., Jenkin, M. E., Jimenez, J. L., Kiendler-Scharr, A., Maenhaut, W., McFiggans, G., Mentel, Th. F., Monod, A., Pr´evˆot, A. S. H., Seinfeld, J. H., Surratt, J. D., Szmigielski, R., and Wildt, J.: The formation, properties and im-pact of secondary organic aerosol: current and emerging issues, Atmos. Chem. Phys., 9, 5155–5236, doi:10.5194/acp-9-5155-2009, 2009.
Hamburger, T., McMeeking, G., Minikin, A., Birmili, W., Dall’Osto, M., O’Dowd, C., Flentje, H., Henzing, B., Junninen, H., Kristensson, A., de Leeuw, G., Stohl, A., Burkhart, J. F., Coe, H., Krejci, R., and Petzold, A.: Overview of the synop-tic and pollution situation over Europe during the EUCAARI-LONGREX field campaign, Atmos. Chem. Phys., 11, 1065– 1082, doi:10.5194/acp-11-1065-2011, 2011.
Heald, C. L., Jacob, D. J., Park, R. J., Russell, L. M., Huebert, B. J., Seinfeld, J. H., Liao, H., and Weber, R. J.: A large organic aerosol source in the free troposphere missing from current models, Geo-phys. Res. Lett., 32, L18809, doi:10.1029/2005gl023831, 2005. Henze, D. K. and Seinfeld, J. H.: Global secondary organic aerosol
from isoprene oxidation, Geophys. Res. Lett., 33, L09812, doi:10.1029/2006gl025976, 2006.
Hoffmann, T., Odum, J. R., Bowman, F., Collins, D., Klockow, D., Flagan, R. C., and Seinfeld, J. H.: Formation of organic aerosols from the oxidation of biogenic hydrocarbons, J. Atmos. Chem., 26, 189–222, 1997.
Jimenez, J. L., Canagaratna, M. R., Donahue, N. M., Prevot, A. S. H., Zhang, Q., Kroll, J. H., DeCarlo, P. F., Allan, J. D., Coe, H., Ng, N. L., Aiken, A. C., Docherty, K. S., Ulbrich, I. M., Grieshop, A. P., Robinson, A. L., Duplissy, J., Smith, J. D., Wil-son, K. R., Lanz, V. A., Hueglin, C., Sun, Y. L., Tian, J., Laak-sonen, A., Raatikainen, T., Rautiainen, J., Vaattovaara, P., Ehn, M., Kulmala, M., Tomlinson, J. M., Collins, D. R., Cubison, M. J., Dunlea, E. J., Huffman, J. A., Onasch, T. B., Alfarra, M. R., Williams, P. I., Bower, K., Kondo, Y., Schneider, J., Drewnick, F., Borrmann, S., Weimer, S., Demerjian, K., Salcedo, D., Cot-trell, L., Griffin, R., Takami, A., Miyoshi, T., Hatakeyama, S., Shimono, A., Sun, J. Y., Zhang, Y. M., Dzepina, K., Kimmel, J. R., Sueper, D., Jayne, J. T., Herndon, S. C., Trimborn, A. M., Williams, L. R., Wood, E. C., Middlebrook, A. M., Kolb, C. E., Baltensperger, U., and Worsnop, D. R.: Evolution of Organic Aerosols in the Atmosphere, Science, 326, 1525–1529, 2009. Jonsson, ˚A. M., Hallquist, M., and Ljungstr¨om, E.: The effect
of temperature and water on secondary organic aerosol forma-tion from ozonolysis of limonene,13-carene andα-pinene, At-mos. Chem. Phys., 8, 6541–6549, doi:10.5194/acp-8-6541-2008, 2008.
Kamens, R., Jang, M., Chien, C. J., and Leach, K.: Aerosol for-mation from the reaction of alpha-pinene and ozone using a gas-phase kinetics aerosol partitioning model, Environ. Sci. Technol., 33, 1430–1438, 1999.
Kamens, R. M., Zhang, H. F., Chen, E. H., Zhou, Y., Parikh, H. M., Wilson, R. L., Galloway, K. E., and Rosen, E. P.: Secondary organic aerosol formation from toluene in an atmospheric hydro-carbon mixture: Water and particle seed effects, Atmos. Environ., 45, 2324–2334, 2011.
Karl, M., Dorn, H. P., Holland, F., Koppmann, R., Poppe, D., Rupp, L., Schaub, A., and Wahner, A.: Product study of the reaction of OH radicals with isoprene in the atmosphere simulation chamber SAPHIR, J. Atmos. Chem., 55, 167–187, 2006.
Kavouras, I. G., Mihalopoulos, N., and Stephanou, E. G.: Formation of atmospheric particles from organic acids produced by forests, Nature, 395, 683–686, 1998.
Kesselmeier, J. and Staudt, M.: Biogenic volatile organic com-pounds (VOC): An overview on emission, physiology and ecol-ogy, J. Atmos. Chem., 33, 23–88, 1999.
Kleindienst, T. E., Lewandowski, M., Offenberg, J. H., Jaoui, M., and Edney, E. O.: The formation of secondary organic aerosol from the isoprene + OH reaction in the absence of NOx,
At-mos. Chem. Phys., 9, 6541–6558, doi:10.5194/acp-9-6541-2009, 2009.
Kroll, J. H., Ng, N. L., Murphy, S. M., Flagan, R. C., and Sein-feld, J. H.: Secondary organic aerosol formation from isoprene photooxidation, Environ. Sci. Technol., 40, 1869–1877, 2006. Kuenen, J., Denier van der Gon, H., Visschedijk, A., and van der
Brugh, H.: High resolution European emission inventory for the years 2003–2007, TNO report TNO-060-UT-2011-00588, Utrecht, 2011.
Lamb, B., Gay, D., Westberg, H., and Pierce, T.: A Biogenic Hydro-carbon Emission Inventory for the USA Using a Simple Forest Canopy Model, Atmos. Environ. Part A, 27, 1673–1690, 1993. Lane, T. E., Donahue, N. M., and Pandis, S. N.: Simulating
sec-ondary organic aerosol formation using the volatility basis-set approach in a chemical transport model, Atmos. Environ., 42, 7439–7451, 2008.
Lu, K. D., Rohrer, F., Holland, F., Fuchs, H., Bohn, B., Brauers, T., Chang, C. C., H¨aseler, R., Hu, M., Kita, K., Kondo, Y., Li, X., Lou, S. R., Nehr, S., Shao, M., Zeng, L. M., Wahner, A., Zhang, Y. H., and Hofzumahaus, A.: Observation and modelling of OH and HO2concentrations in the Pearl River Delta 2006: a missing
OH source in a VOC rich atmosphere, Atmos. Chem. Phys., 12, 1541–1569, doi:10.5194/acp-12-1541-2012, 2012.
Lu, K. D., Hofzumahaus, A., Holland, F., Bohn, B., Brauers, T., Fuchs, H., Hu, M., H¨aseler, R., Kita, K., Kondo, Y., Li, X., Lou, S. R., Oebel, A., Shao, M., Zeng, L. M., Wahner, A., Zhu, T., Zhang, Y. H., and Rohrer, F.: Missing OH source in a suburban environment near Beijing: observed and modelled OH and HO2
concentrations in summer 2006, Atmos. Chem. Phys., 13, 1057– 1080, doi:10.5194/acp-13-1057-2013, 2013.
Mensah, A. A., Holzinger, R., Otjes, R., Trimborn, A., Mentel, Th. F., ten Brink, H., Henzing, B., and Kiendler-Scharr, A.: Aerosol chemical composition at Cabauw, The Netherlands as observed in two intensive periods in May 2008 and March 2009, Atmos. Chem. Phys., 12, 4723–4742, doi:10.5194/acp-12-4723-2012, 2012.
Monteiro, A., Strunk, A., Carvalho, A., Tchepel, O., Miranda, A. I., Borrego, C., Saavedra, S., Rodriguez, A., Souto, J., Casares, J., Friese, E., and Elbern, H.: Investigating a high ozone episode in a rural mountain site, Environ. Pollut., 162, 176–189, 2012. Murphy, B. N. and Pandis, S. N.: Exploring summertime organic
aerosol formation in the eastern United States using a regional-scale budget approach and ambient measurements, J. Geophys. Res.-Atmos., 115, D24216, doi:10.1029/2010JD014418, 2010. Murphy, B. N., Donahue, N. M., Fountoukis, C., Dall’Osto, M.,
O’Dowd, C., Kiendler-Scharr, A., and Pandis, S. N.: Function-alization and fragmentation during ambient organic aerosol ag-ing: application of the 2-D volatility basis set to field stud-ies, Atmos. Chem. Phys., 12, 10797–10816, doi:10.5194/acp-12-10797-2012, 2012.
Naumann, K. H.: COSIMA – a computer program simulating the dynamics of fractal aerosols, J. Aerosol Sci., 34, 1371–1397, 2003.
Ng, N. L., Kwan, A. J., Surratt, J. D., Chan, A. W. H., Chhabra, P. S., Sorooshian, A., Pye, H. O. T., Crounse, J. D., Wennberg, P. O., Flagan, R. C., and Seinfeld, J. H.: Secondary organic aerosol (SOA) formation from reaction of isoprene with nitrate radicals (NO3), Atmos. Chem. Phys., 8, 4117–4140,
doi:10.5194/acp-8-4117-2008, 2008.
Odum, J. R., Hoffmann, T., Bowman, F., Collins, D., Flagan, R. C., and Seinfeld, J. H.: Gas/particle partitioning and secondary organic aerosol yields, Environ. Sci. Technol., 30, 2580–2585, 1996.
Odum, J. R., Jungkamp, T. P. W., Griffin, R. J., Flagan, R. C., and Seinfeld, J. H.: The atmospheric aerosol-forming potential of whole gasoline vapor, Science, 276, 96–99, 1997.
Offenberg, J. H., Lewis, C. W., Lewandowski, M., Jaoui, M., Klein-dienst, T. E., and Edney, E. O.: Contributions of toluene and alpha-pinene to SOA formed in an irradiated toluene/alpha-pinene/NOx/air mixture: Comparison of results using C-14 con-tent and SOA organic tracer methods, Environ. Sci. Technol., 41, 3972–3976, 2007.
Pankow, J. F.: Review and comparative-analysis of the theories on partitioning between the gas and aerosol particulate phases in the atmosphere, Atmos. Environ., 21, 2275–2283, 1987.
Pathak, R. K., Presto, A. A., Lane, T. E., Stanier, C. O., Donahue, N. M., and Pandis, S. N.: Ozonolysis of a-pinene: parameterization of secondary organic aerosol mass fraction, Atmos. Chem. Phys., 7, 3811–3821, doi:10.5194/acp-7-3811-2007, 2007a.
Pathak, R. K., Stanier, C. O., Donahue, N. M., and Pandis, S. N.: Ozonolysis of alpha-pinene at atmospherically rele-vant concentrations: Temperature dependence of aerosol mass fractions (yields), J. Geophys. Res.-Atmos., 112, D03201, doi:10.1029/2006jd007436, 2007b.
Paulot, F., Crounse, J. D., Kjaergaard, H. G., Kurten, A., St Clair, J. M., Seinfeld, J. H., and Wennberg, P. O.: Unexpected Epoxide Formation in the Gas-Phase Photooxidation of Isoprene, Science, 325, 730–733, 2009.
Perraud, V., Bruns, E. A., Ezell, M. J., Johnson, S. N., Yu, Y., Alexander, M. L., Zelenyuk, A., Imre, D., Chang, W. L., Dab-dub, D., Pankow, J. F., and Finlayson-Pitts, B. J.: Nonequilibrium atmospheric secondary organic aerosol formation and growth, P. Natl. Acad. Sci. USA, 109, 2836–2841, 2012.
Presto, A. A. and Donahue, N. M.: Investigation of alpha-pinene plus ozone secondary organic aerosol formation at low total aerosol mass, Environ. Sci. Technol., 40, 3536–3543, 2006. Presto, A. A., Hartz, K. E. H., and Donahue, N. M.: Secondary
organic aerosol production from terpene ozonolysis. 2. Effect of NOx concentration, Environ. Sci. Technol., 39, 7046–7054,
2005.
Prisle, N. L., Engelhart, G. J., Bilde, M., and Donahue, N. M.: Humidity influence on gas-particle phase partitioning of alpha-pinene+ O-3 secondary organic aerosol, Geophys. Res. Lett., 37, L01802, doi:10.1029/2009gl041402, 2010.
Pye, H. O. T., Chan, A. W. H., Barkley, M. P., and Seinfeld, J. H.: Global modeling of organic aerosol: the importance of reac-tive nitrogen (NOxand NO3), Atmos. Chem. Phys., 10, 11261–
11276, doi:10.5194/acp-10-11261-2010, 2010.
Qi, L., Nakao, S., Tang, P., and Cocker III, D. R.: Temperature effect on physical and chemical properties of secondary organic aerosol from m-xylene photooxidation, Atmos. Chem. Phys., 10, 3847– 3854, doi:10.5194/acp-10-3847-2010, 2010.
Rollins, A. W., Kiendler-Scharr, A., Fry, J. L., Brauers, T., Brown, S. S., Dorn, H.-P., Dub´e, W. P., Fuchs, H., Mensah, A., Mentel, T. F., Rohrer, F., Tillmann, R., Wegener, R., Wooldridge, P. J., and Cohen, R. C.: Isoprene oxidation by nitrate radical: alkyl nitrate and secondary organic aerosol yields, Atmos. Chem. Phys., 9, 6685–6703, doi:10.5194/acp-9-6685-2009, 2009.
Rudich, Y., Donahue, N. M., and Mentel, T. F.: Aging of organic aerosol: Bridging the gap between laboratory and field studies. Annual Review of Physical Chemistry. Palo Alto, Annual Re-views, 58, 321–352, 2007.
Saathoff, H., Naumann, K.-H., M¨ohler, O., Jonsson, ˚A. M., Hal-lquist, M., Kiendler-Scharr, A., Mentel, Th. F., Tillmann, R., and Schurath, U.: Temperature dependence of yields of secondary or-ganic aerosols from the ozonolysis ofα-pinene and limonene, Atmos. Chem. Phys., 9, 1551–1577, doi:10.5194/acp-9-1551-2009, 2009.
Sarwar, G. and Corsi, R.: The effects of ozone/limonene reactions on indoor secondary organic aerosols, Atmos. Environ., 41, 959– 973, 2007.
Schell, B., Ackermann, I. J., Hass, H., Binkowski, F. S., and Ebel, A.: Modeling the formation of secondary organic aerosol within a comprehensive air quality model system, J. Geophys. Res.-Atmos., 106, 28275–28293, 2001.
Schmidt, M. and Lipson, H.: Distilling Free-Form Natural Laws from Experimental Data, Science, 324, 81–85, 2009.
Sciare, J., d’Argouges, O., Zhang, Q. J., Sarda-Est`eve, R., Gaimoz, C., Gros, V., Beekmann, M., and Sanchez, O.: Comparison be-tween simulated and observed chemical composition of fine aerosols in Paris (France) during springtime: contribution of re-gional versus continental emissions, Atmos. Chem. Phys., 10, 11987–12004, doi:10.5194/acp-10-11987-2010, 2010.
Seinfeld, J. H., Erdakos, G. B., Asher, W. E., and Pankow, J. F.: Modeling the formation of secondary organic aerosol (SOA). 2. The predicted effects of relative humidity on aerosol formation in the alpha-pinene-, beta-pinene-, sabinene-, Delta(3)-Carene-, and cyclohexene-ozone systemsDelta(3)-Carene-, Environ. Sci. Technol.Delta(3)-Carene-, 35Delta(3)-Carene-, 1806–1817, 2001.
Seinfeld, J. H. and Pankow, J. F.: Organic atmospheric particulate material, Annual Rev. Phys. Chem., 54, 121–140, 2003. Stanier, C. O., Donahue, N. M., and Pandis, S. N.: Parameterization
of secondary organic aerosol mass fractions from smog chamber data, Atmos. Environ., 42, 2276–2299, 2008.
Stockwell, W. R., Kirchner, F., Kuhn, M., and Seefeld, S.: A new mechanism for regional atmospheric chemistry modeling, J. Geophys. Res.-Atmos., 102, 25847–25879, 1997.
Stone, D., Whalley, L. K., and Heard, D. E.: Tropospheric OH and HO2 radicals: field measurements and model comparisons, Chem. Soc. Rev., 41, 6348–6404, 2012.
Symeonidis, P., Gkantou, A., Melas, D., Yay, O. D., Pouspourika, E., Balis, D., and Poupkou, A.: Development of a computational system for estimating biogenic NMVOCs emissions based on GIS technology, Atmos. Environ., 42, 1777–1789, 2008. Takekawa, H., Minoura, H., and Yamazaki, S.: Temperature
depen-dence of secondary organic aerosol formation by photo-oxidation of hydrocarbons, Atmos. Environ., 37, 3413–3424, 2003. Tillmann, R., Hallquist, M., Jonsson, ˚A. M., Kiendler-Scharr, A.,
Saathoff, H., Iinuma, Y., and Mentel, Th. F.: Influence of relative humidity and temperature on the production of pinonaldehyde and OH radicals from the ozonolysis ofα-pinene, Atmos. Chem. Phys., 10, 7057–7072, doi:10.5194/acp-10-7057-2010, 2010. Tsimpidi, A. P., Karydis, V. A., Zavala, M., Lei, W., Molina, L.,
Ulbrich, I. M., Jimenez, J. L., and Pandis, S. N.: Evaluation of the volatility basis-set approach for the simulation of organic aerosol formation in the Mexico City metropolitan area, Atmos. Chem. Phys., 10, 525–546, doi:10.5194/acp-10-525-2010, 2010. Ulbrich, I. M., Canagaratna, M. R., Zhang, Q., Worsnop, D. R., and
Jimenez, J. L.: Interpretation of organic components from Posi-tive Matrix Factorization of aerosol mass spectrometric data, At-mos. Chem. Phys., 9, 2891–2918, doi:10.5194/acp-9-2891-2009, 2009.
Vivanco, M. G., Santiago, M., Martinez-Tarifa, A., Borras, E., Ro-denas, M., Garcia-Diego, C., and Sanchez, M.: SOA forma-tion in a photoreactor from a mixture of organic gases and HONO for different experimental conditions, Atmos. Environ., 45, 708**715, 2011.
Yu, F.: A secondary organic aerosol formation model considering successive oxidation aging and kinetic condensation of organic compounds: global scale implications, Atmos. Chem. Phys., 11, 1083–1099, doi:10.5194/acp-11-1083-2011, 2011.
Yu, J. Z., Cocker, D. R., Griffin, R. J., Flagan, R. C., and Seinfeld, J. H.: Gas-phase ozone oxidation of monoterpenes: Gaseous and particulate products, J. Atmos. Chem., 34, 207–258, 1999. Zhang, Q., Jimenez, J. L., Canagaratna, M. R., Allan, J. D., Coe,
H., Ulbrich, I., Alfarra, M. R., Takami, A., Middlebrook, A. M., Sun, Y. L., Dzepina, K., Dunlea, E., Docherty, K., De-Carlo, P. F., Salcedo, D., Onasch, T., Jayne, J. T., Miyoshi, T., Shimono, A., Hatakeyama, S., Takegawa, N., Kondo, Y., Schneider, J., Drewnick, F., Borrmann, S., Weimer, S., Demer-jian, K., Williams, P., Bower, K., Bahreini, R., Cottrell, L., Griffin, R. J., Rautiainen, J., Sun, J. Y., Zhang, Y. M., and Worsnop, D. R.: Ubiquity and dominance of oxygenated species in organic aerosols in anthropogenically-influenced Northern Hemisphere midlatitudes, Geophys. Res. Lett., 34, L13801, doi:10.1029/2007GL029979, 2007.
Zhang, X. and Seinfeld, J. H.: A Functional Group Oxidation Model (FGOM) for SOA formation and aging, Atmos. Chem. Phys. Discuss., 12, 32565–32611, doi:10.5194/acpd-12-32565-2012, 2012.