A FUZZY LOGIC-BASED APPROACH FOR THE DETECTION OF FLOODED
VEGETATION BY MEANS OF SYNTHETIC APERTURE RADAR DATA
V. Tsyganskaya ab, S. Martinisb, A. Tweleb, W. Caob, A. Schmittb, P. Marzahna, R. Ludwiga *
a
Ludwig-Maximilians-Universität München, Department of Geography, Luisenstr. 37, 80333 Munich, Germany - (v.tsyganskaya, p.marzahn, r.ludwig)@iggf.geo.uni-muenchen.de
b
German Remote Sensing Data Center (DFD), German Aerospace Center (DLR), Oberpfaffenhofen, 82234 Wessling, Germany - (sandro.martinis, andre.twele, wenxi.cao, andreas.schmitt)@dlr.de
Commission VII, WG VII/4
KEY WORDS: Fuzzy logic; Flooded vegetation; Synthetic Aperture Radar (SAR); Data fusion; TerraSAR-X
ABSTRACT:
In this paper an algorithm designed to map flooded vegetation from synthetic aperture radar (SAR) imagery is introduced. The approach is based on fuzzy logic which enables to deal with the ambiguity of SAR data and to integrate multiple ancillary data containing topographical information, simple hydraulic considerations and land cover information. This allows the exclusion of image elements with a backscatter value similar to flooded vegetation, to significantly reduce misclassification errors. The flooded vegetation mapping procedure is tested on a flood event that occurred in Germany over parts of the Saale catchment on January 2011 using a time series of high resolution TerraSAR-X data covering the time interval from 2009 to 2015. The results show that the analysis of multi-temporal X-band data combined with ancillary data using a fuzzy logic-based approach permits the detection of flooded vegetation areas.
* Corresponding author
E-mail address: [email protected]
(V. Tsyganskaya)
1. INTRODUCTION
Flood is one of the most widespread and frequently occurring natural disasters causing high social and economic impacts worldwide. Therefore, as much information as possible on the characteristics of inundation event needs to be instantaneously accessible for crisis support management and humanitarian relief activities. Also for strategic planning of inundation mitigation and possible prevention of damage, a stable fundament for decision making is required.
Synthetic Aperture Radar (SAR) is an effective, well established tool for monitoring and mapping inundations from space. Contrary to optical sensors, SAR technology is capable of supplying large-scale flood crisis information, regardless of daylight or weather conditions. Furthermore, the revisit time has been shortened by satellite constellations, such as COSMO-SkyMed, allowing high temporal coverage up to 1 day and therefore frequently delivers SAR data for operational use. The characteristics of microwaves permit a differentiation between water and non-water areas. Smooth, open water surface acts as a specular reflector, which reflects the radar energy away from the sensor, generally producing dark pixels with low backscatter values in comparison to non-water areas mostly having high backscatter values (Martinis et al. 2009). Besides open water surfaces, also the flooding underneath vegetation canopy can be derived. This is possible due to the capability of microwaves to penetrate the vegetation canopy, producing multiple bounce or double bounce effects caused by the signal interaction between the flat water surface and lower parts of the vegetation (e.g., branches and trunks) (Townsend 2001; Schlaffer et al. 2015). In comparison to normal water level conditions, this leads to an increased backscatter values. The aforementioned advantages of SAR sensors in the detection of inundation areas have lead to an
intensive effort to develop suitable algorithms for flood derivation from SAR imagery during the last decade.
Few investigations considering the mapping of water bodies underneath vegetation by means of SAR data can be found in the literature. Most of this methods aim to detect flooded vegetation based on thresholds empirically derived and applied to SAR data. However, to reduce the subjectiveness in this kind of process an automatic determination of a suitable threshold value was attempted (Martinis & Twele 2010; Pulvirenti et al. 2011; Schlaffer et al 2015).
It is common to use only single temporal images to derive the threshold between flooded and non-flooded vegetation. However, these approaches have deficiencies, because they do not incorporate changes over time. To detect these changes, two or more SAR images have to be taken into account. Pre-event data have to be acquired during dry conditions, representing the same area as the scene acquired during the inundation event. The change image is created by subtracting the pixel backscatter values in the flood image from the pixel backscatter values in a reference scene (Schumann et al. 2009) when amplitude information is used. Change detection methods were often used to derive flooded areas (Giustarini et al. 2013; Martinis et al. 2009; Nico et al. 2000). An increase in backscatter values, which can appear very bright in a SAR image in comparison to the surrounding area, may represent the key component for the detection of flooded vegetated and forested areas (Horritt et al. 2010). This increase might be caused by the double bounce effect, a phenomena, which can occur when the water underneath vegetation acts as specular reflector. The backscatter representation of flooded vegetation in a SAR image can vary, because the aforementioned interactions can be complex. These changes depend on a number of different parameters, like the density of the vegetation canopy in relation to the penetrability
of different wavelength (e.g. L-band, C-band, or X-Band). The height of the plant, the orientation of the leafs and the level of floodwater are other relevant parameters (Pulvirenti et al. 2011). These variables can strongly influence the backscatter values and may superimpose the double bounce effect through another scattering mechanism. Nevertheless, many studies have shown that SAR data is suitable for the classification of flooded vegetation independent of the wavelength. The potential of L-Band is mentioned by Richards et al. (1987). For the C-band data various studies (Hess 2003; Townsend 2001) presented a successful identification of flooded vegetation. Few investigations have shown a potential for the extraction of flooded vegetation using X-band data (Martinis, & Rieke 2015; Voormansik et al. 2014).
In comparison to flooded open water areas, there is low research on the semi-automatic detection of water bodies underneath vegetation. However, the disregard of flooded vegetation frequently leads to an underestimation of the extent of an inundation. The choice of the threshold values based on SAR data is also critical, because of their dependence on system parameters, (frequency band, polarization and observation angle), as well as on environmental parameters of the examined area, (canopy type, vegetation structure and density seasonality and vitality of the vegetation, and topographical information) (Pulvirenti et al. 2011). To deal with this ambiguity of the radars signature for flooded areas beneath vegetation a semi-automatic approach using a fuzzy logic classification algorithm is developed. Fuzzy logic is already successfully used in other studies focusing on the detection of inundation based on SAR data (Pierdicca et al. 2008; Pulvirenti et al. 2011; Martinis 2015 Twele et al (accepted)). The application of a fuzzy logic-based approach allows the combination of SAR backscatter information with ancillary information, such as land cover,
topographic considerations and contextual information. This results in an improvement of the reliability of the detection of flooded vegetation.
The potential multi-temporal single-pol X-Band data for derivation of flooded vegetation was already demonstrated by Martinis, & Rieke (2015) and Voormansik et al. (2014). In this study, a semi-automatic method for derivation of flooded vegetation using multi-temporal single polarized TerraSAR-X data is presented. The approach is based on fuzzy logic which enables to deal with the ambiguity of SAR data and to integrate ancillary data containing topographical information, simple hydraulic considerations and land cover information. In this paper the suitability of the designed algorithm for the derivation of flooded vegetation is analyzed.
2. DATA SET 2.1 SAR Data
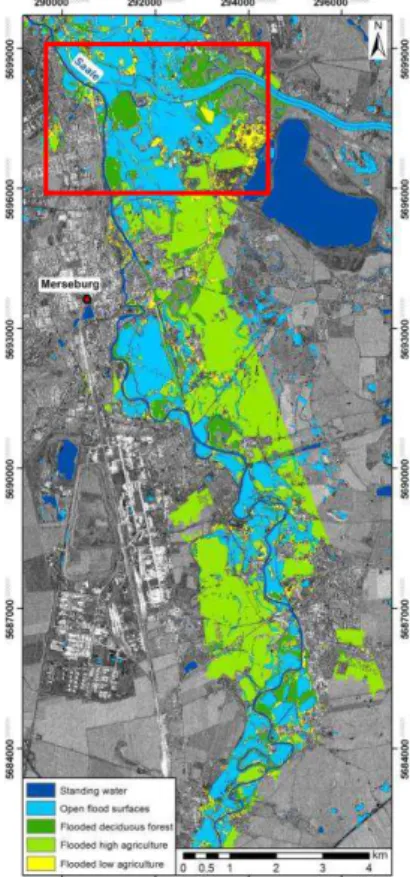
The SAR data applied in this study relates to a flood event at the river Saale between January 9 and 29, 2011, located near the city Halle (Saxony-Anhalt, Germany). Overall, 46 TerraSAR-X scenes were acquired between December 17, 2009 and July 3, 2015, containing a scene of the inundation event taken on January 17, 2011. The available time series provides basic information about the seasonal behavior for the vegetation areas. Fig. 1 shows the study area in two TerraSAR-X images (January 17, 2011) during the flood event and a pre-event image (November 01, 2010) under non-flooded conditions. The visual inspection of Fig. 1 (left and center panel) allows the clear detection of the black areas with small backscatter values in both images, which indicate open water areas. The inundation areas can also be identified as dark regions, however appearing Figure 1:TerraSAR-X image of the study area acquired under non-flood conditions (26 December 2011, © DLR 2014) (left)
and as comparison TerraSAR-X image acquired during the flood event (17 January 2011, © DLR 2014) (center). The changes in the inundation image can be clearly seen. Selected auxiliary information and derived validation areas for flooded
vegetation are shown in the right panel.
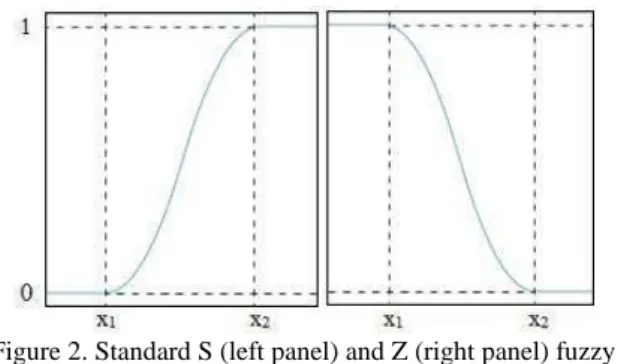
Figure 2. Standard S (left panel) and Z (right panel) fuzzy membership functions. For the S-function, the values smaller
than x1 have the membership degree equal to 0, while the values higher than x2 have the membership degree equal to 1.
For the Z-function, the opposite is the case.
only in the image under flooded conditions (center panel). In addition to the permanent water bodies, the image under flooded conditions (center panel) comprises also flooded areas during the inundation event. The flooded vegetation areas (see Fig. 1, center panel) can be assumed along river banks and inside water bodies due to the brighter backscatter than surrounding areas. However they cannot unambiguously be identified.
The TerraSAR-X data was ordered as an EEC (Enhanced Ellipsoid Corrected) product. It should be noted that the data is horizontally polarized (HH), which is the best polarization to distinguish flooded areas (Pulvirenti et al. 2011). In the pre-processing step TerraSAR-X intensity data has been radiometric calibrated and speckle removal was performed. The calibration is conducted by the calculation of the backscattering coefficient (sigma naught) σ0 for each pixel derived from digital numbers (DNs), taking into account the local incident angle influence. For noise removal and speckle reduction an adaptive filter (median filter of kernel size 3 x 3) for single-channel detected radar images is applied, which is successfully used for speckle reduction of TerraSAR-X images for flood detection purposes (Martinis et al. 2015).
2.2 Auxiliary data
For the exclusion of pixels, which are definitely not representing vegetation area, several auxiliary data sets are used. A land cover map (Digital Landscape Models 1:25.000) was provided by the Federal Agency for Cartography and Geodesy (2016) containing layers with permanent water bodies, urban areas and vegetation classes. The update for the land cover map is performed during the five-year utilization period, whereby the state for data-topicality is two years in relation to the download time on January 2015. Flooded open water areas were provided by a fully automated TerraSAR-X based flood service for reliable delimitation to other land cover areas (Martinis et al. 2013). This service can be activated for emergency response in case of a flood event (Martinis et al. 2015) and is based on an unsupervised thresholding approach using TerraSAR-X data, suitable for rapid mapping of inundated areas (Martinis et al. 2009). The described method is valid only for open water surfaces, which behave in the same way as a specular reflector and reflect almost all radiation away from the sensor. Fig. 1 (right panel) shows the resulting product of this algorithm containing the inundation extent for open water areas derived from TerraSAR-X image acquired during the flood event on January 17, 2011.
In addition to the used SAR data, simple hydraulic considerations were taken into account by integrating HAND (Height Above Nearest Drainage) and slope layer in the
classification process. The HAND model represents the normalized topography according to the local relative heights located along the drainage network and is calculated almost for the whole globe. Furthermore, HAND index has 30 m resolution and is based on SRTM-DEM and drainage direction information.Each pixel in the HAND layer is defined as height difference between a DEM cell and the nearest cell the drainage channel (Nobre et al. 2011). Besides flooded open water areas TerraSAR-X Flood Service (TFS) delivers the slope information considered in this study. The local steepness of terrain was derived from DEM (ASTER Global Digital Elevation Model) (METI and NASA 2011) to refine the flooded vegetation mask.
2.3 Reference data
For validation purposes several different data sources were manually combined. In general, ground truth data or other types of remote sensing data, such as optical images (Schlaffer et al. 2015) or GPS (Hess 2003), are used to validate the classification results. In case of flooded vegetation this data is considerably limited. On the one hand, there is no flooded vegetation ground truth data for the study area available. On the other hand, the derivation of the reference data from optical data for flooded vegetation is restricted. In this case flooded vegetation can be just assumed by visual interpretation in comparison to SAR data. Thereby, the validation data for this investigation has derived from several sources, which include (1) digitalized open water areas (ground truth data for inundated zones), (2) DEM with the spatial resolution of 1 m, (3) aforementioned digital ortho photos (CIR images) provided by the State Agency for flood protection and water management, Saxony-Anhalt and (4) vegetation areas provided by land cover map. A visual aggregation as/into overlap layer and a manual interpretation of this data enables the generation of the validation layer for flooded vegetation areas. The complete validation mask is shown in Fig. 1 (right panel).
3. METHODOLOGY
In the first part of this section, the fuzzy logic approach for the derivation of flooded vegetation considering SAR data and ancillary information is presented. In the following sections the entire algorithm process chain is described and depicted using a schematic diagram. Furthermore, there is a detailed explanation of the fuzzy sets construction based on radar backscatter information and auxiliary data. Finally, the application of an exclusion approach taking into account further additional information, such as land cover map, is declared.
3.1 The fuzzy approach
Over the past few years fuzzy logic has been applied to enhance flood mapping algorithms. Pierdicca et al. (2008) were the first to use the fuzzy logic theory for the detection of open water inundation zones, urban and flooded vegetated areas based on pixel intensity of SAR data and standard membership functions. For the quantification of uncertainty in the labeling of each element in flood probability masks the fuzzy logic approach was applied by Martinis and Twele (2010). Furthermore, an object-based fuzzy logic method for derivation of inundation areas was demonstrated in Pulvirenti et al. (2011) and Pulvirenti et al. (2013), where a theoretical electromagnetic scattering model was used to tune the algorithm. Beside open water areas water bodies beneath vegetation and auxiliary data, such as topographic information, simple hydrological considerations
were also considered in the study by the implementation of fuzzy logic theory. Martinis et al. 2015 described the integration of SAR backscatter information and different globally available auxiliary data by fuzzy logic-based algorithm used for post-classification refinement.
Due to aforementioned successfully performed investigations by applying the fuzzy logic-based approach for flood detection the fuzzy logic is a promising method for the extraction of flooded vegetation. Especially in the case of using SAR data fuzzy logic is a potential tool to derive flood beneath the vegetation, which enables to handle the ambiguities of the radar measurements. Furthermore, the method allows an integration and combination of different source of data, taking into account their uncertainties. In order to obtain reliable results for flooded vegetation a fuzzy set was built up including five elements:
absolute backscatter (σ0), change detection backscatter (Δσ0),
height value represented by Height Above Nearest Drainage Index (h), slope information (s) and the distance to water bodies (w). To integrate the aforementioned information standard S and Z membership functions were applied (Pal, Rosenfeld 1988) as shown in Fig. 2, where the parameter x1 and x2 define minimum and maximum fuzzy thresholds.
3.2 Algorithm description
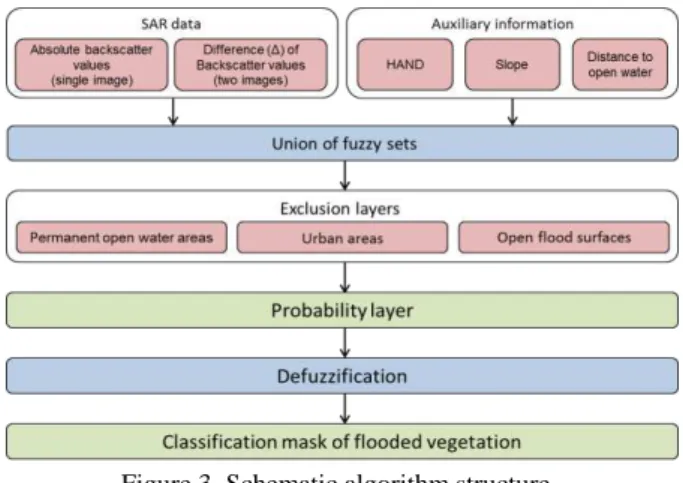
The structure and the single elements of the designed algorithm are shown in Fig. 3. The input data is depicted as red boxes. The operations automatically performed by the algorithm are presented by blue elements, while the output layers containing the results are represented by green elements in the diagram. As input the algorithm requires SAR data, HAND, slope and land cover information. Depending on the data basis it is possible to omit the auxiliary information, whereas without SAR information the application of the algorithm is not possible. If only one SAR image, acquired during the flood event, is available the fuzzy set parameter cannot be automatically derived. For this purpose training data have to be created. For this study more than one SAR observation was applied containing images acquired during the flood conditions (image-1) and under non-flood conditions (image-2) (see Sect. 3.3). The last one was produced merging several images (non-flooded condition) to a layer stack containing seasonal information of vegetation. It must be considered that, the data used as input in this study (SAR, HAND, Slope, land cover map, optical data) has to be in the same cartographic coordinate system with the same pixel spacing and identical dimensions (e.g. the same number of columns and rows). The output of the algorithm is a flooded vegetation mask represented by a raster image having the same aforementioned attributes as the input data.
After importing the data the exclusion layers are applied (see Fig. 3). The exclusion layers contain land cover information, such as permanent open water areas and urban regions (see Sect. 3.5). Furthermore, the open flood surfaces mask allows eliminating pixels having the same or similar radar reflection characteristics as flooded vegetation, therefore avoiding a false classification. The next step of the algorithm is to combine the fuzzy sets into one set, called here probability layer (see Fig. 3). The fuzzy sets are unified by calculating the average of the membership degree for each pixel. If a single fuzzy pixel has a membership degree of zero, the membership degree in the unified fuzzy set is also set to zero. In this way the elements of fuzzy sets possessing the probability of zero are also excluded. In order to obtain a classification mask with flooded and non-flooded vegetation areas, each pixel from the probability layer is transferred by a defuzzification step. Pixels having a
membership degree larger than a defined threshold value are assigned to the flooded vegetation class. All pixels with a membership degree smaller than the threshold value are added to the non-flooded vegetation class. The defuzzification process converts membership degrees into a crisp number (Cox 1994). To find an appropriate threshold value for the defuzzification step the histogram of the probability has to be analyzed. However, there is a challenging task, because of the irregular distribution of the histogram values and the absence of any pattern in it. For the understanding of the dynamics of previous steps of fuzzy sets, in this study a fixed threshold value of 0.5 is applied to avoid ambiguities by the defuzzification threshold. Consequently, the defuzzification step allows transforming each pixel with a membership degree into a discrete number enabling the production of flooded vegetation mask (see Fig. 3).
3.3 The backscatter values based fuzzy sets
Usually the choice of the threshold values of a fuzzy set (x1 and x2) based on SAR data for flooded vegetation is a critical aspect, because these thresholds depend on system parameters (frequency band, polarization and observation angle), as well as on environmental parameters of the study area (season/vitality of vegetation and topography) (Pulvirenti et al. 2011). To find suitable threshold values, the first attempt was performed by using a single image, which only considers the absolute backscatter values. The backscatter values are provided using TerraSAR-X data under the flood conditions on January 17, 2011. The implementation of the absolute backscatter values is performed by the standard S function. The low degree of membership (parameter x1) is represented by the real number 0 (no membership) and assigned by the backscatter mean value extracted from reference data. This enables to avoid an overestimation of flooded vegetation areas. The maximum membership degree with the real number 1 (parameter x2) is defined by the double standard deviation, including 95.5 % of backscatter values for the same reference data. Note that the use of a single image enables considering only elements having high backscatter values according to the following assumption: The higher the backscatter value the higher the probability to get classified as flooded vegetation. Due to the large overlap between histogram values of vegetation and flooded vegetation, within single image, the separation of these two areas by mean of automatic approach is a difficult task.
In order to adopt an automatic approach change detection method is applied, where the changes between two images can be analyzed. In this process a difference between image acquired during a flood event and image acquired under non-flooded conditions (a pre-event scene or a post-event scene) is
Figure 3.Schematic algorithm structure and its single elements
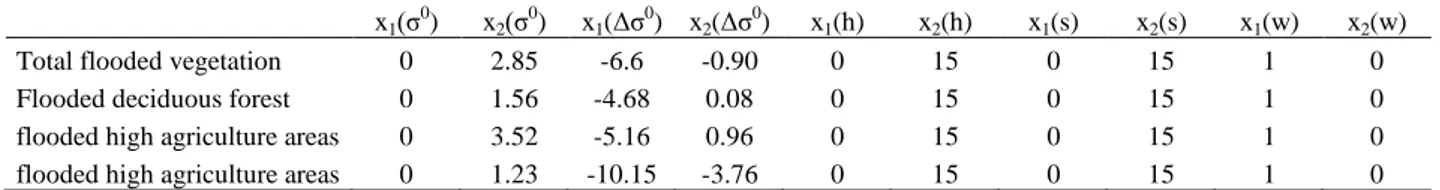
x1(σ0) x2(σ0) x1(Δσ0) x2(Δσ0) x1(h) x2(h) x1(s) x2(s) x1(w) x2(w)
Total flooded vegetation 0 2.85 -6.6 -0.90 0 15 0 15 1 0
Flooded deciduous forest 0 1.56 -4.68 0.08 0 15 0 15 1 0
flooded high agriculture areas 0 3.52 -5.16 0.96 0 15 0 15 1 0
flooded high agriculture areas 0 1.23 -10.15 -3.76 0 15 0 15 1 0
Table 1.Threshold values of fuzzy logic based algorithm
performed. The aforementioned inclusion of scenes allows automatically calculation of the fuzzy thresholds by the lowest and highest difference of backscatter values. For further investigations 45 non-flooded condition TerraSAR-X scenes were merged into a layer stack, which represents a new non-flood image. This step allows considering also the seasonal component, because of the availability of TerraSAR images more than for one time of year (Schlaffer et al. 2015).
The basis of the second fuzzy set is formed by backscatter values, which implies the change detection image. For this purpose the standard S function is applied, where the parameter x1 is assigned by no changes in the change detection image. The parameter x2 is represented by the highest difference of the change detection scene, where max (backscatter value (flood) - backscatter values (non-flood)). This difference considers the increase of backscatter values potentially caused by double bounce effect considering flooded forested areas and vegetated agriculture regions. To avoid false classification for flooded vegetation areas, objects producing similar increase of backscatter values, such as urban areas are excluded in a later step (see Section 3.5).
3.4 The fuzzy sets based on ancillary data
The fuzzy approach does not only enable to deal with the ambiguity of the radar signature, however also allows to implement an additional source of data and thereby to improve the reliability of the results. The idea is based on assumption that in case of river overflows, the flood probability for a pixel is large if it close to the river, if the slope is low and if the certain altitude of the area is not exceeded. In each of these cases the pixels have a large degree of membership to the set of flooded vegetation areas. Thereby, false alarms in regions far away from open water bodies and in hilly or mountainous terrain are avoided. For the integration of this information the following fuzzy sets are build up: digital elevation represented by Height Above Nearest Drainage Index (h), slope information (s) and the distance to water bodies (w). As a third element in a fuzzy system the Height Above Nearest Drainage Index (HAND) layer is integrated by using the Z membership function. Integration of HAND helps to reduce flooded vegetation look-alikes, caused by similar backscatter values that are lying too high above the nearest drainage to be flooded. In order to include appropriate threshold values for the HAND fuzzy set the study of Twele et al. (submitted) was used, where the derivation of thresholds was carried through a series of empirical tests of different hydrological and topographical settings based on over 400 TerraSAR-X and Sentinel-1 scenes.
For the definition of non-flooded prone areas the threshold of >= 15 m was chosen. The critical aspect about the derivation of those thresholds was the possibility to select them too high and may cause an overestimation of flooded vegetation area. In case of selecting a too low threshold an underestimation of the flood surface could occur (Twele et al. 2016). To build up the fuzzy set for HAND the following parameters are integrated: x1 = 0 m, x2 = 15 m. Therefore, zero values represent a high probability for flooded vegetation, whereas high values stand for low probability. Each value above the upper fuzzy threshold is excluded from the fuzzy system, because of the assumption that no flooded vegetation exist above this border. As applied in Martinis et al. (2015) topographic slope information derived from globally available digital elevation data is integrated as a third element in the fuzzy system by using the Z membership function. To eliminate look-alikes in steep area the parameters x1 and x2 are used as 0° and = 15°. The first one represents high probability to get classified as flooded vegetation, because of absence of slope. The opposite occurs: The steeper the terrain the lower is the possibility of flooded vegetation. All pixels lying above the second parameter are excluded.
For the calculation of the distance to open water areas a morphological operator, based on the distance calculation in pixel, is used. The implementation of distance in a fuzzy set is performed by standard Z membership function. In this case, the lower the number of pixels, the smaller the distance to open water areas, and the higher is the probability for a pixel to get classified as flooded vegetation.
3.5 Exclusion approach
Prior analysis has shown that several existing objects can cause same or similar backscatter values like flooded vegetation according to the double bounce effect (Kandus et al. 2014). Due to the multiple reflections an increase in backscatter values is a consequence, which let appear the objects also brighter than the surrounding terrain in radar imagery. Such an effect can occur in urban areas, where vertical objects and streets build corner reflectors, as well as ploughed rows in agriculture areas. Both produce a maximum reflection when rows or streets are vertically orientated to the radar look direction. Also, roughened water surface caused by wind activities, anthropogenic objects on the water, such as ships or oil and gas development platforms can cause high backscatter values like flooded vegetation. Soil high moisture conditions are further feature that may cause an overestimation of flooded vegetation (Martinis et al. 2015). In particularly the latter case represents a significant challenge for delimitation of flooded vegetation in
Accuracy entities total vegetation deciduous forest low agriculture high agriculture
PA Flooded 66.4 % 73.9 % 39.5 % 63.8 %
UA Flooded 19.4 % 60.0 % 26.4 % 7.6 %
PA Remaining 77.5 % 98.1 % 97.8 % 83.2 %
UA Remaining 96.6 % 99.0 % 98.8 % 99.1 %
OA 76.7 % 97.1 % 96.6 % 82.8 %
Table 2. Accuracy assessment results for flooded vegetation classes for a scene acquired on January 17, 2011during the flood event at river 'Saale' in Germany (OA = Overall Accuracy, PA = Producer Accuracy, UA = User Accuracy)
case of single-polarized radar data. To differentiate between flooded vegetation and aforementioned objects having similar backscatter values like flooded vegetation additional information is used. For the exclusion of the aforementioned influencing factors a land cover map (Digital Basic Landscape Model) are used to take into account information about permanent water bodies (rivers, lakes, reservoirs, etc.) and urban areas. In addition a classification layer of inundated water zones, a product of TerraSAR-X Flood Service (TFS) (Martinis et al. 2015) was used for the exclusion of pixels with low backscatter values (open water zones). Thereby, the influencing factors, such as roughened water surfaces caused by wind or human-made objects on water are excluded, because those are usually located inside the water body areas. Objects from the urban areas are also considered by the land cover map. The described layers are integrated in the algorithm process chain for elimination of pixels having the similar backscatter value as flooded vegetation. Therefore, the exclusion of these elements is indispensable.
4. RESULTS AND DISCUSSION
In this section, the results produced by the application of the developed algorithm and its effectiveness are described and visualized for the introduced study area. The algorithm is based on fuzzy logic combining SAR backscatter values with auxiliary data (see Section 3.1). The results for flooded vegetation classification are illustrated in the Fig. 4. The left panel shows flooded vegetation divided in three classes (flooded deciduous forest, flooded high agriculture, flooded high agriculture). Each class was derived by applying land cover information. The fourth class describes the total flooded vegetation. Note that the state for data-topicality is two years in relation to the download time in January 2015. In comparison to the acquisition time of the SAR scene at flooded event on January 17, 2011 the applied features may differ and affect the accuracy of the results. Fig. 5 shows a detailed depiction of the total vegetation classification with overestimated and underestimated areas.
The threshold values (parameter x1 and x2) used to build four fuzzy sets for the designed algorithm and considering absolute
SAR backscatter (σ0) change detected SAR backscatter (Δσ0
), HAND (h) slope (s) as well as distance to water bodies (w) are listed in Table 1. In addition to the total flooded vegetation the SAR backscatter threshold values for the three aforementioned flooded vegetation classes were derived by using the change detection approach (see Section 3.3). The efficiency of the results was assessed using a manually derived validation mask (see Section 2.3) containing total flooded vegetation (see Fig. 1, right panel) and three more vegetation classes (Flooded deciduous forest, flooded high agriculture, flooded high agriculture). Table 2 shows the classification accuracy (Overall Accuracy = OA, Producer Accuracy = PA, User Accuracy = UA) for each class in the current study area (catchment area 'Saale' in Germany). The UA indicates the probability that a pixel classified by the model as flooded matches a class in reality (validation data), while PA relates to the probability that validation data is correctly mapped. The OA value for total flooded vegetation is 76.7 %, whereby in each class the OA is located between 82.8 % and 97.1 %. For each class the fuzzy sets threshold values are individually derived. These results in an enhancement of the OA per class in comparison to the total vegetations OA (see Table 2). The flooded deciduous forest and flooded low agriculture classes results show a similar significant high OA of 97.1 % and 96.6 %. In comparison to that the OA of flooded agriculture is 82.8 %. This reduction is attributable to a low UA value (7.9 %) of flooded high agriculture. The reason
for this value being low is explained hereafter. The general assumption to derive flooded vegetation is that it can be classified by an increase in the backscatter values of radar signal caused by the double bounce effect. In case of agriculture areas, especially corn or other high crop types, the phenological changes (plant height, orientation or dense of the leaves, etc.) can influence the double bounce effect (Hess 2003; Pierdicca et al. 2008). In case of low plant height and high water level a reduced double bounce effect can occur, entailing lower backscatter values (Pulvirenti et al. 2011). This is one of the critical parts for the classifications of flooded vegetation, where underestimation can occur. It is also worth mentioning the low UA value of 26.4 % for the flooded low agriculture class. In this case the same effect as explained before may occur and cause low backscatter values, not detectable by the designed algorithm. In contrast to that, flooded deciduous forest UA achieves 73.9 %. This can be explained by the more constant structure of the tree (e.g., trunk or branches) and leaf-off conditions of deciduous forest (winter period) in the acquired scene during the flood event. Thereby, the penetration of the vegetation canopy by radar signal and its interaction between flat water surface and the lower parts of trees causes double bounce effects and increased backscatter to the SAR sensor. This effect intensively occurs in forest areas and consequently enables enhanced extraction of flooded vegetation in comparison to agricultural regions.
The results of the designed algorithm show potential for the extraction of flooded vegetation. However, some shortcomings could be identified. In the following the ideas for improvements are discussed. The accuracy values (see Table 2) indicate some errors in the extraction of flooded vegetation. Especially the deviation of the UA in the agricultural class results in an
Figure 4. Results of flooded vegetation classification (three classes) produced by designed algorithm based on fuzzy logic
approach for the Saale inundation event (17 January 2011). The red box represents an extent with detailed illustration the
flooded vegetation (see Figure 5).
overestimation of flooded vegetation areas. This can be caused by bare soil, either in case of ploughed rows in agricultural areas or in case of high soil moisture content, both producing bright backscatter values (Kandus et al. 2014; Pulvirenti et al. 2011). To avoid falsely classified pixels for flooded agricultural areas, bare soil should be excluded. For the separation between bare soil and vegetation optical data can be used. Therefore the presence of vegetation is derivable by the calculation of the Normalized Difference Vegetation Index (NDVI) (Chuvieco & Huete 2010). This product could be used as mask for the extraction of bare soil and be applied as an exclusion layer. A further challenge in the algorithm is the combination the fuzzy sets. Currently, the fuzzy sets are unified by calculating the average of the membership degree for each pixel. This can lead to overestimation of flooded vegetation, when the pixels membership degree derived from the SAR data has a low value and simultaneously the degree calculated using topographical information (HAND or slope) has a high value for the same pixel. For mountainous or hilly regions the described combination could lead to suitable results. Consequently, this condition has to be taken into account by applying stronger weighting factor to the backscatter values from SAR data containing the information about the presence of vegetation. To accomplish this, an appropriate combination of used fuzzy sets has to be found. The idea is to unite the backscatter layer and the topographic information in dependence of their fuzzy probability values. If the membership degree of backscatter values is greater than the membership degree of the topography, only the membership degree of the backscatter values is taken into account. Otherwise, the average of the membership degrees for both layers is calculated. This more flexible approach considers the topographical characteristics within the current area of interest and at the same time the information about the vegetation is stronger weighted. Further refinement of the designed algorithm can be achieved by the integration of further conditions considering the heights of open flooded water areas and flooded vegetation areas. For this process the following information is needed: (i) digital elevation model (ii) inundated open water area, provided by TerraSAR-X Flood Service (iii) flooded vegetation areas, extracted from the designed algorithms. First, the three layers have to be combined. Thereafter, a condition comparing the heights between the open inundated pixels and flooded vegetations pixel can be established. If the height of the examined flooded vegetation pixel is lower or equal to the height of the nearest flooded open water pixel, the flooded vegetation is confirmed. Otherwise the pixel classified as flooded vegetation is assigned to the non-flooded vegetation class. The integration of this refinement step
could result in an improvement in the classification of flooded vegetation.
5. CONCLUSION AND OUTLOOK
In this study the feasibility for the derivation of flooded vegetation by means of high resolution, SAR amplitude data, acquired between December 17, 2009 and July 3, 2015, located
at catchment area of the river ‘Saale’ (Germany) provided by
TerraSAR-X and ancillary data, being topographic information, simple hydraulic considerations, flooded open water areas, land cover map is demonstrated. The combination of this available data is enabled by a fuzzy logic-based approach. Furthermore this method allows dealing with SAR data ambiguity.
The use of change detection in this algorithm enables an automatic extraction of flooded vegetation from SAR data distinguishing between different backscatter values during the flood event, in comparison to non flooded conditions. In the latter a merge of multiple images acquired also under non flooded condition accounts for seasonal changes. The inclusion of priory information allows an integration of properties characteristic for the examined area, such as topographical information for accurate extraction of flooded vegetation. Exclusion masks were applied to eliminate pixels having similar backscatter values as flooded vegetation. Thereby avoiding falsely classified pixels in areas without vegetation, such as permanent water regions, flooded open water zones and urban areas.
The approach provides promising results with overall accuracies for total vegetation, flooded deciduous forest, flooded low agriculture and high agriculture classes of 76.7%, 97.1%, 96.6% and 82.8% for the investigated area confirm the effectiveness of the proposed algorithm. Nevertheless, there are still shortcomings especially concerning agricultural areas regarding its seasonal changes and phenological stages requiring further analysis for an enhanced extraction of flooded vegetation. At the present status single-polarized X-band SAR data containing the amplitude information is used to derive flooded vegetation. Future work will focus on the the Sentinel-1 satellite mission, operated by the European Space Agency (ESA) in the frame of the European Union Copernicus Programme, which operates in C-Band and enables high temporal and spatial resolution. It is expected, that the higher penetration of vegetation canopy by C-Band enhances the double bounce effect due to the increase of radiation interacting between the water surface and the lower part of the vegetation layer. Consequently, water underneath vegetation could be detected more accurately. Sentinel-1 provides dual-polarized data (VV, VH) allowing the application of polarimetry (White et al. 2015) and temporal coherence (Nico et al. 2000, Pulvirenti et al. 2016). These methods are going to be used for the extraction of flooded vegetation based on the designed algorithm. Furthermore the combination of these methods and the methods presented in this paper, using the amplitude of the single polarized data, is going to be analyzed. Also the algorithm will be extended for the usage of different derivation approaches depending on the available data (single image analysis, change detection analysis, time series analysis). Consequently different data basis can be flexibly addressed, in order to provide reliable classification results.
ACKNOWLEDGEMENTS
We thank Dr. Thilo Weichel from State Agency for Flood Defence and Water Management of Saxony-Anhalt for the provision of the reference data.
Figure 5. A detailed depiction of total vegetation classification with overestimated and underestimated areas
REFERENCES
Chuvieco, E., Huete, A. 2010. Fundamentals of satellite remote sensing. Boca Raton: CRC Press.
Cox, E. 1994. The fuzzy systems handbook. A practitioner's guide to building, using, and maintaining fuzzy systems. Boston: AP Professional.
Federal Agency for Cartography and Geodesy 2016. Digital Landscape Models. Available online at http://www.bkg.bund.de/nn_159870/EN/FederalOffice/Products
/Geo-Data/Digital-Landscape-Models/DLM__node.html__nnn=true.
Giustarini, L., Hostache, R., Matgen, P., Schumann, G. J.-P., Bates, P. D.,Mason, D. C. 2013. A Change Detection Approach to Flood Mapping in Urban Areas Using TerraSAR-X. In IEEE
Trans. Geosci. Remote Sensing 51 (4), pp. 2417–2430.
Hess, L. 2003. Dual-season mapping of wetland inundation and vegetation for the central Amazon basin. In Remote Sensing of
Environment 87 (4), pp. 404–428.
Horritt, M. S., Mason, D. C., Luckman, A. J. 2010. Flood boundary delineation from Synthetic Aperture Radar imagery using a statistical active contour model. In International
Journal of Remote Sensing 22 (13), pp. 2489–2507.
Kandus, P., Karszenbaum, H., Pultz, T., Parmuchi, G.,Bava, J. 2014. Influence of Flood Conditions and Vegetation Status on the Radar Backscatter of Wetland Ecosystems. In Canadian
Journal of Remote Sensing 27 (6), pp. 651–662.
Martinis, S., Kersten, J.,Twele, A. 2015. A fully automated TerraSAR-X based flood service. In ISPRS Journal of
Photogrammetry and Remote Sensing 104, pp. 203–212.
Martinis, S., Rieke, C. 2015. Backscatter Analysis Using Multi-Temporal and Multi-Frequency SAR Data in the Context of Flood Mapping at River Saale, Germany. In Remote Sensing 7 (6), pp. 7732–7752.
Martinis, S., Twele, A. 2010. A Hierarchical Spatio-Temporal Markov Model for Improved Flood Mapping Using Multi-Temporal X-Band SAR Data. In Remote Sensing 2 (9), pp. 2240–2258.
Martinis, S., Twele, A., Strobl, C., Kersten, J.,Stein, E. 2013. A Multi-Scale Flood Monitoring System Based on Fully Automatic MODIS and TerraSAR-X Processing Chains. In
Remote Sensing 5 (11), pp. 5598–5619.
Martinis, S., Twele, A.,Voigt, S. 2009. Towards operational near real-time flood detection using a split-based automatic thresholding procedure on high resolution TerraSAR-X data. In
Nat. Hazards Earth Syst. Sci. 9 (2), pp. 303–314.
METI and NASA 2011. Aster GDEM V2. Available online at https://asterweb.jpl.nasa.gov/gdem.asp, accessed 3/29/2016.
Nico, G., Pappalepore, M., Pasquariello, G., Refice, A., Samarelli, S. 2000. Comparison of SAR amplitude vs. coherence flood detection methods - a GIS application. In
International Journal of Remote Sensing 21 (8), pp. 1619–
1631. Available online at
http://dx.doi.org/10.1080/014311600209931.
Nobre, A. D., Cuartas, L. A., Hodnett, M., Rennó, C. D., Rodrigues, G., Silveira, A. et al. 2011. Height Above the Nearest Drainage – a hydrologically relevant new terrain model. In Journal of Hydrology 404 (1-2), pp. 13–29.
Pal, S. K.,Rosenfeld, A. 1988. Image enhancement and thresholding by optimization of fuzzy compactness. In Pattern
Recognition Letters 7, pp. 77–86.
Pierdicca, N., Chini, M., Pulvirenti, L.,Macina, F. 2008. Integrating Physical and Topographic Information Into a Fuzzy Scheme to Map Flooded Area by SAR. In Sensors 8 (7), pp. 4151–4164.
Pulvirenti, L., Chini, M., Pierdicca, N.,Boni, G. 2016. Use of SAR Data for Detecting Floodwater in Urban and Agricultural Areas: The Role of the Interferometric Coherence. In IEEE
Trans. Geosci. Remote Sensing 54 (3), pp. 1532–1544.
Pulvirenti, L., Pierdicca, N., Chini, M.,Guerriero, L. 2011. An algorithm for operational flood mapping from Synthetic Aperture Radar (SAR) data using fuzzy logic. In Nat. Hazards
Earth Syst. Sci. 11 (2), pp. 529–540.
Pulvirenti, L., Pierdicca, N., Chini, M.,Guerriero, L. 2013. Monitoring Flood Evolution in Vegetated Areas Using COSMO-SkyMed Data: The Tuscany 2009 Case Study. In
IEEE J. Sel. Top. Appl. Earth Observations Remote Sensing 6
(4), pp. 1807–1816.
Richards, J. A., Woodgate, P. W.,Skidmore, A. K. 1987. An explanation of enhanced radar backscattering from flooded forests. In International Journal of Remote Sensing 8 (7),
pp. 1093–1100. Available online at
http://dx.doi.org/10.1080/01431168708954756.
Schlaffer, S., Matgen, P., Hollaus, M.,Wagner, W. 2015. Flood detection from multi-temporal SAR data using harmonic analysis and change detection. In International Journal of
Applied Earth Observation and Geoinformation 38, pp. 15–24.
Schumann, G., Di Baldassarre, G.,Bates, P. D. 2009. The Utility of Spaceborne Radar to Render Flood Inundation Maps Based on Multialgorithm Ensembles. In IEEE Trans. Geosci. Remote
Sensing 47 (8), pp. 2801–2807.
Townsend, P. A. 2001. Mapping seasonal flooding in forested wetlands using multi-temporal radarsat SAR. In
Photogrammetric Engineering and Remote Sensing 67 (7),
pp. 857–864.
Twele, A., Cao, W., Plank, S., Martinis, S. (submitted). Sentinel-1 based flood mapping: a fully automated processing chain. In International Journal of Remote Sensing.
Voormansik, K., Praks, J., Antropov, O., Jagomagi, J.,Zalite, K. 2014. Flood Mapping With TerraSAR-X in Forested Regions in Estonia. In IEEE J. Sel. Top. Appl. Earth Observations Remote
Sensing 7 (2), pp. 562–577.
White, L., Brisco, B., Dabboor, M., Schmitt, A., Pratt, A. 2015. A Collection of SAR Methodologies for Monitoring Wetlands. In Remote Sensing 7 (6), pp. 7615–7645.