Ventilation Rate Have More Common Colds: Evidence for
Airborne Transmission
Yuexia Sun1,2*, Zhigang Wang3, Yufeng Zhang1, Jan Sundell4,5
1School of Environmental Science and Engineering, Tianjin University, Tianjin, China,2Architecture Engineering Department, Pennsylvania State University, State College, Pennsylvania, United States of America, 3Tianjin Municipal Engineering Design and Research Institute, Tianjin, China,4The Faculty of Urban Construction and Environmental Engineering, Chongqing University, Chongqing, China,5School of Architecture, Tsinghua University, Beijing, China
Abstract
Objective:To test whether the incidence of common colds among college students in China is associated with ventilation rates and crowdedness in dormitories.
Methods:In Phase I of the study, a cross-sectional study, 3712 students living in 1569 dorm rooms in 13 buildings responded to a questionnaire about incidence and duration of common colds in the previous 12 months. In Phase II, air temperature, relative humidity and CO2concentration were measured for 24 hours in 238 dorm rooms in 13 buildings, during both summer and winter. Out-to indoor air flow rates at night were calculated based on measured CO2concentrations.
Results:In Phase I, 10% of college students reported an incidence of more than 6 common colds in the previous 12 months, and 15% reported that each infection usually lasted for more than 2 weeks. Students in 6-person dorm rooms were about 2 times as likely to have an incidence of common colds$6 times per year and a duration$2 weeks, compared to students in 3-person rooms. In Phase II, 90% of the measured dorm rooms had an out-to indoor air flow rate less than the Chinese standard of 8.3 L/s per person during the heating season. There was a dose-response relationship between out-to indoor air flow rate per person in dorm rooms and the proportion of occupants with annual common cold infections$6 times. A mean ventilation rate of 5 L/(sNperson) in dorm buildings was associated with 5% of self reported common cold$6 times, compared to 35% at 1 L/(sNperson).
Conclusion: Crowded dormitories with low out-to indoor airflow rates are associated with more respiratory infections among college students.
Citation:Sun Y, Wang Z, Zhang Y, Sundell J (2011) In China, Students in Crowded Dormitories with a Low Ventilation Rate Have More Common Colds: Evidence for Airborne Transmission. PLoS ONE 6(11): e27140. doi:10.1371/journal.pone.0027140
Editor:Malcolm Gracie Semple, University of Liverpool, United Kingdom
ReceivedFebruary 8, 2011;AcceptedOctober 11, 2011;PublishedNovember 16, 2011
Copyright:ß2011 Sun et al. This is an open-access article distributed under the terms of the Creative Commons Attribution License, which permits unrestricted use, distribution, and reproduction in any medium, provided the original author and source are credited.
Funding:These authors have no support or funding to report.
Competing Interests:The authors have declared that no competing interests exist.
* E-mail: yxiasun@gmail.com
Introduction
‘‘Common cold’’ is a conventional term for a mild upper respiratory illness, with symptoms such as nasal blockage and discharge, sneezing, sore throat and cough [1]. Adults typically have 2–5 common colds per year, and children 4–8 colds [2]. Although such infections are often regarded as trivial, the cost to society is large [3]. Rhinoviruses have been associated with 40–65% of ‘‘common colds’’ through the year [4], and up to 80–92% of colds during outbreaks [5].
Cross-infection from an infected person to a healthy person depends on a number of factors, including how many viral particles are shed by the infected person, and the viral particles’ survivability, both over time and with respect to distance from source in a shared environment. Three main mechanisms have been proposed for transmission of viruses causing airways infections:
N
contact with secretions that contain the virus, either directly (e.g. hand to hand) from an infected person or indirectly from surfaces (e.g. door knob),N
‘‘large’’ airborne droplets, which are produced by an infected person during talking, sneezing, or coughing, and can only spread in air for a distance of less than 1–2 m before falling down,N
‘‘small’’ droplet nuclei (dried droplets), that can stay airborne for an extended time and be transported long distances.Despite many years of study, the routes of spread of viral airways infections remain controversial. One opinion is that the virus is transferred through direct contact [6], while the other is that the virus is transferred through airborne spread [7,8]. During the SARS epidemic, early preventive messages to the public were to wash hands and, generally to avoid ‘‘direct’’ contact spread. Later, analysis of the temporal and spatial distributions of SARS cases in a large community outbreak in Hong Kong and the correlation of these data with the three-dimensional spread of a virus-laden aerosol plume indicated an important role for airborne spread of droplet nuclei [9].
increased attention from the public, government, media and scientists [10]. Brundage et al. [11] studied the risk of febrile acute respiratory diseases at four army training centers and found that disease rates were significantly higher among trainees in modern energy efficient barracks that had a low ventilation rate. Menzies et al. [12] suggested that there was a relationship between lower ventilation rates and more frequent tuberculosis infections among hospital workers. Milton et al. [13] reported an association between sick leave of employees and outdoor air supply rate. Myatt’s [14] study showed that the probability of detecting airborne rhinoviruses was positively associated with weekly average CO2 concentration in an office. Other factors found to
be associated with rate of infectious diseases include occupancy level [15], cleaning routines and ‘‘damp’’ buildings [16]. With respect to crowding, direct and surface contact as well as airborne transmission both appears to be factors in disease transmission. Hoge et al. found that severe overcrowding and inadequate ventilation contributed to an outbreak of pneumococcal disease in a large urban jail [17].
In China, one 20 m2dormitory room is shared by 6–8 bachelor students or 4 master students or 3 PhD students. While such crowded spaces may be important sites for the propagation of respiratory infections, few studies have examined dorm room ventilation and its possible association with infection transmission. The aim of this paper is to test whether the common cold is associated with how crowded a dorm room is and how well ventilated it is among college students in China.
Methods
Ethics statement
Verbal consents were obtained from participants, since participants did not want to be tracked back by signature. Both the study and the consent procedure were approved by the ethics committee at Tianjin University.
Recruitment and measurement procedure
This study is part of the ‘‘Dorm Environment and Occupants’ Health’’ study, which was carried out from 2006 to 2007 at Tianjin University, China. Details of the recruitment process and questionnaire contents have been previously described [18].
In brief, this study consisted of two phases. In Phase I, demographic information, the health status of 6500 students, and building and room characteristics of 2117 dorm rooms at Tianjin University were surveyed by questionnaires. The questionnaire survey was anonymous, but building number and room number were reported by participants. Project members visited dorm rooms, distributed questionnaires and explained to participants how to fill out questionnaires. The questionnaires were collected 2 days later. The questions on common cold infections were ‘‘how many times have you had a common cold in the previous 12 months (options: ,6 times; 6–10 times; .10 times)’’ and ‘‘how long does a common cold usually last (options: ,2 weeks; 2–4 weeks; .4 weeks)’’. Other questions were about frequencies of window opening, cleaning routines and environmental tobacco smoke (ETS) exposure.
In Phase II, air temperature, relative humidity and CO2
concentration in dorm rooms were measured by indoor air quality monitor PS 31 (http://www.sensotron.pl) for 24 hours. Air quality monitors were calibrated at the International Center for Indoor Environment and Energy, Technical University of Denmark prior to measurements. Dorm occupants reported opening status of doors and windows at day and at night during measurement
(options: completely close; 2 cm open; 5 cm open; 50% open; completely open).
The out-to indoor air flow rate at night was calculated from an analysis of the build-up period of metabolic CO2 produced by
sleeping occupants (1:00 a.m.–8:00 a.m.) [19]. Calculation details are described in Information S1. CO2 concentrations of dorm
rooms were measured both in the summer (May–Jul., 2006) and in the winter (Dec., 2006–Apr., 2007) [20]. The average indoor air temperature and relative humidity at night were calculated (1:00 a.m.–8:00 a.m.). Outdoor CO2concentration and meteorological
parameters were also measured on campus during the same time.
Statistics
The associations among gender, age, whether family member ever had asthma and allergy, environmental tobacco smoke, cleaning routine, window opening frequency, occupancy levels, and self-reported common cold incidence and duration were analyzed by Chi-square tests. Adjusted odds ratios of crowdedness and air flow rate for common cold infections were evaluated in multiple logistic regression models. A carbon dioxide-based risk equation [21] was used to calculate the basic reproductive number of common colds which was compared to the self-reported infection rate.
APvalue less than 0.05 indicates statistical significance. SPSS software 15.0 was used to perform the statistical analyses.
Results
Phase I
In Phase I, 3712 students living in 1569 dorm rooms in 13 buildings answered the questionnaire, giving a response rate of 57%. Surveys for 276 students were excluded from the analysis due to missing information. Forty eight percent (48%) of students were female. PhD students’ mean age was 29 years, master students 25 years and bachelor students 22 years. Monday through Friday, 18% of participants spent less than 2 hours indoors watching TV/playing games per day, 36% spent 2–10 hours per day, and 46% spent more than 10 hours per day. Dorm buildings had 3–12 floors, with 26–43 dorm rooms per floor. All floors in each dorm building are homogeneous with regard to occupants’ gender and education level. Dorm rooms consisted of one simple bedroom. Each floor provided two washing rooms and restrooms. Six bachelor students, 4 master students or 3 PhD students shared one dorm room with a volume of 50–70 m3. The average density was 5 m2per person. Based on the questionnaire data from Phase I, 238 dorm rooms with 473 students living in these dorms were evaluated for Phase II. The evaluated dorm rooms represented different building structures, construction periods, locations and occupancy levels. There were no significant differences in students’ ages, gender, self-reported common cold incidence or duration between Phase I and Phase II.
significant effect on the incidence of common cold (p = 0.029), but after adjustment for environmental tobacco smoke, males were still at greater risk for common colds (p = 0.010). Younger students lived in more crowded rooms and reported longer duration colds. Crowding, not age, was shown by stratification for occupancy level to be the significant association with common cold duration.
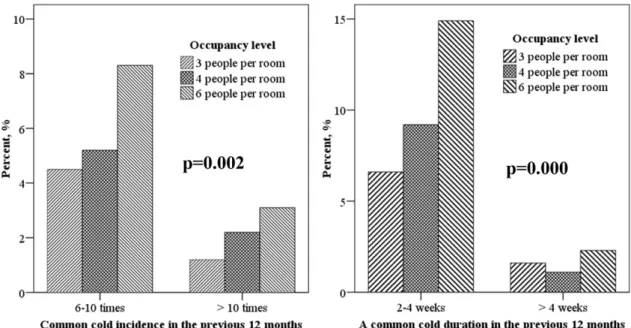
Self-reported common cold incidence and duration are compared for different occupancy levels in Figure 1. With incrementally increasing occupancy in dorm rooms, the propor-tion of occupants with$6 common colds increased significantly (p = 0.002), as did the proportion of occupants with $2 weeks common cold duration (p = 0.000). The odds ratios of crowdedness for common cold incidence of$6 times and duration of$2 weeks, adjusted for gender, age, hours spent indoors, family members’ asthma and allergy history, environmental tobacco smoke exposure are shown in Figure 2. Students in 6-person rooms were about 2.0 times as likely to have a common cold incidence $6 times per year and a duration$2 weeks, as students in 3-person dorm rooms.
Phase II
For Phase II, the evaluated dorm rooms were located in 13 buildings. Four were built between 1940 and 1960, two between 1977 and 1983, three between 1993 and 1999, and four after 2000. For newly constructed dorm buildings, concrete structure
and PVC frame windows were used instead of the brick-stone structure and the wooden frame windows used in older buildings. Ventilation for all dorm rooms consisted solely of opening doors and windows. The out-to indoor air flow rates for rooms measured during summer varied significantly, from 0.8 to 110 L/s per person, with a median of 18 L/s per person. Air flow rates measured in the heating season (from Dec. 5, 2006 to Apr. 14, 2007) varied from 0.3 to 24 L/s per person, with a median of 3.0 L/s per person. Ninety percent of the dorm rooms had an out-to indoor air flow rate less than 8.3 L/s per person.
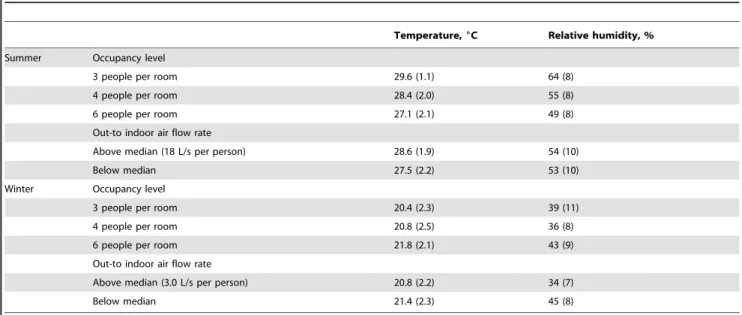
The average indoor air temperature (mean 28.0uC, 95% confidence interval (CI) 27.8uC–28.3uC, range 22.0uC–32.1uC) and relative humidity (mean 54%, 95% CI 53%–55%, range 27%–78%) in summer were high and had large variations consequent to opening doors and windows as the sole mode of ventilation. During the winter season when the heating system was in use and doors and windows were closed, weather conditions had less influence on the indoor thermal environment (temperature: mean 21.0uC, 95% CI 20.7uC–21.3uC, range 15.4uC–26.5uC; relative humidity: mean 40%, 95% CI 38%–41%, range 18%– 72%). Data for temperature and relative humidity in rooms with different occupancy levels and out-to indoor air flow rates are shown in Table 2. In summer, relative humidity and temperature were not different in rooms with different air flow rates. An inverse association between occupancy level and relative humidity was Table 1.Associations between common cold and demographic information and living habits of 3436 dormitory occupants, 2006– 2007.
Number Percent, %
Common cold incidence Common cold duration
Total 3436 ,6 times 6-10 times .10 times p3
,2 wks 2-4 wks .4 wks p Gender
Male 1782 88.3 8.5 3.2 87.7 10.6 1.8
Female 1654 91.7 6.0 2.3 0.006 82.7 15.2 2.1 0.000
Age
#23 yrs 2012 89.9 7.8 2.2 84.0 14.2 1.8
24-26 yrs 715 92.1 5.3 2.5 88.6 10.3 1.1
$27 yrs 219 92.6 5.1 2.3 0.164 90.3 8.3 1.4 0.009
Atopy1
Yes 231 79.5 15.3 5.2 68.9 26.3 4.8
No 3120 90.7 6.8 2.6 0.000 86.5 11.8 1.7 0.000
ETS2
Yes 573 87.4 10.0 2.6 86.3 10.9 2.8
No 2799 90.3 6.8 2.8 0.029 85.0 13.2 1.8 0.098
Cleaning routine
Every day 509 91.3 6.5 2.2 85.2 13.4 1.4
1-2 times/week 1844 90.8 6.7 2.5 85.4 12.8 1.8
,2 times/week 1034 87.8 8.6 3.6 0.088 84.8 12.7 2.4 0.644
Opening window
Every day 2816 90.2 7.0 2.8 85.0 13.1 1.9
1-2 times/week 467 88.8 8.0 3.2 85.8 12.6 1.5
,2 times/week 107 87.7 10.4 1.9 0.598 87.6 8.6 3.8 0.397
1.Whether any family member ever had asthma and allergy. 2.Environmental tobacco smoke.
3.Pearson Chi-square test.
caused by the measurement sequence (6-person dorms were measured at the driest time in May, whereas 3-person dorm rooms were measured in July when outdoor relative humidity was higher). Outdoor climate is the dominating factor in determining the indoor temperature and relative humidity in summer. In winter, rooms shared by 6 people had the highest relative humidity and temperature at night. A low out-to indoor air flow rate was related to a significantly higher relative humidity (p = 0.000).
However, common cold infections were not significantly associat-ed with indoor air temperature (p = 0.806) and relative humidity (p = 0.642).
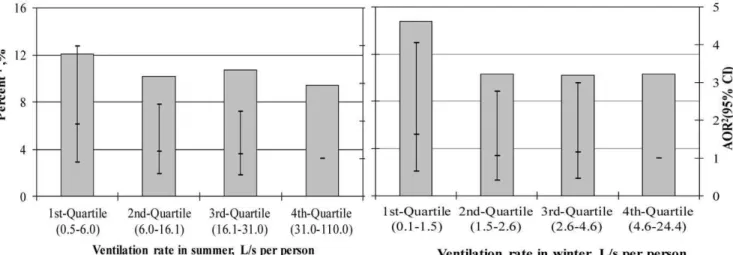
Figure 3 shows that the lowest quartile of out-to indoor air flow rates per person in both summer and winter were associated with an increased proportion of occupants with$6 common colds in the previous 12 months. The adjusted odds ratios of ventilation rates for common cold infections increased slightly across the Figure 1. Comparison of common cold incidence and duration for different occupancy levels.
doi:10.1371/journal.pone.0027140.g001
Figure 2. Associations between crowdedness and common cold annual incidence$6 times and duration$2 weeks.Odds ratios were adjusted for gender, age, hours spent indoors, family member allergy history and exposure to environmental tobacco smoke. Circles represent adjusted odds ratio (AOR) for incidence. Dashes represent AOR for duration. 95% confidence interval is demonstrated.
quartiles. The critical ventilation rate, below which common cold incidence increases, is identified. When ventilation rate is below 6 L/s per person, the common cold incidence in dorm rooms with average 4 occupants increased from 10% to 12%. When ventilation rate is below 1 L/s per person, the common cold incidence increased from 10% to 15%.
In our study, old buildings had more dampness problems, while new buildings using modern construction technologies had smaller ventilation rates [21]. Dampness problems have been reported to be associated with an increased incidence of common cold infections [18]. In order to eliminate the influence of indoor environmental factors other than poor ventilation, the mean ventilation rates in newly constructed dorm buildings were calculated and related to the percentage of occupants with common cold infections more than 6 times annually. The ventilation rates in winter are less than those in summer, and may help nail down the critical ventilation rate, below which common cold incidence increases. Figure 4 shows that the infection rate of common colds in the ‘‘tight’’ buildings constructed after 1993 is, in winter, associated with mean ventilation rate. There were 7 buildings constructed after 1993. One building was not included in the analysis because measurements were performed in only 9 dorm rooms. On average, there were 1140 occupants in each dorm building. A mean ventilation rate of 5 L/ (sNperson) was associated with$6 common colds per year in 5% of occupants , compared to a 35% for 1 L/(sNperson). There were 6
buildings constructed before 1993, among which 4 buildings had ,10 dorm rooms measured in winter and were excluded from the analysis. Of the remaining 2 buildings, one had mean ventilation rate of 5.7 L/(sNperson) and a common cold infection rate of
23.8%, while the other had a mean ventilation rate of 6.4 L/ (sNperson) and a common cold infection rate of 7.1%.
CO2-based risk equation
The Wells-Riley equation estimates the number of secondary infections that arise when a single infectious case is introduced into a population where everyone is susceptible [22]. This number is called the basic reproduction number. Rudnich and Milton [23]
expanded the Wells-Riley equation to apply to situations with non-steady state conditions and variable ventilation rates:
RA0~(n{1)½1{exp ({
fIqt
n ) ð1Þ
Where RA0is the basic reproduction number; n is the number of
occupants; f is the re-breathed fraction; and I is the number of infectors ( = 1). q is the quantum generation rate by an infected person (quanta/h), where a quantum is the amount of infectious material needed to produce infection in 63% of uniformly exposed animals, and is therefore 1.25 times the median infectious dose, 1.256ID50. t is the exposure time (h); f = (C-C0)/Ca, where Cais
the volume fraction of CO2 added to exhaled breath, C is the
volume fraction of CO2 in indoor air, and C0 is the volume
fraction of CO2in outdoor air.
The incidences (,6 times; 6–10 times; .10 times) and durations (,2 weeks; 2-4 weeks;.4 weeks) of common colds in the previous 12 months for different occupancy levels (6-people; 4-people; 3-people per dorm) were self-reported by occupants. The mean duration of a common cold is 7–10 days [1]. For this study we assumed that the duration of a common cold was 9 days. Although many viruses can produce symptoms of common cold, rhinovirus is the most frequent cause of the common cold [24]. Riley and Nardell suggested that q for rhinovirus is in the range of 1–10/h [25]. Here we inferred q = 9/h. We assumed that the infector remained in the dorm room 8 hours per day. The average CO2 concentrations in each dorm room from 1:00 a.m. to 8:00
a.m. were calculated. The estimated and self-reported number of common colds in each day in winter is compared (Table 3). These two numbers fit very well indicating the validity of this CO2-based
risk model in predicting infection rate of infectious disease like common cold.
If for a given population and infectious agent, the basic reproductive number .1 then that agent can spread in the population. The critical re-breathed fraction (fc), corresponding to
a basic reproduction number of 1, can be derived from Equation (1),
Table 2.Temperature and relative humidity in rooms with different occupancy levels and outdoor air flow rates, mean (standard deviation).
Temperature,6C Relative humidity, %
Summer Occupancy level
3 people per room 29.6 (1.1) 64 (8)
4 people per room 28.4 (2.0) 55 (8)
6 people per room 27.1 (2.1) 49 (8)
Out-to indoor air flow rate
Above median (18 L/s per person) 28.6 (1.9) 54 (10)
Below median 27.5 (2.2) 53 (10)
Winter Occupancy level
3 people per room 20.4 (2.3) 39 (11)
4 people per room 20.8 (2.5) 36 (8)
6 people per room 21.8 (2.1) 43 (9)
Out-to indoor air flow rate
Above median (3.0 L/s per person) 20.8 (2.2) 34 (7)
Below median 21.4 (2.3) 45 (8)
fc~
1
qtln ( n{1
n{2
)n ð2Þ
In the present study, the critical re-breathed fraction in rooms with different occupancy levels and the associated critical indoor CO2
concentrations above background (outdoor CO2 concentration)
were calculated from Equation (2), both as a function of exposure time (Figure 5(a)) and quantum generation rate (Figure 5(b)). Thus Figure 5 predicts the critical indoor CO2 concentrations beyond
which infectious disease will spread. The family of curves in Figure 5(a) describes the trends of the critical indoor CO2
concentrations above outdoor values (C-C0) as a function of
exposure times for risk of respiratory infections. The quantum generation rate used was 2/h. The critical CO2 concentration
above the background levels off if the common cold lasts more than 3 weeks (exposure time 8 hours/day, totally 168 hours) (Fig 5(a)). This indicates that even for less infectious agents with quanta generation rate no more than 2/h, a full fresh outdoor air system without recirculation of indoor air needs to be used in environments where people spend extended time (for example bedrooms, dorms, schools, daycare centers) in order to prevent
viral infections. In Figure 5(b), the exposure time was assumed to be 56 hours (8 hours/day, i.e. 7 days). It shows that the current ASHRAE standard of 700 ppm above the background level [26] would not prevent the infection from being spread in a dorm room with 6 occupants unless the quantum generation rate of infectious agents is no more than 1 quantum/h (Fig. 5(b)).
Discussion
The campus living style and dormitory conditions of students at Tianjin University is typical of China. The sample size in our study is large, and the response rate was reasonably good (57%). No significant difference was found between respondents and non-respondents in reporting wheeze and dorm room dampness [18]. Thus it is highly unlikely that selection bias impacted the findings of this study. Common cold is a conventional term for a mild upper respiratory illness. College students can be expected to understand what ‘‘common cold’’ refers to. There is no evidence to suggest that bachelor students have a different memory in reporting common cold infection, compared to PhD students. Compared to home environment, dorm buildings are perceived to be very crowded no matter whether 3 or 4 or 6 people share a 20 m2 room. Even students in 3-people-shared dormitory think their space is crowded. Therefore, the significant association between occupancy level and incidence of common colds, and the dose-response relationship between ventilation rate and incidence of common colds cannot be explained by reporting bias.
The occupants’ education level was not adjusted for when calculating the odds ratios of crowdedness for common cold infections since 3 PhD students or 4 master students or 6 bachelor students share one dorm room with similar volume. Education level itself should not be a confounding factor. Psychological stress, related to education status may have effect on common cold as indicated in a previous study [27]. However, our study found that less crowded dorm rooms occupied by PhD students were associated with less common cold infections. This cannot be explained by psychological stress since PhD students are supposed to be more stressed than master or bachelor students.
The summer measurement was from May to July and winter measurement from December to April. In summer measurements, 6-people-shared dormitories were measured first, followed by 4 or 3 people shared dormitories. In winter measurement, dorm Figure 3. Associations between ventilation rate and common cold annual incidence$6 times.1Proportion of occupants with
$6 common colds in the previous 12 months.2Odds ratios were adjusted for gender, age, family member allergy history, exposure to environmental tobacco smoke, building age and crowdedness. AOR: adjusted odds ratio; CI: confidence interval.
doi:10.1371/journal.pone.0027140.g003
Figure 4. Associations between common cold infection rates and mean ventilation rate in winter in buildings constructed after year 1993.1Proportion of occupants with$6 common colds in the previous 12 months.
buildings were measured randomly. There could be a potential systematic bias for summer measurement, but not for winter measurements. During the measurements, outdoor CO2
concen-trations and meteorological parameters were monitored. In principle, air change rate in buildings with natural ventilation system is not influenced by air relative humidity. Outdoor air
temperature itself and the consequent occupants’ behavior (e.g. opening doors/windows) may influence the air change rate in dorm rooms. In our study, the opening of doors/windows was reported by occupants themselves. In winter, occupants tended to close doors and windows tightly, so that variations in winter outdoor temperature had little influence on ventilation rate in Table 3.Comparison of estimated and self-reported basic reproduction number of common cold per day.
Percentage of students with
self-reported common cold incidence Indoor COconcentration (C)2 Re-breathedfraction (f)
Basic reproduction number of common cold
,6 times 6-10 times .10 times
Self-reported
(RA0) Estimated (RA0’)
Occupancy level (O) 6 (O6) 88.6 (D16) 8.3 (D26) 3.1 (D36) 1483 (C6) 0.032 (f6) 1.6 1.6
4 (O4) 92.6 (D14) 5.2 (D24) 2.2 (D34) 1021 (C4) 0.020 (f4) 1.0 0.9
3 (O3) 94.2 (D13) 4.5 (D23) 1.2 (D33) 1011 (C3) 0.019 (f3) 0.7 0.7
RA0,j~(P 3
i~1
(Di,jDi))OjM=T, person/day.
R’
A0,j~(Oj{1)½1{exp({ fjqt
Oj
), person/day.
Diis the assumed number of common cold infections in winter under different self-reported incidence rate, times. i indicates common cold incidence. i = 1, 2, 3. 1-common cold less than 6 times in the previous 12 months; 2-1-common cold 6-10 times; 3-comon cold more than 10 times. We assume D1= 3; D2= 6; D3= 8. Ojis the occupancy level, person/room. j indicates occupancy level. j = 3, 4, 6. 3-three people per dorm room; 4-four people per dorm room; 6-six people per dorm room. Di,jis the proportion of students with different self-reported common cold incidences, %.
M is the duration of a common cold, days. We assume M = 9 days [1]. T is days in winter season, 120 days.
Cjis the average CO2concentration from 1:00 a.m. to 8:00 a.m. in rooms with different occupancy levels, ppm.
fjis the re-breathed fraction of indoor air in rooms with different occupancy levels. fj= (Cj-C0)/Ca. Cais the volume fraction of CO2added to exhaled breath, 37000 ppm. C0is the volume fraction of CO2in outdoor air, 300 ppm.
q is the quantum generation rate by an infected person, quanta/h. We assume q = 9 quanta/h [25]. t is the time a infector remaining in the dorm room, hour/day. We assume t = 8 hours per day. doi:10.1371/journal.pone.0027140.t003
Figure 5. Critical indoor CO2 concentrations above background in dorm room as a function of exposure time and quantum
generation rate.(a) Quantum generation rate = 2 quanta/h, Ca= 37000ppm. (b) t = 56 hours (i.e. 7days), Ca= 37000 ppm.
dorm buildings. In summer, the mean outdoor air temperature was 29.6uC, ranging from 22.5uC to 35.2uC. The median air change rate was 4.42 h21
and 4.67 h21
when outdoor air temperature is below and above 29.6uC. There was no significant difference of air change rate for different temperatures in summer (p = 0.319). Therefore, it is reasonable to assume that, the air change rates measured in summer and winter are representative for respective season, without influence from small climate changes within each period.
While it is possible that some of the self-reported common colds were influenza, the infection rate of flu among adults is approximately once per year in this part of China. Therefore, this possible error would not change our results. Moreover, common colds and influenza are spread in a similar way; the present study could have been titled ‘‘airways infections’’. In each dorm room, CO2concentrations were measured for 24 hours in
both summer and winter. As measurements were made over a long period, i.e. summer measurements between May and July and winter measurements between December and April, and for 238 rooms, the mean values of ventilation rates should be valid for rooms with different occupancies and opening status of windows/ doors, and for changes in the outdoor climate.
There were imperfections in our data collection. In some rooms occupants may have had the window open during the night measurements in winter. Perhaps the incidence of common cold was influenced by an influenza epidemic. These sources of error would shift our findings towards the null hypothesis, that there was no association between common cold infections and dorm crowdedness or ventilation rate. Our findings are robust in spite of these possible problems. Thus, it is likely that more measurements and more accurate data on types of airways infections would show an even stronger association.
The out-to indoor air flow rate required by the Indoor Air Quality Standard of China is 8.3 L/s per person [28]. In the present study, 90% of the dorm rooms measured during winter had night-time ventilation rates less than this value. CO2
concentration in corridors was not measured, so that the fresh out-to indoor air flow rate may have been even lower than the calculated value in cases when corridor windows were closed.
The suggested dose-response relationship between dorm ventilation rate and common cold infections among occupants can be extrapolated to other crowded public premises with substandard ventilation rate, meaning a possible important public health topic for e.g. schools, daycare centers.
Although it is widely held that people in crowded spaces have more airways infections [15,29], there are few studies on this. Our
study is among the first published suggesting a relationship between occupancy levels, ventilation rates, and respiratory infections. With 6 occupants instead of 3 in a 20 m2dorm room, the proportion of occupants with incidence of more than 6 common colds in the previous 12 months doubled. When crowdedness is adjusted for, a lower ventilation rate is associated with an increased risk of common cold. This finding is consistent with Shendell’s study in schools, which showed that a 1000 ppm increase in dCO2 (difference between indoor and outdoor CO2
levels) was associated with a 0.5%–0.9% decrease in annual average daily attendance [30]. For office buildings, Milton found that short-term sick leave was reduced by 35% at 24 L/s per person compared to 12 L/s per person outdoor air flow [13].
A crucial question is whether the increased frequency of common colds in crowded places is due to direct contact (or via surfaces), via droplets or via droplet nuclei. The strong association with ventilation in this study indicates that airborne transmission is important and perhaps the main route.
Conclusion
Crowdedness and outdoor air ventilation per person are important for the spread of airborne infectious diseases in rooms such as dorms where people spend a lot of time. Respiratory viruses can be transmitted through air so that transmission is modulated by outdoor air supply rates. Further studies are warranted.
Supporting Information
Information S1 Dormitory outdoor air flow rate calcu-lation by using CO2method.
(DOCX)
Acknowledgements
We would like to thank Louise B. Weschler for her constructive comments, thoroughly proof-reading and editing of our paper.
Author Contributions
Conceived and designed the experiments: YS YZ JS. Performed the experiments: YS ZW. Analyzed the data: YS ZW JS. Contributed reagents/materials/analysis tools: YS YZ JS. Wrote the paper: YS JS. Contacted potential participants and communicated with the IRB committee: YS ZW YZ JS.
References
1. Heikkinen T, Ja¨rvinen A (2003) The common cold. The Lancet 361(9351): 51–59.
2. Barker J, Stevens D, Bloomfield SF (2001) Spread and prevention of some common viral infections in community facilities and domestic homes. J Appl Microbiol 91: 7–21.
3. Bertino JS (2002) Cost burden of viral respiratory infections: issues for formulary decision makers. Am J Med 112(suppl 6A): 42S–49S.
4. Hayden F, Kaiser D, Albrecht J (1988) Intranasal recombinant alfa-2b interferon treatment of naturally occurring common colds. Anitmicrob Agents Chemother 32: 224–230.
5. Makela MJ, Puhakka T, Ruuskanen O, Leinonen M, Saikku P, et al. (1998) Viruses and bacteria in the etiology of the common cold. J Clin Microbiol 36: 539–542.
6. Gwaltney MJ, Hendley JO (1978) Rhinovirus transmission: one if by air, two if by hand. Am J Epidemiol 107: 357–361.
7. Dick EC, Jennings LC, Mink KA, Wartgow CD, Inborn SL (1987) Aerosol transmission of rhinovirus colds. J Infect Dis 156: 442–448.
8. Jennings LC, Dick EC (1987) Transmission and control of rhinovirus colds. Eur J Epidemiol 3: 327–35.
9. Yu ITS, Li Y, Wong TW, Tam W, Chan AT, et al. (2004) Evidence of airborne transmission of the severe acute respiratory syndrome virus. New Engl J Med 350(17): 1731–1739.
10. Li Y, Leung GM, Tang JW, Yang X, Chao CYH, et al. (2007) Role of ventilation in airborne transmission of infectious agents in the built environment-a multidisciplinenvironment-ary systemenvironment-atic review. Indoor Air 17: 2–18.
11. Brundage JF, Scott RM, Lednar WM, Smith DW, Miller RN (1988) Building-associated risk of febrile acute respiratory diseases in army trainees. JAMA 259(14): 2108–2112.
12. Menzies D, Fanning A, Yuan L, FitzGerald M and the Canadian Collaborative Group in Nosocomial Transmission of TB (2000) Hospital ventilation and risk for tuberculosis infection in Canadian health care workers. Ann Intern Med 133: 779–789.
13. Milton DK, Glencross PM, Walters MD (2000) Risk of sick leave associated with outdoor air supply rate, humidification, and occupant complaints. Indoor Air 10: 212–221.
15. Jaakkola JJK, Heinonen OP (1995) Shared office space and the risk of the common cold. Eur J Epidemiol 11: 213–216.
16. Pirhonen I, Nevalainen A, Husman T, Pekkanen J (1996) Home dampness, moulds and their influence on respiratory infections and symptoms in adults in Finland. Eur Respir J 9: 2618–2622.
17. Hoge CW, Reichler MR, Dominguez EA, Bremer JC, Mastro TD, et al. (1994) An epidemic of peumococcal disease in an overcrowded, inadequately ventilated jail. New Eng J Med 331(10): 643–648.
18. Sun Y, Zhang Y, Sundell J, Fan Zh, Bao L (2009) Dampness at dorm and its associations with allergy and airways infection among college students in China: a cross-sectional study. Indoor Air 19: 174–182.
19. Stavova P (2004) A method for air change rate measurements in dwellings based on carbon dioxide produced by people. Master Thesis. Denmark: Technical University of Denmark.
20. Sun Y, Zhang Y, Bao L, Fan Z, Sundell J (2011) Ventilation and dampness in dorms and their associations with allergy among college students in China: a case-control study. Indoor Air 21(4): 277–283.
21. Sun Y, Wang Z, Zhang Y, Sundell J (2009) On the association between building characteristics, dorm dampness, and ventilation rates. Proceedings of the 11th International ROOMVENT Conference, Busan, Korea, May 24-27, 2009.. pp 364–369.
22. Riley EC, Murphy G, Riley RL (1978) Airborne spread of measles in a suburban elementary school. Am J Epidemiol 107: 421–432.
23. Rudnick SN, Milton DK (2003) Risk of indoor airborne infection transmission estimated from carbon dioxide concentration. Indoor Air 13: 237–245. 24. Goldmann DA (2000) Transmission of viral respiratory infections in the home.
Pediatr Infect Dis J 19(10): S97–S102.
25. Riley RL, Nardell EA (1989) Clearing the air. The theory and application of ultraviolet air disinfection. American Review of Respiratory Disease 139: 1286–1294.
26. ASHRAE (1999) ASHRAE Standard 62-1999, Ventilation for Acceptable Indoor Air Quality. Atlanta: American Society of Heating, Air-Conditioning and Refrigeration Engineers, Inc.
27. Cohen S, Tyrrell DAJ, Smith AP (1991) Psychological stress and susceptibility to the common cold. New Engl J Med 325: 606–612.
28. GB/T (2002) GB/T 18883-2002. Indoor Air Quality Standard. Beijing: National Environment Agency, Beijing.
29. Drinka PJ, Krause P, Schilling M, Miller BA, Shult P, et al. (1996) Report of an outbreak: nursing home architecture and influenza-an attack rates. J Am Geriatr Soc 44: 910–913.