ACPD
12, 11979–12021, 2012Evidence of an elevated source
P. Crippa et al.
Title Page
Abstract Introduction
Conclusions References
Tables Figures
◭ ◮
◭ ◮
Back Close
Full Screen / Esc
Printer-friendly Version Interactive Discussion
Discussion
P
a
per
|
Dis
cussion
P
a
per
|
Discussion
P
a
per
|
Discussio
n
P
a
per
|
Atmos. Chem. Phys. Discuss., 12, 11979–12021, 2012 www.atmos-chem-phys-discuss.net/12/11979/2012/ doi:10.5194/acpd-12-11979-2012
© Author(s) 2012. CC Attribution 3.0 License.
Atmospheric Chemistry and Physics Discussions
This discussion paper is/has been under review for the journal Atmospheric Chemistry and Physics (ACP). Please refer to the corresponding final paper in ACP if available.
Evidence of an elevated source of
nucleation based on model simulations
and data from the NIFTy experiment
P. Crippa1, T. Pet ¨aj ¨a2, H. Korhonen3, G. S. El Afandi4, and S. C. Pryor1
1
Atmospheric Science Program, College of Arts and Sciences, Indiana University, Bloomington, IN 47405, USA
2
Department of Physics, University of Helsinki, Helsinki, Finland
3
Finnish Meteorological Institute, Kuopio Unit, Kuopio, Finland
4
College of Agricultural, Environment and Nutrition Sciences – College of Engineering, Tuskegee University, Tuskegee, AL 36088, USA
Received: 5 March 2012 – Accepted: 12 April 2012 – Published: 9 May 2012 Correspondence to: P. Crippa ([email protected])
ACPD
12, 11979–12021, 2012Evidence of an elevated source
P. Crippa et al.
Title Page
Abstract Introduction
Conclusions References
Tables Figures
◭ ◮
◭ ◮
Back Close
Full Screen / Esc
Printer-friendly Version Interactive Discussion
Discussion
P
a
per
|
Dis
cussion
P
a
per
|
Discussion
P
a
per
|
Discussio
n
P
a
per
|
Abstract
New particle formation has been observed at a number of ground-based measure-ment sites. Prior research predominantly from Europe has provided evidence that this new particle formation, while observed in the near-surface layer, is actually occurring in atmospheric layers above the surface and appears to be focused in or close to the 5
residual layer formed by the nocturnal inversion. Here, we present both observations and modeling for southern Indiana, which support this postulate. Based on simulations with a detailed aerosol dynamics model and the Weather Research and Forecasting model, along with data from ground-based remote sensing instruments and detailed gas and particle phase measurements, we show evidence that (i) the maximum rate 10
change of ultrafine particle concentrations as observed close to the surface is always preceded by breakdown of the nocturnal inversion and enhancement of vertical mix-ing and (ii) simulated particle size distributions exhibit greatest accord with surface observations during and subsequent to nucleation only when initialized with a particle size distribution representative of clear atmospheric conditions, rather than the in situ 15
(ground-level) particle size distribution.
1 Introduction and objectives
Particle nucleation has been observed with high frequency at a geographically diverse suite of ground-based measurement sites (Kulmala et al., 2011) and plays a key role in determining the ambient particle size distribution (Spracklen et al., 2006), but the 20
controls and limitations on nucleation occurrence and growth remain uncertain. Key uncertainties pertain, in part, to mechanistic deconvolution of the chemical and physics controls and include questions regarding variation of nucleation intensity and mechanisms with height, and specifically whether nucleation occurs principally within the atmospheric boundary layer or is initiated at or close to the residual layer (or 25
ACPD
12, 11979–12021, 2012Evidence of an elevated source
P. Crippa et al.
Title Page
Abstract Introduction
Conclusions References
Tables Figures
◭ ◮
◭ ◮
Back Close
Full Screen / Esc
Printer-friendly Version Interactive Discussion
Discussion
P
a
per
|
Dis
cussion
P
a
per
|
Discussion
P
a
per
|
Discussio
n
P
a
per
|
Stratmann et al., 2003; Wehner et al., 2010). Indications of a link between the occur-rence and intensity of nucleation and boundary layer dynamics is provided by obser-vations that enhancement of turbulent kinetic energy, associated with entrainment and development of the boundary layer, is frequently observed just prior to the appearance of newly formed particles in the mixed layer (Nilsson et al., 2001; Pryor et al., 2011). 5
Further balloon-borne observations during the SATURN experiment near Leipzig in Germany provided evidence that prior to the break-up of the nocturnal inversion nu-cleation was focused on the residual layer and, subsequent to erosion of the inversion and growth of the boundary layer, nucleation was observed throughout the planetary boundary layer (Stratmann et al., 2003; Wehner et al., 2007). Further evidence for an 10
elevated source of nucleated particles at continental sites in Europe was provided by data collected near Cabauw in the Netherlands in the IMPACT field campaign (Wehner et al., 2010). In that research vertical profiles of particle size distributions were taken in a helicopter borne package and the evolution of the boundary layer was observed using a lidar system. As in the SATURN experiment, analysis of the IMPACT measure-15
ments led the authors to infer that “it is very likely that these particles observed at the ground were formed at higher altitudes and mixed downwards” (Wehner et al., 2010). The IMPACT authors postulate that the strong vertical variability of new particle forma-tion is a result of enhanced turbulence and non-linear mixing in specific layers which resulted in supersaturation of precursor gases coupled with vertical heterogeneity of 20
in situ aerosol concentrations and thus variations in the condensational sink leading to enhancement or suppression of nucleation. Here we examine this issue further us-ing: (i) data from the Nucleation In ForesTs (NIFTy) experiment in southern Indiana in conjunction with simulations conducted using the Weather Research and Forecasting (WRF) model and (ii) a novel approach based on the application of a parameterized 25
ACPD
12, 11979–12021, 2012Evidence of an elevated source
P. Crippa et al.
Title Page
Abstract Introduction
Conclusions References
Tables Figures
◭ ◮
◭ ◮
Back Close
Full Screen / Esc
Printer-friendly Version Interactive Discussion
Discussion
P
a
per
|
Dis
cussion
P
a
per
|
Discussion
P
a
per
|
Discussio
n
P
a
per
|
the region of the atmosphere in which nucleation is initiated. On the basis of the sen-sitivity analysis conducted using as input to the model conditions observed close to the ground versus those associated with an elevated source of nucleation we infer that nucleation is initiated aloft. Supporting evidence for these assertions is drawn from ground-based particle size distribution measurements, observed and modeled profiles 5
of the meteorological state parameters and lidar backscatter measurements.
2 Methods
2.1 NIFTy
During the Nucleation In ForesTs (NIFTy) experiment, conducted between 5 and 31 May 2008, particle physical and chemical properties, gas phase concentrations and 10
meteorological parameters of state were measured at three locations along an 80 km transect in southern Indiana from Indianapolis in the northeast to the small college town of Bloomington in the southwest (Pryor et al., 2011). The primary measurements used herein were collected during the later portion of the NIFTy experiment (14–27 May) at the Morgan Monroe State Forest (MMSF) tower site, centrally located along this tran-15
sect. A Scanning Mobility Particle Sizer (SMPS) system from TSI Inc. (SMPS 3936) and a Fast Mobility Particle Sizer (FMPS 3091) (TSI, Inc.) were deployed at MMSF to measure simultaneously particle size distributions from a height of 46 m (above a canopy of 28 m). Measured particle concentrations were corrected using the exper-imentally derived tubing particle transmission efficiencies presented in (Pryor et al.,
20
2010). Thirty-minute average concentrations of SO2and H2SO4were measured below the forest canopy using a TECO (model 43S) monitor and a Chemical Ionization Mass Spectrometer (CIMS) (Eisele and Tanner, 1993; Mauldin et al., 2003; Pet ¨aj ¨a et al., 2009). VOC concentrations were measured at the canopy top in six approximately 2-h intervals starting at 09:00 (LST) on multi-sorbent cartridges and analyzed for isoprene, 25
ACPD
12, 11979–12021, 2012Evidence of an elevated source
P. Crippa et al.
Title Page
Abstract Introduction
Conclusions References
Tables Figures
◭ ◮
◭ ◮
Back Close
Full Screen / Esc
Printer-friendly Version Interactive Discussion
Discussion
P
a
per
|
Dis
cussion
P
a
per
|
Discussion
P
a
per
|
Discussio
n
P
a
per
|
m-, and p-xylene. Meteorological conditions at the site were measured using microme-teorological equipment installed on this AmeriFlux tower, a scanning doppler lidar (Nat-ural Power ZephIR lidar), a Vaisala tethersonde and a Vaisala ceilometer (CL31) (see Pryor et al. 2011 for a full description of the instrumentation deployed at MMSF). Dur-ing NIFTy particle size distribution measurements were also made usDur-ing an FMPS and 5
SMPS, respectively at a site in Bloomington (18 km SW of MMSF) and in Indianapolis (60 km NE of MMSF).
Long-term measurements at the MMSF site indicate evidence of elevated concen-trations of ultra-fine particles (Dp: 6–30 nm) on approximately 1 day in 5 (Pryor et al.,
2010), with a highest frequency in May, consistent with observed high concentrations 10
of ultra-fine particles on nearly half of all sampling days during NIFTy (Table 1) (Pryor et al., 2011).
2.2 UHMA model
The UHMA model is a box-model containing parameterizations of the dynamics of multicomponent particles including nucleation (based on parameterization of binary, 15
ternary and kinetic nucleation), condensation, coagulation and dry deposition (Korho-nen et al., 2004). In this study, the particle size distribution (PSD) is treated using a fixed sectional discretization of the size distribution in the modified version of the hybrid grid (Jacobson and Turco, 1995), which does not require any assumption regarding the PSD and allows us to describe accurately the variability associated with field mea-20
surements (Spracklen et al., 2005). Since only condensed core compounds need to be split among size sections, numerical diffusion is reduced (Jacobson and Turco, 1995).
Herein we employ the UHMA model using the following assumptions:
– The temporal variation of boundary layer depth (and thus box model volume in which concentrations are assumed to be homogeneous) is simulated using a 25
ACPD
12, 11979–12021, 2012Evidence of an elevated source
P. Crippa et al.
Title Page
Abstract Introduction
Conclusions References
Tables Figures
◭ ◮
◭ ◮
Back Close
Full Screen / Esc
Printer-friendly Version Interactive Discussion
Discussion
P
a
per
|
Dis
cussion
P
a
per
|
Discussion
P
a
per
|
Discussio
n
P
a
per
|
nighttime hours) based on data obtained from a tethersonde system deployed during NIFTy and confirmed based on simulations conducted using the WRF model. All other physical state parameters (e.g. temperature and humidity) are input hourly to the model based on observed conditions at 46 m.
– Particle removal. Within the original UHMA model dry deposition processes are 5
described by a semi-empirical parameterization validated for the boreal forest in Hyyti ¨al ¨a, Finland (Rannik et al., 2003). Deposition velocities over deciduous forests have been shown to be lower than those measured over boreal forests (Pryor et al., 2009), thus we implemented a physical parameterization of dry de-position (Slinn, 1982; Pryor and Binkowski, 2004) constrained to match observed 10
size-resolved particle deposition velocities of sub-100 nm diameter particles as measured at the MMSF site (Pryor et al., 2009). No removal by wet deposition was parameterized.
– A simplified gas phase chemical mechanismwas implemented following the work of (Boy et al., 2005) (Tables 2 and 3) and was solved using the Euler Backward 15
Iterative approach. Observed concentrations of the inorganic gases (sulfuric diox-ide (SO2) and ammonia (NH3)) and condensable organic gases were provided at hourly resolution to the model. Because we did not have direct observations of semi-volatile organic compounds, the concentration of the condensable organics was estimated from the observations of isoprene, a-pinene, cumene, limonene, 20
benzene, toluene, ethyl-benzene, (m,p)-xylene, and (o)-xylene using Fractional Aerosol Coefficients (FAC) (Grosjean, 1992). It is acknowledged that this
ap-proach neglects the availability of oxidants and the relationship with condensed mass (Griffin et al., 2003), but is applied here to broadly represent the potential
for the production of oxidation products with low volatility that might partition into 25
the particle phase.
– Comprehensive evaluations ofnucleation parameterizations(Zhang et al., 2010a, b; Sihto et al., 2006) have illustrated the challenge of selecting a theoretically
ACPD
12, 11979–12021, 2012Evidence of an elevated source
P. Crippa et al.
Title Page
Abstract Introduction
Conclusions References
Tables Figures
◭ ◮
◭ ◮
Back Close
Full Screen / Esc
Printer-friendly Version Interactive Discussion
Discussion
P
a
per
|
Dis
cussion
P
a
per
|
Discussion
P
a
per
|
Discussio
n
P
a
per
|
appropriate nucleation parameterization and the huge range of variation of model skill when predictions based on differing parameterizations are compared to
ob-served number concentrations (e.g. up to 3 orders of magnitude variations for the Aitken and accumulation mode). In order to select which of the nucleation pa-rameterizations was optimal for the simulations in southern Indiana, we used the 5
approach of Sihto et al. (2006) and Kuang et al. (2008) to examine the functional relationship between ultra-fine particle nucleation rate and observed sulfuric acid concentrations ([H2SO4]). If nucleation can be described using the activation ap-proach, then the formation rate of new particles should scale linearly with [H2SO4]. If the nucleation process is best described by the kinetic approach then the for-10
mation rate will tend to scale with the square of [H2SO4], while if it follows the ternary nucleation theory, with the critical cluster comprising NH3, H2SO4 and water molecules, the exponent should exceed 3 (Sihto et al., 2009). Thus:
J(1 nm)=K×[H
2SO4]n (1)
wherenrepresents the number of sulfuric acid molecules in each critical cluster. 15
The best linear fit of the logarithm of the nucleation rate and the logarithm of sulfuric acid concentration for class A events during NIFTy provided a value ofn of 1.78 andK of around 10−14(Fig. 1).J
1was computed based on (Kuang et al.,
2008):
J1(t)=J
10(t+ ∆t)×exp
1 2×
AFUCHS GR1−10×
s
48kBT π2ρ
1
q
Dρ1
−q1
Dρ10
(2)
ACPD
12, 11979–12021, 2012Evidence of an elevated source
P. Crippa et al.
Title Page
Abstract Introduction
Conclusions References
Tables Figures
◭ ◮
◭ ◮
Back Close
Full Screen / Esc
Printer-friendly Version Interactive Discussion
Discussion
P
a
per
|
Dis
cussion
P
a
per
|
Discussion
P
a
per
|
Discussio
n
P
a
per
|
WhereJ10was derived from the measured PSD from the SMPS and the median Fuchs surface area of the pre-existing particles duringt+ ∆twas computed as:
AFUCHS=4
3π×
Dp10
Z
Dp6
D2p× Kn
+Kn2
1+1.71Kn+1.33Kn2 !
n Dp
d Dp (3)
wheren Dp
is the number concentration of particles of diameterDp. The
Knud-sen number is defined as: 5
Kn=2λ
Dp
(4)
whereλis assumed to be 100 nm (Kuang et al., 2008), the particle density ρis 1.3 kgm−3 and k
B is the Boltzmann constant. An average ∆t of 0.5 h was
esti-mated from the time shift required to match the measured sulfuric acid concentra-tions with the 6–10 nm diameter average particle number concentraconcentra-tions. Based 10
on the results of the analysis of the nucleation rate as a function of sulfuric acid concentrations we chose to apply a kinetic approach to nucleation where the pref-actorK is derived from the basic kinetic theory, assuming nucleation to be limited by the collision rate of sulfuric acid molecules (Seinfeld and Pandis, 2006), rather than estimated from observations (Sihto et al., 2006).
15
We need to acknowledge the regression fit between log[H2SO4] and log(J1) is highly sensitive to the fitting time length since a fit conducted only on the duration of each nucleation event would provide higher slope values (Kuang et al., 2008). Because of the relative low temporal resolution of the available sulfuric acid mea-surements we fitted the model over a larger time span, than has been previously 20
used.
ACPD
12, 11979–12021, 2012Evidence of an elevated source
P. Crippa et al.
Title Page
Abstract Introduction
Conclusions References
Tables Figures
◭ ◮
◭ ◮
Back Close
Full Screen / Esc
Printer-friendly Version Interactive Discussion
Discussion
P
a
per
|
Dis
cussion
P
a
per
|
Discussion
P
a
per
|
Discussio
n
P
a
per
|
– Initial particle size distribution. For the base case simulations, the model was ini-tialized using the PSD measured by the FMPS at midnight (LST) of each simu-lated day (14–27 May 2008). In order to reduce the sensitivity to measurement un-certainty in each size bin, the data from the FMPS were fitted to three log-normal modes (see the example in Fig. 2). The geometric mean diameter, standard devi-5
ation and number concentration from these modes were then used to derive the initial number concentration in each of the model size sections. The model was then run for 24 h and evaluated over the same time period.
The time-step of the simulations was set to 10 s. A sensitivity analysis was undertaken to assess model performance as a function of the number of sections used to describe 10
the PSD, but for all other simulations, 250 sections, equally spaced in a logarithmic scale in the range of diameters between 3 nm and 10 µm, were used to match the discretization of the PSD for the sub 100-nm particles from the SMPS operated at MMSF in order to facilitate the evaluation of the model fit to the data.
Since the UHMA model has been previously theoretically validated (Korhonen et 15
al., 2004), herein we use statistical metrics not to evaluate the model per se but as a diagnostic tool. Three primary metrics of model performance are used:
a. The presence, absence and “type” of nucleation event as defined using a subjec-tive event classification (Boy and Kulmala, 2002):
class A: a new sudden particle mode appears in the diameter range below 25 nm 20
and it persists and grows for more than 1 h
class B: a new particle mode is present but it is not visible at the smallest mea-sured diameters. The computation of the growth rate may be uncertain because of high variations in the mode number concentration
class C: a new particle mode is present but does not show a clear growth 25
ACPD
12, 11979–12021, 2012Evidence of an elevated source
P. Crippa et al.
Title Page
Abstract Introduction
Conclusions References
Tables Figures
◭ ◮
◭ ◮
Back Close
Full Screen / Esc
Printer-friendly Version Interactive Discussion
Discussion
P
a
per
|
Dis
cussion
P
a
per
|
Discussion
P
a
per
|
Discussio
n
P
a
per
|
b. The skill of the UHMA model in predicting the particle number size distribution is quantified by metrics such as nucleation intensity, the growth rate and the accu-racy and timing of the peak number concentration. Nucleation intensity is quanti-fied as the total number of particles with diameter between 10 and 30 nm during the two hours with the highest total number concentration:
5
Intensity=X2
h=1
X30
Dp=10Nh,Dp (5) The growth rate is defined as the rate at which the number geometric mean diam-eter (DgN) in the nucleation mode (6–30 nm) evolves:
l nDgN= 30 P
j=6
nj×lnDj
N6−30 (6)
where lnDgN is the value of lnD weighted according to the number of particles
10
in that size interval, nj is the number of particles in a group whose diameters
are centered aroundDj andN6−30 is the total number of particles in the diameter range of 6–30 nm. The growth rate is computed fitting a first order polynomial to the number geometric mean diameters occurring in the three hours subsequent to the minimumDgN.
15
c. We also analyzed the accuracy of prediction of the peak number concentration and its timing, defined as the ratio between the maximum simulated (maxN6sim−10) and observed (maxN6obs
−10) number concentration of particles of size 6–10 nm and
the time difference (∆t) at which they occur respectively:
accuracy=maxN sim 6−10
maxN6obs
−10
(7) 20
ACPD
12, 11979–12021, 2012Evidence of an elevated source
P. Crippa et al.
Title Page
Abstract Introduction
Conclusions References
Tables Figures
◭ ◮
◭ ◮
Back Close
Full Screen / Esc
Printer-friendly Version Interactive Discussion
Discussion
P
a
per
|
Dis
cussion
P
a
per
|
Discussion
P
a
per
|
Discussio
n
P
a
per
|
∆t=tmaxNobs 6−10
−t
maxN6sim
−10
(8)
2.3 WRF simulations
The Weather Research and Forecasting model Version 3 (WRFV3), applied using the physics schemes listed in Table 4, was used to simulate meteorological conditions 5
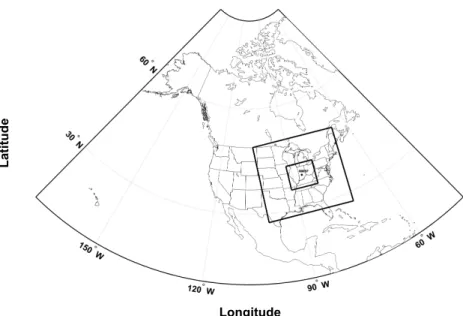
during 11–26 August 2008 over a parent domain (324×274 grid cells with a spatial
resolution of 9 km) and a nested domain (310×259 grid cells with a spatial resolution
of 3 km) (Fig. 3). The model was run using the Advanced Research WRF (ARW) solver in the non-hydrostatic mode with 35 vertical levels and initialized with lateral bound-ary conditions as simulated by the North American Mesoscale Model (NAM). The land 10
cover data were specified from the USGS 24-category data at a resolution of 3.7 km and 0.9 km for the parent and nested domain respectively. The WRF simulations were conducted principally to examine the vertical evolution of the planetary boundary layer and thus the primary physics scheme of interest to the current work is the PBL scheme. The Mellor-Yamada-Janjic scheme (a TKE-based 2.5-level closure) was selected be-15
cause it is relatively computationally efficient, has been widely used in prior research
and has been demonstrated to generate relatively representative temperature profiles and PBL heights in applications elsewhere (Hu et al., 2010).
3 Results
3.1 Evidence for an elevated source of nucleation from observations
20
ACPD
12, 11979–12021, 2012Evidence of an elevated source
P. Crippa et al.
Title Page
Abstract Introduction
Conclusions References
Tables Figures
◭ ◮
◭ ◮
Back Close
Full Screen / Esc
Printer-friendly Version Interactive Discussion
Discussion
P
a
per
|
Dis
cussion
P
a
per
|
Discussion
P
a
per
|
Discussio
n
P
a
per
|
all times were converted to a normalized scale in which the time is presented relative to the maximum gradient (i.e. rate change) in 10 nm particle number concentrations.
Turbulence intensity as measured with the ZephIR lidar indicates a strong link be-tween the occurrence of high concentrations of ultra-fine particles at the MMSF site and boundary layer dynamics. The greatest increase in the number concentration of 5
6–10 nm particles occurs approximately one hour prior to the peak of nucleation inten-sity at 46 m during class A events (Fig. 4a). Nearly simultaneously turbulence inteninten-sity rapidly increases from low values throughout the lowest 300 m of the atmosphere (rep-resentative of a stable nocturnal atmosphere) to more turbulent conditions associated with erosion of the nocturnal inversion and development of a fully mixed planetary 10
boundary layer (Fig. 4b). Thus erosion of the nocturnal inversion and increased verti-cal mixing always preceded the maximum concentration of ultra-fine particles and was observed to precede the maximum rate change of ultrafine particle concentrations by approximately 0.5 h.
Further evidence supporting the hypothesis of an elevated source of nucleation is 15
provided by the analysis of the condensational sink (CS) (Kulmala et al., 2001; Dal Maso et al., 2002) measured in the surface layer (at 46 m) during event class A days. The CS is a metric quantifying the role of preexisting particles in removing condens-able vapors from the atmosphere, thus a high CS is expected to suppress nucleation. As in research conducted elsewhere, there is a lack of correspondence between the 20
observed CS in near-surface measurements just prior to the largest rate change of ultrafine particles and the concentration of ultrafine particles (Fig. 5) (Boulon et al., 2011). This also supports our speculation of an elevated initiation of nucleation.
The Vaisala ceilometers has a wavelength of 910 nm and thus shows strongest re-sponse to the accumulation mode particles that also tend to dominate the PSD of 25
sulfuric acid and thus the condensational sink. The ceilometer backscatter measure-ments were processed following the approach of Stratmann et al. (2003), to examine evidence for elevated atmospheric layers with relatively low aerosol loading (i.e. low backscatter) and thus more favorable for nucleation occurrence (i.e. lower CS). In this
ACPD
12, 11979–12021, 2012Evidence of an elevated source
P. Crippa et al.
Title Page
Abstract Introduction
Conclusions References
Tables Figures
◭ ◮
◭ ◮
Back Close
Full Screen / Esc
Printer-friendly Version Interactive Discussion
Discussion
P
a
per
|
Dis
cussion
P
a
per
|
Discussion
P
a
per
|
Discussio
n
P
a
per
|
approach the backscatter signals from each 20 m increment in each 5 min period from each day is normalized to the average backscatter at that height over the period 06:00– 12:00 (LST). The backscatter profiles were integrated with vertical temperature profiles derived from simulations with the WRF model (Fig. 6) to examine the presence of a clear inversion and residual layer and to link the erosion of this layer to the appearance 5
of elevated concentrations of ultrafine particles. A couple of hours prior to nucleation appearance in the surface layer, event class A days are always characterized by a strong temperature inversion with a base located at approximately 400 m (Fig. 6g). This inversion is much weaker during event class B and class C days (Fig. 6h) and completely absent during non-event days which are usually characterized by greater 10
cloud cover (Fig. 6i). During event days, at the time newly formed particles are detected close to the surface, the nocturnal inversion is almost completely eroded. Moreover the relatively low elevation of the base of the residual layer (i.e. 600–700 m), coupled with intense mixing phenomena due to boundary layer dynamics, may favor the advection of new particles formed aloft into the mixed layer. Combining the vertical profiles of 15
temperature with the relative backscatter signal derived from ceilometer data provides direct evidence of boundary layer dynamics and mixing processes. The ceilometers data indicate that on event class A days there was a clear evidence for a low backscat-ter layer associated with the inversion and residual layer (Fig. 6a). Just prior to the maximum rate change of 10 nm particles in the surface observations the inversion is 20
eroded (Fig. 6), during the transition to a fully mixed layer with high particle number concentration. This transition often occurs simultaneously with or earlier than detec-tion of substantial numbers of sub 10-nm particles detected close to the ground, which strongly supports our hypothesis of particle entrainment from aloft.
Indirect evidence of nucleation being initiated aloft may be derived by examining 25
ACPD
12, 11979–12021, 2012Evidence of an elevated source
P. Crippa et al.
Title Page
Abstract Introduction
Conclusions References
Tables Figures
◭ ◮
◭ ◮
Back Close
Full Screen / Esc
Printer-friendly Version Interactive Discussion
Discussion
P
a
per
|
Dis
cussion
P
a
per
|
Discussion
P
a
per
|
Discussio
n
P
a
per
|
60 % and thus is not high enough to explain the observed 6 nm particle concentrations. The low concentrations of 3 nm particles might be related to limitations of the deployed instrument and the experimental setup but may also reflect early aging (i.e. growth by condensation and coagulation) of freshly nucleated particles formed elsewhere from the sampling site as also speculated by Pierce et al. (2011). Following the logic pre-5
sented in Birmili and Wiedensohler (2000), the presence of a closed contour in the particle number size distribution profile (see Fig. 7) is also indicative of non-local nu-cleation (i.e. that the particles being observed were formed earlier – in this case in an elevated layer).
3.2 Evidence for an elevated source of atmospheric particles derived from
10
model analyses
A key consideration in evaluating any particle dynamics model is the sensitivity of the model to the description of the particle size distribution (Zhang et al., 1999). Indeed, reconciling the need for computational efficiency and adequate representation of the
PSD is a key factor for implementing particle dynamics within regional and global cli-15
mate models (Spracklen et al., 2006). A model sensitivity analysis to the size distri-bution discretization was conducted to define the optimum number of sections as a function of model performance and computational time (Table 5). The results show little sensitivity to the number of sections for higher number of sections (i.e. for simu-lations conducted using 300 sections rather than 250), hence 250 sections (over the 20
whole simulated range of diameters: i.e. between 3 nm and 10 µm) were selected to match the size resolution of the SMPS operated at MMSF and thus has 80 sections in the size range 3–105 nm). However, it is worthy of note that based on our sensi-tivity analyses it appears that model skill improves only slightly setting more than 80 bins, thus given the computational time required by 250 sections is around nine times 25
longer than assuming 80 sections, fewer than 250 sections may be used for longer term simulations.
ACPD
12, 11979–12021, 2012Evidence of an elevated source
P. Crippa et al.
Title Page
Abstract Introduction
Conclusions References
Tables Figures
◭ ◮
◭ ◮
Back Close
Full Screen / Esc
Printer-friendly Version Interactive Discussion
Discussion
P
a
per
|
Dis
cussion
P
a
per
|
Discussion
P
a
per
|
Discussio
n
P
a
per
|
When driven by measured sulfur dioxide concentrations and initialized using the ob-served PSD at midnight (LST) on each individual day, the UHMA model correctly sim-ulates the occurrence or absence of nucleation (Table 1). However, these simulations indicate a clear systematic under-prediction of the growth rate (Table 5 and Fig. 8) and typically an underestimation of nucleation intensity (Table 1). Further there is a marked 5
offset in the timing of the maximum concentration of particle numbers forDp=6−10 nm
(Table 5). There are a number of possible causes for these systematic biases since the simulated particle number concentrations are determined by the balance between for-mation processes (the nucleation rate scales with the square of sulfuric acid concentra-tions) and removal processes (dry deposition and condensational sink). The kinetic nu-10
cleation approach was identified to be the dominant nucleation mechanism and since the dry deposition algorithm has been reformulated according to a physically based data-constrained description, thus we examined three other possible causal mecha-nisms of these biases using model sensitivity analyses of:
– The initial particle loading. In order to investigate the model sensitivity to the ini-15
tial PSD, we ran a simulation wherein UHMA was initialized using the measured PSD on May 14 and then left to run for the entire 14 day period. A consistent underestimation of growth rates remained (cf. Fig. 9a and b). An additional set of simulations was performed initializing the model with a PSD representative of “clear” atmospheric conditions as described by Seigneur et al. (1986) (Table 6). 20
This idealized PSD is applied as being representative of the lower backscatter associated with the residual layer. When this idealized PSD is used to initialize the UHMA model, the simulated nucleation intensity shows better accord with the observations (Table 1) and event class A growth rates are closer to the ob-served values, although a small negative bias in GR remains (Fig. 10 and Ta-25
ground-ACPD
12, 11979–12021, 2012Evidence of an elevated source
P. Crippa et al.
Title Page
Abstract Introduction
Conclusions References
Tables Figures
◭ ◮
◭ ◮
Back Close
Full Screen / Esc
Printer-friendly Version Interactive Discussion
Discussion
P
a
per
|
Dis
cussion
P
a
per
|
Discussion
P
a
per
|
Discussio
n
P
a
per
|
based observing systems. However, initializing the model with clear atmospheric conditions also appears to overestimate formation rates during non-event days. Therefore we suggest that factors other than the initial particle loading may also play a major role in controlling nucleation occurrence.
– The availability of nucleation precursors. Since the kinetic approach assumes the 5
nucleation rate is dependent on the square of sulfuric acid concentrations, part of the underestimation of simulated growth rates may be attributed to the negative bias in simulated sulfuric acid concentrations (Fig. 11). In the simulations, [H2SO4] results from the reaction between sulfur dioxide measured close to the ground and photochemically produced OH. The chemical mechanism shows good skill 10
in simulating OH concentrations relative to observations. The simulated average peak concentration during event class A days is 4.21×106cm−3 compared to
the observed value of 4×106cm−3, whereas the average simulated maximum
[OH] during non-event days is 2.72×106cm−3, compared to measured value of
8×105 cm−3 (Pryor et al., 2011). Thus we speculate that the negative bias in
15
simulated [H2SO4] is due to a negative bias in SO2 concentrations due to their measurement below the forest canopy. To investigate if the systematic bias in [H2SO4] was responsible for a negative bias in simulated nucleation an empirical correction factor (derived by fitting modeled [H2SO4] to the observations, Fig. 11) was applied to the modeled values. Thus a simulation was conducted in which 20
the model was initialized each day using the observed PSD and the concentration of [H2SO4] was enhanced. Simulated growth rates are increased by an average factor of 1.2 and the agreement with observed values improved, but they remain consistently lower than those computed from both the clear case simulations and observations (Table 5). This underestimation of growth rates even with enhanced 25
[H2SO4] is also observed when the model is initialized on May and left to run for the entire 14 day period (Fig. 12a).
ACPD
12, 11979–12021, 2012Evidence of an elevated source
P. Crippa et al.
Title Page
Abstract Introduction
Conclusions References
Tables Figures
◭ ◮
◭ ◮
Back Close
Full Screen / Esc
Printer-friendly Version Interactive Discussion
Discussion
P
a
per
|
Dis
cussion
P
a
per
|
Discussion
P
a
per
|
Discussio
n
P
a
per
|
– Another factor regulating the availability of condensable vapors and the growth rate of ultrafine particles is the mass accommodation coefficient which describes
the probability of a gas molecule will stick to the pre-existing particles. Mass ac-commodation coefficient values lower than 1 may thus enhance the concentration
of condensable compounds available for nucleation hence reducing the influence 5
of the CS. When the mass accommodation coefficient was set to a value of 0.43
(based on work by P ¨oschl et al. (1998)), UHMA simulations indicate only a weak sensitivity to this parameter (Fig. 12b and Table 5).
4 Discussion and concluding remarks
In this study we provide independent evidence, both from observations and modeling 10
results, supporting the hypothesis of an elevated source of nucleation in the residual layer, as also advanced at other, mostly European, sites (Boulon et al., 2011; Pierce et al., 2011; Stratmann et al., 2003). Evidence in support of this postulate derived from observations at the MMSF site located in southern Indiana and thus within the polluted Ohio River Valley include:
15
– There is a clear relationship between the occurrence of elevated ultrafine particle concentrations and enhancement of turbulence intensity consistent with erosion of the nocturnal boundary layer and vertical transfer of recently nucleated particles (Fig. 4).
– The absence of a relationship between the near-surface condensational sink one 20
hour prior to the appearance of significant ultrafine particle concentrations and concentrations of sub 10-nm particles (Fig. 5). Based on backscatter data from a ceilometer, atmospheric conditions more favorable to new particle formation (i.e. lower CS) are found in the residual layer (Fig. 6).
– The primary distinction between event and non-event days, in terms of boundary 25
ACPD
12, 11979–12021, 2012Evidence of an elevated source
P. Crippa et al.
Title Page
Abstract Introduction
Conclusions References
Tables Figures
◭ ◮
◭ ◮
Back Close
Full Screen / Esc
Printer-friendly Version Interactive Discussion
Discussion
P
a
per
|
Dis
cussion
P
a
per
|
Discussion
P
a
per
|
Discussio
n
P
a
per
|
days which is always eroded by the time of nucleation observation in the surface layer (Fig. 6g). This modeling evidence strongly supports the hypothesis of new particles formed in the residual layer and then mixed down to the surface layer with the erosion of the nocturnal inversion.
– The low ratio between 3 nm and 6 nm particle number concentrations measured 5
in the near-surface layer at the MMSF site may be the result of an early aging of freshly nucleated particles before detection during their advection from higher atmospheric levels to the mixed layer.
Model sensitivity analyses indicate nucleation rates appear to be highly dependent on the PSD used to initialize the simulations with generally lower sensitivity to H2SO4 10
availability, the mass accommodation coefficient and the number of sections used to
represent the PSD. Thus results from the UHMA simulations that also support the postulate that nucleation is not occurring in the near-surface layer include the following:
– The base case simulations with UHMA, driven by the PSD measured at 46 m and sulfur dioxide concentrations measured close to the surface, indicate consis-15
tent underestimation of nucleation intensities and growth rates (Figs. 8, 9 and 10, and Tables 1 and 5). Higher agreement between observed and simulated PSD is obtained when the initial PSD is set to conditions representative of clear at-mospheric conditions (Fig. 10b) and when higher sulfuric acid concentrations are applied (Fig. 12a). Both of these conditions may be found at higher levels in the 20
atmosphere and thus lead us to infer that nucleation is initiated aloft and the newly formed particles are then mixed downward with the breaking of the residual layer and formation of the convective boundary layer (Pierce et al., 2011; Stratmann et al., 2003; Wehner et al., 2010).
– Simulated peak number concentrations in the size range of 6-10 nm exhibit a pos-25
itive bias compared to observations both in the case of the initialization with the observed PSD and with clear atmospheric conditions. However, the time at which
ACPD
12, 11979–12021, 2012Evidence of an elevated source
P. Crippa et al.
Title Page
Abstract Introduction
Conclusions References
Tables Figures
◭ ◮
◭ ◮
Back Close
Full Screen / Esc
Printer-friendly Version Interactive Discussion
Discussion
P
a
per
|
Dis
cussion
P
a
per
|
Discussion
P
a
per
|
Discussio
n
P
a
per
|
this peak occurs is on average shifted towards an earlier nucleation start when as-suming clear atmospheric conditions. This result supports our hypothesis of new particles formed aloft (e.g. in the residual layer), then mixed down and diluted with the formation of the mixed layer (thus also explaining the slightly lower observed nucleation intensities compared to simulated values). The greatest temporal gra-5
dient (i.e. rate change) of 6–10 nm particle number concentrations occurs in the hour prior to the maximum in near-surface observations which is also consistent with the postulate that nucleation occurs aloft and also implies an essential role for boundary layer dynamics in observations of elevated ultrafine particle concen-trations in the surface layer.
10
Although the postulates and findings advanced here cannot be considered conclusive, they are consistent with prior research that has indicated that new particle formation likely occurs principally at or close to the residual layer (or free troposphere) (Boulon et al., 2011; Lauros et al., 2011; Pierce et al., 2011; Stratmann et al., 2003; Wehner et al., 2010). Given the key role played by boundary layer dynamics and the location of the 15
capping inversion in dictating the occurrence of high particle concentrations near the surface, findings from this study may provide insights for the vertical resolution required by regional models to adequately represent aerosol dynamics.
Acknowledgements. This research was funded by grants to SCP from NSF (0544745 and 1102309). Some of the meteorological data used herein were collected under funding from
20
the Office of Science (BER), U.S. Department of Energy, grant DE-FG02-07ER64371.
Ad-ditional funding from the IU Pervasive Technology Institute. Thanks to B. Plale (IU) and A. Rossner (Clarkson). TP acknowledges funding from Academy of Finland (139656). Jim Smith is acknowledged for providing the SO2instrument. Lee Mauldin and Joshua McGrath are
ac-knowledged for setting up and operating the CIMS instrument.
ACPD
12, 11979–12021, 2012Evidence of an elevated source
P. Crippa et al.
Title Page
Abstract Introduction
Conclusions References
Tables Figures
◭ ◮
◭ ◮
Back Close
Full Screen / Esc
Printer-friendly Version Interactive Discussion
Discussion
P
a
per
|
Dis
cussion
P
a
per
|
Discussion
P
a
per
|
Discussio
n
P
a
per
|
References
Birmili, W. and Wiedensohler, A.: New particle formation in the continental boundary layer: Meteorological and gas phase parameter influence, Geophys. Res. Lett., 27, 3325–3328, doi:10.1029/1999gl011221, 2000.
Boulon, J., Sellegri, K., Hervo, M., Picard, D., Pichon, J.-M., Fr ´eville, P., and Laj, P.: Investigation
5
of nucleation events vertical extent: a long term study at two different altitude sites, Atmos.
Chem. Phys., 11, 5625–5639, doi:10.5194/acp-11-5625-2011, 2011.
Boy, M. and Kulmala, M.: Nucleation events in the continental boundary layer: Influence of physical and meteorological parameters, Atmos. Chem. Phys., 2, 1–16, doi:10.5194/acp-2-1-2002, 2002.
10
Boy, M., Kulmala, M., Ruuskanen, T. M., Pihlatie, M., Reissell, A., Aalto, P. P., Keronen, P., Dal Maso, M., Hellen, H., Hakola, H., Jansson, R., Hanke, M., and Arnold, F.: Sulphuric acid closure and contribution to nucleation mode particle growth, Atmos. Chem. Phys., 5, 863– 878, doi:10.5194/acp-5-863-2005, 2005.
Boy, M., Hellmuth, O., Korhonen, H., Nilsson, E. D., ReVelle, D., Turnipseed, A., Arnold, F.,
15
and Kulmala, M.: Malte – model to predict new aerosol formation in the lower troposphere, Atmos. Chem. Phys., 6, 4499–4517, doi:10.5194/acp-6-4499-2006, 2006.
Crumeyrolle, S., Manninen, H. E., Sellegri, K., Roberts, G., Gomes, L., Kulmala, M., Weigel, R., Laj, P., and Schwarzenboeck, A.: New particle formation events measured on board the atr-42 aircraft during the eucaari campaign, Atmos. Chem. Phys., 10, 6721–6735,
20
doi:10.5194/acp-10-6721-2010, 2010.
Dal Maso, M., Kulmala, M., Lehtinen, K. E. J., Makela, J. M., Aalto, P., and O’Dowd, C. D.: Condensation and coagulation sinks and formation of nucleation mode parti-cles in coastal and boreal forest boundary layers, J. Geophys. Res.-Atmos., 107, 8097, doi:10.1029/2001jd001053, 2002.
25
Eisele, F. L. and Tanner, D. J.: Measurement of the gas-phase concentration of H2SO4 and
methane sulphonic-acid and estimates of H2SO4 production and loss in the atmosphere, J. Geophys. Res., 98, 9001–9010, 1993.
Griffin, R. J., Nguyen, K., Dabdub, D., and Seinfeld, J. H.: A coupled hydrophobic-hydrophilic
model for predicting secondary organic aerosol formation, J. Atmos. Chem., 44, 171–190,
30
doi:10.1023/a:1022436813699, 2003.
ACPD
12, 11979–12021, 2012Evidence of an elevated source
P. Crippa et al.
Title Page
Abstract Introduction
Conclusions References
Tables Figures
◭ ◮
◭ ◮
Back Close
Full Screen / Esc
Printer-friendly Version Interactive Discussion
Discussion
P
a
per
|
Dis
cussion
P
a
per
|
Discussion
P
a
per
|
Discussio
n
P
a
per
|
Grosjean, D.: In situ organic aerosol formation during a smog episode: Estimated production and chemical functionality, Atmos. Environ., 26, 953–963, doi:10.1016/0960-1686(92)90027-i, 1992.
Hertel, O., Berkowicz, R., Christensen, J., and Hov, O.: Test of two numerical schemes for use in atmospheric transport-chemistry models, Atmos. Environ., 27, 2591–2611,
5
doi:10.1016/0960-1686(93)90032-t, 1993.
Hu, X.-M., Nielsen-Gammon, J. W., and Zhang, F.: Evaluation of three planetary bound-ary layer schemes in the wrf model, J. Appl. Meteorol. Clim., 49, 1831–1844, doi:10.1175/2010jamc2432.1, 2010.
Jacobson, M. Z. and Turco, R. P.: Simulating condensational growth, evaporation, and
coagu-10
lation of aerosols using a combined moving and stationary size grid, Aerosol. Sci. Tech., 22, 73–92, doi:10.1080/02786829408959729, 1995.
Korhonen, H., Lehtinen, K. E. J., and Kulmala, M.: Multicomponent aerosol dynamics model uhma: Model development and validation, Atmos. Chem. Phys., 4, 757–771, doi:10.5194/acp-4-757-2004, 2004.
15
Kuang, C., McMurry, P. H., McCormick, A. V., and Eisele, F. L.: Dependence of nucleation rates on sulfuric acid vapor concentration in diverse atmospheric locations, J. Geophys. Res.-Atmos., 113, D10209, doi:10.1029/2007jd009253, 2008.
Kulmala, M., Dal Maso, M., Makela, J. M., Pirjola, L., Vakeva, M., Aalto, P., Miikkulainen, P., Hameri, K., and O’Dowd, C. D.: On the formation, growth and composition of nucleation
20
mode particles, Tellus B, 53, 479–490, doi:10.1034/j.1600-0889.2001.530411.x, 2001. Kulmala, M., Asmi, A., Lappalainen, H. K., Baltensperger, U., Brenguier, J. L., Facchini, M. C.,
Hansson, H. C., Hov, Ø., O’Dowd, C. D., P ¨oschl, U., Wiedensohler, A., Boers, R., Boucher, O., de Leeuw, G., Denier van den Gon, H., Feichter, J., Krejci, R., Laj, P., Lihavainen, H., Lohmann, U., McFiggans, G., Mentel, T., Pilinis, C., Riipinen, I., Schulz, M., Stohl, A.,
Swi-25
etlicki, E., Vignati, E., Amann, M., Alves, C., Arabas, S., Artaxo, P., Beddows, D. C. S., Bergstr ¨om, R., Beukes, J. P., Bilde, M., Burkhart, J. F., Canonaco, F., Clegg, S., Coe, H., Crumeyrolle, S., D’Anna, B., Decesari, S., Gilardoni, S., Fischer, M., Fjæra, A. M., Foun-toukis, C., George, C., Gomes, L., Halloran, P., Hamburger, T., Harrison, R. M., Herrmann, H., Hoffmann, T., Hoose, C., Hu, M., H ˜orrak, U., Iinuma, Y., Iversen, T., Josipovic, M.,
Kanaki-30
Ne-ACPD
12, 11979–12021, 2012Evidence of an elevated source
P. Crippa et al.
Title Page
Abstract Introduction
Conclusions References
Tables Figures
◭ ◮
◭ ◮
Back Close
Full Screen / Esc
Printer-friendly Version Interactive Discussion
Discussion
P
a
per
|
Dis
cussion
P
a
per
|
Discussion
P
a
per
|
Discussio
n
P
a
per
|
mitz, E., O’Donnell, D., Panwar, T. S., Pawlowska, H., Petzold, A., Pienaar, J. J., Pio, C., Plass-Duelmer, C., Pr ´ev ˆot, A. S. H., Pryor, S., Reddington, C. L., Roberts, G., Rosenfeld, D., Schwarz, J., Seland, Ø., Sellegri, K., Shen, X. J., Shiraiwa, M., Siebert, H., Sierau, B., Simpson, D., Sun, J. Y., Topping, D., Tunved, P., Vaattovaara, P., Vakkari, V., Veefkind, J. P., Visschedijk, A., Vuollekoski, H., Vuolo, R., Wehner, B., Wildt, J., Woodward, S., Worsnop,
5
D. R., van Zadelhoff, G. J., Zardini, A. A., Zhang, K., van Zyl, P. G., Kerminen, V. M., S.
Carslaw, K., and Pandis, S. N.: General overview: European Integrated project on Aerosol Cloud Climate and Air Quality interactions (EUCAARI) – integrating aerosol research from nano to global scales, Atmos. Chem. Phys., 11, 13061–13143, doi:10.5194/acp-11-13061-2011, 2011.
10
Lauros, J., Sogachev, A., Smolander, S., Vuollekoski, H., Sihto, S. L., Mammarella, I., Laakso, L., Rannik, U., and Boy, M.: Particle concentration and flux dynamics in the atmospheric boundary layer as the indicator of formation mechanism, Atmos. Chem. Phys., 11, 5591– 5601, doi:10.5194/acp-11-5591-2011, 2011.
Mauldin, R. L., Cantrell, C. A., Zondlo, M. A., Kosciuch, E., Ridley, B. A., Weber, R.,
15
and Eisele, F. E.: Measurements of OH, H2SO4, and MSA during tropospheric ozone
production about the spring equinox (TOPSE), J. Geophys. Res.-Atmos., 108, 8366, doi:10.1029/2002jd002295, 2003.
Nilsson, E. D., Rannik, U., Kulmala, M., Buzorius, G., and O’Dowd, C. D.: Effects of
continen-tal boundary layer evolution, convection, turbulence and entrainment, on aerosol formation,
20
Tellus B, 53, 441–461, doi:10.1034/j.1600-0889.2001.530409.x, 2001.
Pet ¨aj ¨a, T., Mauldin, III, R. L., Kosciuch, E., McGrath, J., Nieminen, T., Paasonen, P., Boy, M., Adamov, A., Kotiaho, T., and Kulmala, M.: Sulfuric acid and OH concentrations in a boreal forest site, Atmos. Chem. Phys., 9, 7435–7448, doi:10.5194/acp-9-7435-2009, 2009. Pierce, J. R., Leaitch, W. R., Liggio, J., Westervelt, D. M., Wainwright, C. D., Abbatt, J. P. D.,
25
Ahlm, L., Al-Basheer, W., Cziczo, D. J., Hayden, K. L., Lee, A. K. Y., Li, S.-M., Russell, L. M., Sjostedt, S. J., Strawbridge, K. B., Travis, M., Vlasenko, A., Wentzell, J. J. B., Wiebe, H. A., Wong, J. P. S., and Macdonald, A. M.: Nucleation and condensational growth to CCN sizes during a sustained pristine biogenic SOA event in a forested mountain valley, Atmos. Chem. Phys., 12, 3147–3163, doi:10.5194/acp-12-3147-2012, 2012.
30
P ¨oschl, U., Canagaratna, M., Jayne, J. T., Molina, L. T., Worsnop, D. R., Kolb, C. E., and Molina, M. J.: Mass accommodation coefficient of H
2SO4vapor on aqueous sulfuric acid surfaces and
ACPD
12, 11979–12021, 2012Evidence of an elevated source
P. Crippa et al.
Title Page
Abstract Introduction
Conclusions References
Tables Figures
◭ ◮
◭ ◮
Back Close
Full Screen / Esc
Printer-friendly Version Interactive Discussion
Discussion
P
a
per
|
Dis
cussion
P
a
per
|
Discussion
P
a
per
|
Discussio
n
P
a
per
|
gaseous diffusion coefficient of H
2SO4in N2/H2O, T. Phys. Chem. Ser., 102, 10082–10089,
doi:10.1021/jp982809s, 1998.
Pryor, S. C. and Binkowski, F. S.: An analysis of the time scales associated with aerosol processes during dry deposition, Aerosol Sci. Tech., 38, 1091–1098, doi:10.1080/027868290885827, 2004.
5
Pryor, S. C., Barthelmie, R. J., Spaulding, A. M., Larsen, S. E., and Petroff, A.:
Size-resolved fluxes of sub-100-nm particles over forests, J. Geophys. Res., 114, 1–12, D18212, 10.1029/2009jd012248, 2009.
Pryor, S. C., Spaulding, A. M., and Barthelmie, R. J.: New particle formation in the midwestern USA: Event characteristics, meteorological context and vertical profiles, Atmos. Environ., 44,
10
4413–4425, doi:10.1016/j.atmosenv.2010.07.045, 2010.
Pryor, S. C., Barthelmie, R. J., Sørrensen, L. L., McGrath, J. G., Hopke, P., and Pet ¨aj ¨a, T.: Spa-tial and vertical extent of nucleation events in the Midwestern USA: insights from the Nucle-ation In ForesTs (NIFTy) experiment, Atmos. Chem. Phys., 11, 1641–1657, doi:10.5194/acp-11-1641-2011, 2011.
15
Rannik, U., Aalto, P., Keronen, P., Vesala, T., and Kulmala, M.: Interpretation of aerosol particle fluxes over a pine forest: Dry deposition and random errors, J. Geophys. Res., 108, 4544, doi:10.1029/2003jd003542, 2003.
Seigneur, C., Hudischewskyj, A. B., Seinfeld, J. H., Whitby, K. T., Whitby, E. R., Brock, J. R., and Barnes, H. M.: Simulation of aerosol dynamics – a comparative review of mathematical
20
models, Aerosol Sci. Technol., 5, 205–222, doi:10.1080/02786828608959088, 1986. Seinfeld, J. H. and Pandis, S. N.: Atmospheric chemistry and physics – from air pollution to
climate change (2nd Edn.), John Wiley & Sons, 2006.
Sihto, S. L., Kulmala, M., Kerminen, V. M., Dal Maso, M., Pet ¨aj ¨a, T., Riipinen, I., Korhonen, H., Arnold, F., Janson, R., Boy, M., Laaksonen, A., and Lehtinen, K. E. J.: Atmospheric
sul-25
phuric acid and aerosol formation: Implications from atmospheric measurements for nucle-ation and early growth mechanisms, Atmos. Chem. Phys., 6, 4079–4091, doi:10.5194/acp-6-4079-2006, 2006.
Sihto, S.-L., Vuollekoski, H., Lepp ¨a, J., Riipinen, I., Kerminen, V.-M., Korhonen, H., Lehtinen, K. E. J., Boy, M., and Kulmala, M.: Aerosol dynamics simulations on the connection of sulphuric
30
ACPD
12, 11979–12021, 2012Evidence of an elevated source
P. Crippa et al.
Title Page
Abstract Introduction
Conclusions References
Tables Figures
◭ ◮
◭ ◮
Back Close
Full Screen / Esc
Printer-friendly Version Interactive Discussion
Discussion
P
a
per
|
Dis
cussion
P
a
per
|
Discussion
P
a
per
|
Discussio
n
P
a
per
|
Simpson, D., Olendrzynski, K., Semb, A., Støren, E., and Unger, S.: Photochemical oxidant modelling in Europe; multi-annual modelling and source-receptor relationships, EMEP/MSC-W3/97, 1997.
Skamarock, W. C., Klemp, J. B., Dudhia, J., Gill, D. O., Barker, D. M., Duda, M. G., Huang, X.-Y., Wang, W., Powers, J. G., and Mesoscale: A description of the advanced research WRF
5
version 3, National Center for Atmospheric Research, Boulder, Colorado, USA, 2008. Slinn, W. G. N.: Predictions for particle deposition to vegetative canopies, Atmos. Environ., 16,
1785–1794, doi:10.1016/0004-6981(82)90271-2, 1982.
Spracklen, D. V., Pringle, K. J., Carslaw, K. S., Chipperfield, M. P., and Mann, G. W.: A global off-line model of size-resolved aerosol microphysics: I. Model development and prediction
10
of aerosol properties, Atmos. Chem. Phys., 5, 2227–2252, doi:10.5194/acp-5-2227-2005, 2005.
Spracklen, D. V., Carslaw, K. S., Kulmala, M., Kerminen, V. M., Mann, G. W., and Sihto, S. L.: The contribution of boundary layer nucleation events to total particle concentrations on regional and global scales, Atmos. Chem. Phys., 6, 5631–5648,
doi:10.5194/acp-6-5631-15
2006, 2006.
Stratmann, F., Siebert, H., Spindler, G., Wehner, B., Althausen, D., Heintzenberg, J., Hellmuth, O., Rinke, R., Schmieder, U., Seidel, C., Tuch, T., Uhrner, U., Wiedensohler, A., Wandinger, U., Wendisch, M., Schell, D., and Stohl, A.: New-particle formation events in a continental boundary layer: First results from the saturn experiment, Atmos. Chem. Phys., 3, 1445–
20
1459, doi:10.5194/acp-3-1445-2003, 2003.
Wehner, B., Siebert, H., Stratmann, F., Tuch, T., Wiedensohler, A., Petaja, T., Dal Maso, M., and Kulmala, M.: Horizontal homogeneity and vertical extent of new particle formation events, Tellus B, 59, 362–371, doi:10.1111/j.1600-0889.2007.00260.x, 2007.
Wehner, B., Siebert, H., Ansmann, A., Ditas, F., Seifert, P., Stratmann, F., Wiedensohler, A.,
25
Apituley, A., Shaw, R. A., Manninen, H. E., and Kulmala, M.: Observations of turbulence-induced new particle formation in the residual layer, Atmos. Chem. Phys., 10, 4319–4330, doi:10.5194/acp-10-4319-2010, 2010.
Zhang, Y., Seigneur, C., Seinfeld, J. H., Jacobson, M. Z., and Binkowski, F. S.: Simulation of aerosol dynamics: A comparative review of algorithms used in air quality models, Aerosol
30
Sci. Tech., 31, 487–514, doi:10.1080/027868299304039, 1999.
ACPD
12, 11979–12021, 2012Evidence of an elevated source
P. Crippa et al.
Title Page
Abstract Introduction
Conclusions References
Tables Figures
◭ ◮
◭ ◮
Back Close
Full Screen / Esc
Printer-friendly Version Interactive Discussion
Discussion
P
a
per
|
Dis
cussion
P
a
per
|
Discussion
P
a
per
|
Discussio
n
P
a
per
|
Zhang, Y., Liu, P., Liu, X.-H., Jacobson, M. Z., McMurry, P. H., Yu, F., Yu, S., and Schere, K. L.: A comparative study of nucleation parameterizations: 2. Three-dimensional model application and evaluation, J. Geophys. Res., 115, D20213, doi:10.1029/2010jd014151, 2010a.
Zhang, Y., McMurry, P. H., Yu, F., and Jacobson, M. Z.: A comparative study of nucleation parameterizations: 1. Examination and evaluation of the formulations, J. Geophys. Res., 115,
5
ACPD
12, 11979–12021, 2012Evidence of an elevated source
P. Crippa et al.
Title Page
Abstract Introduction
Conclusions References
Tables Figures
◭ ◮
◭ ◮
Back Close
Full Screen / Esc
Printer-friendly Version Interactive Discussion
Discussion
P
a
per
|
Dis
cussion
P
a
per
|
Discussion
P
a
per
|
Discussio
n
P
a
per
|
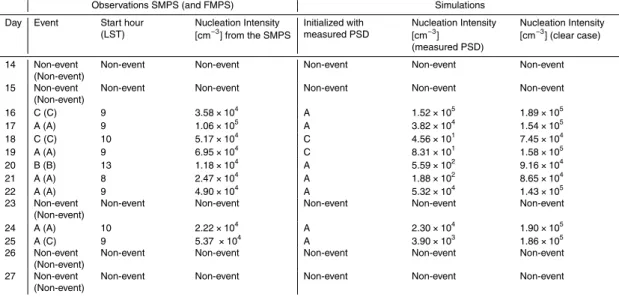
Table 1.Classification of event days at the MMSF site during the NIFTy experiment for 14–27
May based on the subjective classification of (Boy and Kulmala, 2002). The hour of maximum rate change of 10 nm particle concentrations (start hour) is provided in local standard time (LST). Observed nucleation intensities [cm−3], computed as the number of particles with
di-ameter between 10 and 30 nm in the two hours of highest concentration, are shown in the 4th column. The final three columns show model simulation results setting 250 sections and initializing the model with the measured particle size distribution (measured PSD) and clear at-mospheric conditions (clear case) wherein the PSD is as described by (Seigneur et al., 1986).
Observations SMPS (and FMPS) Simulations
Day Event Start hour (LST)
Nucleation Intensity [cm−3] from the SMPS
Initialized with measured PSD
Nucleation Intensity [cm−3]
(measured PSD)
Nucleation Intensity [cm−3] (clear case)
14 Non-event (Non-event)
Non-event Non-event Non-event Non-event Non-event
15 Non-event (Non-event)
Non-event Non-event Non-event Non-event Non-event
16 C (C) 9 3.58×10⁴ A 1.52×10⁵ 1.89×10⁵ 17 A (A) 9 1.06×10⁵ A 3.82×10⁴ 1.54×10⁵ 18 C (C) 10 5.17×10⁴ C 4.56×101 7.45×10⁴
19 A (A) 9 6.95×10⁴ C 8.31×101 1.58×10⁵
20 B (B) 13 1.18×10⁴ A 5.59×10² 9.16×10⁴
21 A (A) 8 2.47×10⁴ A 1.88×10² 8.65×10⁴
22 A (A) 9 4.90×10⁴ A 5.32×10⁴ 1.43×10⁵
23 Non-event (Non-event)
Non-event Non-event Non-event Non-event Non-event
24 A (A) 10 2.22×10⁴ A 2.30×10⁴ 1.90×10⁵
25 A (C) 9 5.37×10⁴ A 3.90×10³ 1.86×10⁵
26 Non-event (Non-event)
Non-event Non-event Non-event Non-event Non-event
27 Non-event (Non-event)
Non-event Non-event Non-event Non-event Non-event
ACPD
12, 11979–12021, 2012Evidence of an elevated source
P. Crippa et al.
Title Page
Abstract Introduction
Conclusions References
Tables Figures
◭ ◮
◭ ◮
Back Close
Full Screen / Esc
Printer-friendly Version Interactive Discussion
Discussion
P
a
per
|
Dis
cussion
P
a
per
|
Discussion
P
a
per
|
Discussio
n
P
a
per
|
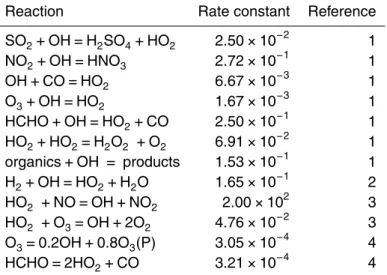
Table 2.Chemical reactions implemented within the UHMA model (Reference 1 =Hertel et
al. (1993), 2=Boy et al. (2006), 3=Seinfeld and Pandis (2006), 4=Simpson et al. (1997)).
Second order rate constants are expressed in [ppb−1s−1] for a temperature of 298K. Photolysis
rate constants are expressed in s−1and computed asJ=l
×(cosΘ)m×e−n×secΘwhereinΘis
the solar zenith angle. Typical peak values of photolysis rate constants for the MMSF site during a clear sky day in May are reported.
Reaction Rate constant Reference
SO2+OH=H2SO4+HO2 2.50×10− 2
1 NO2+OH=HNO3 2.72×10−
1
1 OH+CO=HO
2 6.67×10−
3
1 O3+OH=HO2 1.67×10−
3
1 HCHO+OH=HO
2+CO 2.50×10−
1
1 HO2+HO2=H2O2 +O2 6.91×10−
2
1 organics+OH = products 1.53×10⁻¹ 1
H2+OH=HO2+H2O 1.65×10− 1
2 HO2 +NO=OH+NO2 2.00×10
2
3 HO2 +O3=OH+2O2 4.76×10−
2
3 O3=0.2OH+0.8O3(P) 3.05×10−
4
4 HCHO=2HO
2+CO 3.21×10−
4
ACPD
12, 11979–12021, 2012Evidence of an elevated source
P. Crippa et al.
Title Page
Abstract Introduction
Conclusions References
Tables Figures
◭ ◮
◭ ◮
Back Close
Full Screen / Esc
Printer-friendly Version Interactive Discussion
Discussion
P
a
per
|
Dis
cussion
P
a
per
|
Discussion
P
a
per
|
Discussio
n
P
a
per
|
Table 3. Input concentrations [ppb] to the chemical mechanism based on Boy and
Kul-mala (2002) and typical spring values measured in Southern Indiana by the Indiana Department of Environmental Management.
Compound Concentration [ppb]
O3 30
NO2 5
NO 2.5
CO 800
HCHO 10
CH4 1900
H2 500
HO2 3.7×10⁻³
ACPD
12, 11979–12021, 2012Evidence of an elevated source
P. Crippa et al.
Title Page
Abstract Introduction
Conclusions References
Tables Figures
◭ ◮
◭ ◮
Back Close
Full Screen / Esc
Printer-friendly Version Interactive Discussion
Discussion
P
a
per
|
Dis
cussion
P
a
per
|
Discussion
P
a
per
|
Discussio
n
P
a
per
|
Table 4.Physics schemes (Skamarock et al., 2008) adopted for the WRF simulations.
Physics option Adopted scheme
Microphysics WRF Single-Moment 6-class
Longwave Radiation Rapid Radiative Transfer Model (RRTM) Shortwave Radiation Dudhia
Surface layer Eta
Land Surface Noah Land Surface Model Planetary boundary
layer
Mellor-Yamada-Janjic
Cumulus
parameterizations
![Table 3. Input concentrations [ppb] to the chemical mechanism based on Boy and Kul- Kul-mala (2002) and typical spring values measured in Southern Indiana by the Indiana Department of Environmental Management](https://thumb-eu.123doks.com/thumbv2/123dok_br/16397655.193249/28.918.682.895.76.667/concentrations-chemical-mechanism-southern-indiana-department-environmental-management.webp)
![Table 5. Measured and simulated growth rates [nm h −1 ] for class A events. Column 1 indicates the day in May 2008, column 2 the observed growth rates (GR) and column 3 shows simu-lated GR computed initializing the model with clear atmospheric conditions](https://thumb-eu.123doks.com/thumbv2/123dok_br/16397655.193249/30.918.47.659.364.518/measured-simulated-indicates-observed-computed-initializing-atmospheric-conditions.webp)
![Table 6. Initial conditions of geometric mean diameter [µm], standard deviation and number concentration [cm −3 ] for each mode of the PSD associated with clear atmospheric conditions and the average of observed PSD from the FMPS measurements.](https://thumb-eu.123doks.com/thumbv2/123dok_br/16397655.193249/31.918.43.656.309.427/conditions-geometric-deviation-concentration-associated-atmospheric-conditions-measurements.webp)
![Fig. 1. Relationship between the base 10 logarithm of sulfuric acid concentrations [cm −3 ] and the base 10 logarithm of the nucleation rate of 1 nm particles [cm −3 s −1 ] during nucleation hours of class A events](https://thumb-eu.123doks.com/thumbv2/123dok_br/16397655.193249/32.918.103.596.78.471/relationship-logarithm-sulfuric-concentrations-logarithm-nucleation-particles-nucleation.webp)