ACPD
14, 2553–2599, 2014Assimilation of atmospheric CH4
products
S. Massart et al.
Title Page
Abstract Introduction
Conclusions References
Tables Figures
◭ ◮
◭ ◮
Back Close
Full Screen / Esc
Printer-friendly Version
Interactive Discussion
Discussion
P
a
per
|
D
iscussion
P
a
per
|
Discussion
P
a
per
|
Discuss
ion
P
a
per
|
Atmos. Chem. Phys. Discuss., 14, 2553–2599, 2014 www.atmos-chem-phys-discuss.net/14/2553/2014/ doi:10.5194/acpd-14-2553-2014
© Author(s) 2014. CC Attribution 3.0 License.
Atmospheric Chemistry and Physics
Open Access
Discussions
This discussion paper is/has been under review for the journal Atmospheric Chemistry and Physics (ACP). Please refer to the corresponding final paper in ACP if available.
Assimilation of atmospheric methane
products in the MACC-II system: from
SCIAMACHY to TANSO and IASI
S. Massart1, A. Agusti-Panareda1, I. Aben2, A. Butz3, F. Chevallier4, C. Crevosier5, R. Engelen1, C. Frankenberg6, and O. Hasekamp2
1
European Centre for Medium-Range Weather Forecasts, Reading, UK 2
SRON Netherlands Institute for Space Research, Utrecht, the Netherlands 3
Karlsruhe Institute of Technology, Karlsruhe, Germany 4
Laboratoire des Sciences du Climat et de l’Environnement, CEA-CNRS-UVSQ, UMR8212, IPSL, Gif-sur-Yvette, France
5
Laboratoire de Météorologie Dynamique/IPSL/CNRS, Ecole Polytechnique, Palaiseau, France
6
Jet Propulsion Laboratory, Pasadena, USA
Received: 2 December 2013 – Accepted: 10 January 2014 – Published: 27 January 2014
Correspondence to: S. Massart ([email protected])
ACPD
14, 2553–2599, 2014Assimilation of atmospheric CH4
products
S. Massart et al.
Title Page
Abstract Introduction
Conclusions References
Tables Figures
◭ ◮
◭ ◮
Back Close
Full Screen / Esc
Printer-friendly Version
Interactive Discussion
Discussion
P
a
per
|
D
iscussion
P
a
per
|
Discussion
P
a
per
|
Discuss
ion
P
a
per
|
Abstract
The Monitoring Atmospheric Composition and Climate Interim Implementation (MACC-II) delayed-mode (DM) system has been producing an atmospheric methane (CH4)
analysis 6 months behind real time since June 2009. This analysis used to rely on the assimilation of the CH4 product from the SCanning Imaging Absorption spectroMeter
5
for Atmospheric CHartographY (SCIAMACHY) instrument on board Envisat. Recently
the Laboratoire de Météorologie Dynamique (LMD) CH4 products from the Infrared
Atmospheric Sounding Interferometer (IASI) and the SRON Netherlands Institute for Space Research CH4products from the Thermal And Near-infrared Sensor for carbon
Observation (TANSO) were added to the DM system. With the loss of Envisat in April
10
2012, the DM system has to now rely on the assimilation of methane data from TANSO and IASI. This paper documents the impact of this change in the observing system on the methane tropospheric analysis. It is based on four experiments: one free run and three analyses from respectively the assimilation of SCIAMACHY, TANSO and a combination of TANSO and IASI CH4products in the MACC-II system. The period
be-15
tween December 2010 and April 2012 is studied. This corresponds to a period during which the performance of SCIAMACHY was deteriorating. The SCIAMACHY exper-iment globally underestimates the tropospheric methane by 35 part per billion (ppb) compared to the HIAPER Pole-to-Pole Observations (HIPPO) data and the methane column by 23 ppb compared the Total Carbon Column Observing Network (TCCON)
20
data, when the global bias of the free run against the same HIPPO and TCCON data is respectively−5 ppb and 4 ppb. The assimilated TANSO product changed in October
2011 from version v.1 to version v.2.0. The analysis of version v.1 globally underes-timates the tropospheric methane by 18 ppb compared to the HIPPO data and the column by 11 ppb compared to the TCCON data. In contrast, the analysis of version
25
ACPD
14, 2553–2599, 2014Assimilation of atmospheric CH4
products
S. Massart et al.
Title Page
Abstract Introduction
Conclusions References
Tables Figures
◭ ◮
◭ ◮
Back Close
Full Screen / Esc
Printer-friendly Version
Interactive Discussion
Discussion
P
a
per
|
D
iscussion
P
a
per
|
Discussion
P
a
per
|
Discuss
ion
P
a
per
|
data. In the meantime, this IASI plus TANSO analysis presents the worst correlation with the HIPPO data. In terms of column, the addition of the IASI data to the version v.2.0 of the TANSO data has a significant impact, mainly over extratropical regions, reducing the global bias to 6 ppb. The analysis based on the assimilation of the combi-nation of TANSO and IASI products as well as the SCIAMACHY analysis should
never-5
theless be used with caution when looking at the seasonal cycle or inter-hemispheric gradient because of the unavailability of the measurements over large regions during the local winter period.
1 Introduction
Methane (CH4) is well-known to be the third most important greenhouse gas in the
10
atmosphere (after water vapour and CO2), accounting for 20 % of the enhanced
green-house effect (Forster et al., 2007). It also plays a key role in the tropospheric chemistry and therefore in air quality issues through the oxidation by hydroxide (OH) radicals. Its impact is nowadays of great concern as levels of CH4 substantially increase since
the pre-industrial period. As an example, atmospheric CH4 concentrations reached
15
1813±2 parts per billion (ppb) in 2011 (WMO, 2012) whereas they varied between
350 and 850 ppb over the past 650 000 yr (Spahni et al., 2005). Etheridge et al. (1992) show that the increase was exponential between 1850 and the late 1970s with values starting from 830 ppb and reaching 1500 ppb. Their study is based on reconstruction of atmospheric CH4mixing ratio from air trapped in polar ice cores and compacted snow.
20
Keeping track of the evolution of atmospheric CH4became easier since the early 1980s
with the development of surface-based networks that directly measure CH4 in the
at-mosphere. Since then the networks have improved with increasing coverage and with inter calibration. The analysis of the collected data from these networks allowed for example Kirschke et al. (2013) to estimate the changes in the global growth rate of
25
annual atmospheric CH4 concentration since 1980. They show in particular that the CH4 atmospheric growth rate was estimated to more than 10 ppb yr−
1
ACPD
14, 2553–2599, 2014Assimilation of atmospheric CH4
products
S. Massart et al.
Title Page
Abstract Introduction
Conclusions References
Tables Figures
◭ ◮
◭ ◮
Back Close
Full Screen / Esc
Printer-friendly Version
Interactive Discussion
Discussion
P
a
per
|
D
iscussion
P
a
per
|
Discussion
P
a
per
|
Discuss
ion
P
a
per
|
less than zero in 2001, 2004 and 2005. Since 2006, the growth rate has started to increase again. The annual growth rate as well as its internal variability have moreover strong regional variation as shown by Dlugokencky et al. (2009). This argues for the continuous global monitoring of the atmospheric CH4. As well as from the surface net-works, the monitoring can more recently benefit from remotely sensed measurements
5
of atmospheric CH4columns retrieved from the surface or from space.
Observation of CH4 and other greenhouse gases from space is relatively recent compared to the observation of other minor constituents of the atmosphere. Monitoring atmospheric composition from space started with ozone in 1978 when the Nimbus 7 satellite was launched. Nimbus 7 carried the first Total Ozone Mapping Spectrometer
10
(TOMS) instrument that helped to confirm the Antarctic ozone hole discovered by Joe Farman and colleagues in the early 1980s (Farman et al., 1985). TOMS has since then flown on several other satellites and almost continuously monitored the atmospheric ozone column (McPeters and Labow, 1996). TOMS was the precursor of a new gener-ation of instruments launched since the mid-nineties. Among these instruments some
15
were designed to continue the monitoring of ozone and some were designed to also measure other atmospheric constituents of interest. These constituents were selected for their link with ozone (especially the gases that are involved in its depletion) or for their potential impact on Numerical Weather Prediction (NWP). Indeed, under some as-sumptions, the assimilation of chemical constituent observations can bring information
20
on wind fields (Daley, 1995). Moreover, NWP systems assimilate instrument radiances sensitive not only to temperature but also to atmospheric constituents (Engelen and Bauer, 2011).
With the arrival of atmospheric composition measurements from space, it became possible to mimic NWP by providing chemical forecasts and analyses of chemical
con-25
ACPD
14, 2553–2599, 2014Assimilation of atmospheric CH4
products
S. Massart et al.
Title Page
Abstract Introduction
Conclusions References
Tables Figures
◭ ◮
◭ ◮
Back Close
Full Screen / Esc
Printer-friendly Version
Interactive Discussion
Discussion
P
a
per
|
D
iscussion
P
a
per
|
Discussion
P
a
per
|
Discuss
ion
P
a
per
|
in space from which column products of CH4 were derived. Today, CH4columns can be retrieved from the Tropospheric Emission Spectrometer (TES) instrument aboard NASA’s Aura satellite (launched in 2004), from the Infrared Atmospheric Sounding In-terferometer (IASI) instrument aboard the first European meteorological polar-orbiting satellites, MetOp-A (launched in 2006) or the Thermal And Near-infrared Sensor
5
for carbon Observation (TANSO) aboard the Greenhouse gases Observing Satellite (GOSAT, launched in 2009). SCIAMACHY and TANSO measurements are in the near infrared (NIR) while TES and IASI measurements are in the thermal infrared (TIR). NIR methane retrievals are sensitive to the entire tropospheric column, but due to their dependence on reflected sunlight, observations are unavailable at night. TIR methane
10
retrievals can be performed day and night, over land and ocean, and for partly cloudy scenes but they have limited sensitivity to the lower troposphere (due to lack of thermal contrast) and their precision is limited mainly by uncertainties in atmospheric tempera-ture and surface emissivity. The combination of all these measurements of atmospheric CH4columns from space are complementary to the surface observation to monitor the
15
atmospheric CH4. They provide nevertheless only vertically integrated information and
with some uncertainties.
Data assimilation provides the the ability to combine all the information from different instruments and observing networks and to combining them with a model in an optimal way. This study presents one of the two data assimilation products provided by the
20
Monitoring Atmospheric Composition and Climate Interim Implementation (MACC-II) project and using CH4measurement from space. The first product combines satellite
measurements of CH4with inverse modelling in order to optimise the surface sources and sinks of CH4(Bergamaschi et al., 2009). The second product combines the satellite
measurements with a forward transport model in order to monitor the tropospheric
25
ACPD
14, 2553–2599, 2014Assimilation of atmospheric CH4
products
S. Massart et al.
Title Page
Abstract Introduction
Conclusions References
Tables Figures
◭ ◮
◭ ◮
Back Close
Full Screen / Esc
Printer-friendly Version
Interactive Discussion
Discussion
P
a
per
|
D
iscussion
P
a
per
|
Discussion
P
a
per
|
Discuss
ion
P
a
per
|
hereafter as the analysis. But unlike most of the data assimilated in NWP, CH4data are not yet available in near real time, mainly due to their partial reliance on auxiliary data. As a consequence, the assimilation system is run with a 6 month lag in a so-called “delayed mode” (DM).
The MACC-II DM system started producing a CH4 analysis from 1 June 2009
on-5
wards. This analysis was initially based on the CH4 product from SCIAMACHY
pro-vided by the SRON Netherlands Institute for Space Research in collaboration with the Jet Propulsion Laboratory (JPL, Frankenberg et al., 2005) and the version v00.50 CH4 product from TANSO provided by the Japan National Institute for Environmental
Studies (NIES). This TANSO product was not mature enough at this time and its
assim-10
ilation increased the bias and the variability of the analysis. Therefore the SCIAMACHY CH4product remained for a while the only CH4product assimilated in the DM system.
With the loss of Envisat in April 2012, the methane analysis of the DM system had to rely on other instruments. To continue the monitoring of the atmospheric CH4 with the DM system, TANSO and IASI CH4products were included in the assimilation
sys-15
tem. TANSO has similar characteristics as SCIAMACHY but provides about 10 times less data than SCIAMACHY during a given assimilation window. Its data are neverthe-less more accurate than that from SCIAMACHY. Since our first attempt at assimilating TANSO data, several retrieval algorithms processing the TANSO data have been de-veloped by several teams (Parker et al., 2011; Schepers et al., 2012; Yoshida et al.,
20
2013). The MACC-II product is jointly developed by SRON and the Karlsruhe Institute of Technology (KIT, Butz et al., 2010). As a TIR sounder, IASI provides complemen-tary information on the mid-troposphere during day and night over land and over sea. The MACC-II IASI product is from theLaboratoire de Météorologie Dynamique(LMD). Currently it has a good enough precision in the tropics only (Crevoisier et al., 2009).
25
The assimilation of TES was not considered because its data cannot be assimilated in the DM system as it is not available within the expected a 6 month latency period.
ACPD
14, 2553–2599, 2014Assimilation of atmospheric CH4
products
S. Massart et al.
Title Page
Abstract Introduction
Conclusions References
Tables Figures
◭ ◮
◭ ◮
Back Close
Full Screen / Esc
Printer-friendly Version
Interactive Discussion
Discussion
P
a
per
|
D
iscussion
P
a
per
|
Discussion
P
a
per
|
Discuss
ion
P
a
per
|
to determine how the change in the observing system would impact the DM analysis. Section 2 provides more details on the assimilated data and describes the assimilation system as well as the experiments we ran to assess the impact of each data set on the analysis. Section 3 presents the results of our assimilation experiments and their comparison with independent measurements of atmospheric CH4. The last section
5
addresses the question of whether the combination of TANSO and IASI products is a good candidate to continue the monitoring of methane in our analysis system.
2 Analysis experiments
For the period between November 2010 and April 2012 we ran three data assimila-tion experiments based on the following CH4 products: 1. SCIAMACHY; 2 TANSO; 3
10
TANSO and IASI. These experiments are referred hereafter as to SCIA, TANSO and IASI+TANSO, respectively (Fig. 1). To properly asses the impact of the assimilation of each product, we also ran for this period an experiment without assimilation of CH4
observations. This experiment is referred to as the free run FREE. The free run and the assimilation system are described in the following subsection. Then we present the
15
three assimilated data sets. The last subsection details the experiments we ran.
2.1 Analysis system
The MACC-II greenhouse gases DM system is based on ECMWF IFS. It runs at a global horizontal resolution of T511 (≈40 km) with 60 vertical levels from the
sur-face up to 0.1 hPa. Because this horizontal resolution is too costly for long assimilation
20
experiments, we chose in this study to keep the configuration of the DM system but to decrease the horizontal resolution to T255 (≈80 km), which is sufficient for resolving the large scale horizontal structures of the atmospheric CH4fields.
Based on the default IFS configuration, all the observations (operational and methane) are assimilated within the 12 h 4-D-Var window to constrain the
ACPD
14, 2553–2599, 2014Assimilation of atmospheric CH4
products
S. Massart et al.
Title Page
Abstract Introduction
Conclusions References
Tables Figures
◭ ◮
◭ ◮
Back Close
Full Screen / Esc
Printer-friendly Version
Interactive Discussion
Discussion
P
a
per
|
D
iscussion
P
a
per
|
Discussion
P
a
per
|
Discuss
ion
P
a
per
|
logical variables as well as the atmospheric CH4. Methane mass mixing ratio is directly transported within IFS as a tracer. But its evolution is also determined by fluxes and chemical sinks. Methane fluxes are prescribed in IFS using inventory and climatological data sets. These fluxes are consistent with those used as prior information in the CH4 flux inversions from Bergamaschi et al. (2009). The anthropogenic fluxes are from the
5
EDGAR 4.2 database (Janssens-Maenhout et al., 2012) for the year 2008, i.e. the last available year. All the anthropogenic categories are based on annual mean values, ex-cept for rice, which has been modulated with a seasonal cycle of the Matthews monthly inventory for rice (Matthews et al., 1991). The wetland fluxes are from the Kaplan cli-matology described in Bergamaschi et al. (2007). The biomass burning emissions are
10
from the MACC-II GFAS dataset (Kaiser et al., 2012). The other sources/sinks include wild animals (Houweling et al., 1999), termites (Sanderson, 1996), oceans (Houweling et al., 1999; Lambert and Schmidt, 1993) and a soil sink (Ridgwell et al., 1999). For the chemical sink in the troposphere and the stratosphere, the climatological chemical loss rates from Bergamaschi et al. (2009) are used. These are based on OH fields optimised
15
with methyl chloroform using the TM5 model (Krol et al., 2005) and prescribed concen-trations of the stratospheric radicals using the 2-D photochemical Max-Planck-Institute model.
The background and observation error covariance matrices for the CH4assimilation
are specified as for all the IFS meteorological variables. The background error is set to
20
be constant in time. Its standard deviation (diagonal of the covariance matrix) is about 20 ppb in the troposphere and increases to a value of 150 ppb at the surface. The correlations are constant over the whole domain with a representative length scale of about 200 km. The system does not account for the spatial or temporal correlation between the errors of the observations. The observation error standard deviation is
25
ACPD
14, 2553–2599, 2014Assimilation of atmospheric CH4
products
S. Massart et al.
Title Page
Abstract Introduction
Conclusions References
Tables Figures
◭ ◮
◭ ◮
Back Close
Full Screen / Esc
Printer-friendly Version
Interactive Discussion
Discussion
P
a
per
|
D
iscussion
P
a
per
|
Discussion
P
a
per
|
Discuss
ion
P
a
per
|
2.2 Assimilated data
The MACC-II DM system is able to assimilate various kinds of data sets like radiances or geophysical products with and without averaging kernels. For methane, the choice was made to assimilate retrievals products in order to lower the level of complexity imposed by the radiance assimilation.
5
2.2.1 SCIAMACHY
SCIAMACHY measured the direct light from the sun as well as the solar light reflected by the Earth. The difference provides information on the atmosphere through which the Earth-reflected light has passed, especially information on the concentration of trace gases and aerosols in the troposphere and stratosphere. SCIAMACHY measured the
10
light between 240 and 1700 nm, and in certain spectra between 2000 and 2400 nm at a moderate spectral resolution (0.2 to 0.5 nm).
Envisat flew in a sun synchronous polar orbit at an altitude of 790 km. It orbited the Earth in about 101 min with a repeat cycle of 35 days. Along the orbits, SCIAMACHY used different observation modes: nadir, limb, and solar or lunar occultation. For the
15
nadir mode which is used in this study the swath was 960 km. For the methane prod-uct, the pixel size on the ground was 30 km (along track) by 60 km (across track). Per 12 h assimilation window SCIAMACHY provided about 1200 CH4data points with a
dis-tribution as shown in Fig. 2. In autumn the best observed places are the continents over a large tropical band. For example over Australia more than 10 observations per model
20
grid point are provided for the whole month of October 2011. North Africa is also well observed with several model grid points having about 25 observations. Oceans south of 30◦S are better observed than other oceans, but they have on average less than 5
observations per month. Later on in the season and until January, the coverage shifts to the South due to the dependence of the instrument on the sunlight. Early on and
un-25
ACPD
14, 2553–2599, 2014Assimilation of atmospheric CH4
products
S. Massart et al.
Title Page
Abstract Introduction
Conclusions References
Tables Figures
◭ ◮
◭ ◮
Back Close
Full Screen / Esc
Printer-friendly Version
Interactive Discussion
Discussion
P
a
per
|
D
iscussion
P
a
per
|
Discussion
P
a
per
|
Discuss
ion
P
a
per
|
The column-averaged dry-air mole fractions of methane (xCH4) product from SCIA-MACHY used in this study is provided by an algorithm based on the proxy method developed at SRON in collaboration with JPL (Frankenberg et al., 2005, 2011). The algorithm uses the 1600 nm band of SCIAMACHY. In this paper, we used version v5.5 of the product. The product provides a dry molar fraction column of CH4with an a
pri-5
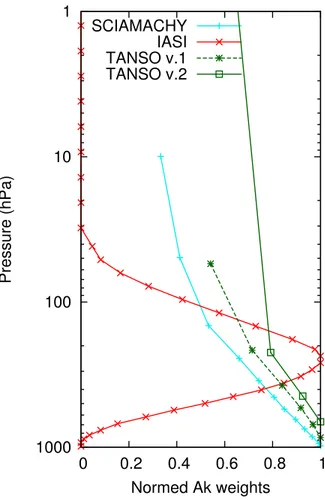
ori profile of CH4 and its corresponding averaging kernel. Both the a priori and the
averaging kernel have 12 vertical levels from the lower troposphere to the top of the at-mosphere (Fig. 3). As shown by the shape of the averaging kernel, the retrieved xCH4
from SCIAMACHY are more sensitive to the lower troposphere.
The proxy method provides xCH4proxy based on the ratio between the CH4 number
10
column (vCH4) and the CO2number column (vCO2),
xCH4proxy=
vCH4
vCO2
·xCO2prior. (1)
The prior column-averaged dry-air mole fraction of CO2 (xCO2 prior
) is computed from CO2 molar fractions provided by CarbonTracker (carbontracker.noaa.gov). At the time this paper of writing, CarbonTracker provides CO2for 2011. But in 2010, when the 2010
15
xCH4 SCIAMACHY product was produced, the available data set from CarbonTracker
was from 2007. Assuming a yearly increase in CO2 of 0.4 %, a multiplicative factor of (1.004)3 was applied to the 2007 CarbonTracker CO2 fields in order to produce
the 2010 xCH4 product. When the 2011 xCH4 SCIAMACHY product was produced,
the 2010 release of CarbonTracker was available. So a multiplicative factor of 1.004
20
was applied to the 2010 CarbonTracker CO2fields in order to produce the 2011 xCH4
product. The standard deviations of the observation error provided with the data do not vary much in time during the study period. Its averaged value is 60 ppb.
It is well known that SCIAMACHY NIR channels suffered from severe radiation dam-age (Kleipool et al., 2007; Frankenberg et al., 2011), thereby affecting its performance
25
ACPD
14, 2553–2599, 2014Assimilation of atmospheric CH4
products
S. Massart et al.
Title Page
Abstract Introduction
Conclusions References
Tables Figures
◭ ◮
◭ ◮
Back Close
Full Screen / Esc
Printer-friendly Version
Interactive Discussion
Discussion
P
a
per
|
D
iscussion
P
a
per
|
Discussion
P
a
per
|
Discuss
ion
P
a
per
|
2.2.2 TANSO
GOSAT is a joint effort from the Japan Aerospace Exploration Agency (JAXA), the National Institute for Environmental Studies (NIES) and the Japanese Ministry of the Environment (MOE) as part of the Global Change Observation Mission (GCOM) pro-gram of Japan. GOSAT was launched on 23 January 2009, into a sun synchronous
5
orbit at an altitude of 666 km. This implies that the satellite comes back to the same location with a 3 day period.
GOSAT carries the TANSO observing instrument, which consists of a Fourier Trans-form Spectrometer (TANSO-FTS) and a Cloud and Aerosol Imager (TANSO-CAI). Two out of the four bands measured by TANSO-FTS are sensitive to CH4, one in the short
10
wave infrared (SWIR) and one in the thermal infrared (TIR) (for more details see: www.gosat.nies.go.jp/eng/gosat). Each detector has the same circular field of view of 10.5 km when projected on the Earth’s surface (at exact nadir), and a swath of 750 km. Compared to SCIAMACHY that had a continuous coverage across the swath (for clear sky condition) and thus 16 observations, TANSO makes only 5 observations across the
15
swath due to the measurement time.
The xCH4 TANSO product used in this study is also provided by SRON using the
proxy setup of the RemoTeC algorithm (Butz et al., 2010), a joint development between SRON and KIT. In this paper, we use version v.1 (from November 2010 to Septem-ber 2011) and version v.2.0 (from OctoSeptem-ber 2011 onward) of the product. These products
20
also consist of a dry molar fraction column with an a priori profile and its corresponding averaging kernel. The a priori and the averaging kernel have 6 vertical levels for version v.1 and 4 vertical levels for version v.2.0 (Fig. 3). Note that the TANSO averaging ker-nels have a similar shape as the SCIAMACHY ones as they both measure in the near infrared. That makes TANSO also sensitive to the lower troposphere. The given values
25
ACPD
14, 2553–2599, 2014Assimilation of atmospheric CH4
products
S. Massart et al.
Title Page
Abstract Introduction
Conclusions References
Tables Figures
◭ ◮
◭ ◮
Back Close
Full Screen / Esc
Printer-friendly Version
Interactive Discussion
Discussion
P
a
per
|
D
iscussion
P
a
per
|
Discussion
P
a
per
|
Discuss
ion
P
a
per
|
The coverage of both versions of the product is similar over land even when the so-lar zenith angle limit was changed from 70◦ to 75◦ (Fig. 2). As for SCIAMACHY, the coverage of the Northern Hemisphere is larger during the summer reaching 70◦N or 75◦N (depending on the version of the product), and smaller during the winter, reaching 50◦N. Contrary to SCIAMACHY, the coverage of the Southern Hemisphere does not
5
vary much with the season. The measurements are mainly located north of 45◦S with few points over Antarctica. Version v.2.0 of the product provides data over the oceans (sunglint instrument pointing) where no data were retrieved in version v.1. These ob-servations over oceans are located in a tropical band that varies with the season, with more measurements in the Northern Hemisphere during JJA and more measurements
10
in the Southern Hemisphere during DJF. These observations allow increasing the num-ber of assimilated data per 12 h assimilation window from about 200 observations (for version v.1) to about 360 observations (for version v.2.0). This nevertheless remains more than 3 times less than the number of assimilated SCIAMACHY observations.
2.2.3 IASI
15
The first Infrared Atmospheric Sounding Interferometer (IASI) developed by the Centre National d’Etudes Spatiales (CNES) in collaboration with the European Organisation for the Exploitation of Meteorological Satellites (EUMETSAT) was launched in Octo-ber 2006 onboard the European MetOp-A platform. IASI is a Fourier Transform Spec-trometer based on a Michelson Interferometer coupled to an integrated imaging system
20
that measures infrared radiation emitted from the Earth from 645 to 2760 cm−1
, with a spectral resolution of 0.5 cm−1apodized and a spectral sampling of 0.25 cm−1.
MetOp-A flows in a sun synchronous polar orbit at an altitude of 817 km. IASI is an across track scanning system with a scan range of±48.3◦ (symmetrically with
re-spect to the nadir direction). A nominal scan line covers 30 scan positions towards the
25
ACPD
14, 2553–2599, 2014Assimilation of atmospheric CH4
products
S. Massart et al.
Title Page
Abstract Introduction
Conclusions References
Tables Figures
◭ ◮
◭ ◮
Back Close
Full Screen / Esc
Printer-friendly Version
Interactive Discussion
Discussion
P
a
per
|
D
iscussion
P
a
per
|
Discussion
P
a
per
|
Discuss
ion
P
a
per
|
The CH4 IASI retrievals used in this study are provided by a non linear inference scheme based on Multilayer Perceptron neural networks (Crevoisier et al., 2009, 2013). This method relies on the simultaneous use of synchronised observations from IASI and the Advanced Microwave Sounding Unit (AMSU) to disentangle CH4 from atmo-spheric temperature in the IASI radiances. IASI provides sub-column of CH4 in the
mid-5
to-upper troposphere, with associated weighting functions having their maximum at 250 hPa (Fig. 3). In this study we restricted the data to a large tropical belt (30◦N:30◦S) where higher-quality data are expected compared to higher latitudes because of the low variability of the temperature profiles, which facilitates the decorrelation between CH4 and temperature signals. In that region, the given observation error is 37 ppb in
10
average. It is slightly higher during spring (2011 and 2012) and slightly lower during the summer 2011.
Compared to SCIAMACHY, which provides dense information mainly over land, and compared to TANSO, which provides sparse information, IASI provides a very dense observation pattern both over land and ocean, for clear-sky conditions only. For
exam-15
ple, in October, each grid point is observed on average 11 times (less than for SCIA-MACHY and TANSO) but most of the grid points are observed (Fig. 2). Only North Africa and Asia have some gaps because of specific surface conditions over the Sa-hara and of the persistence of cloudy conditions, especially during the monsoon. One can note that the observational coverage over the oceans is slightly better than over
20
the land.
2.3 Set-up of experiments
We decided to start the study period the 1st November 2010 in order to have more than one year of SCIAMACHY data to assimilate before April 2012, the month the contact with Envisat was lost. When we started the study, the MACC-II DM system
25
was running since June 2009 assimilating SCIAMACHY CH4 products. This run was
ACPD
14, 2553–2599, 2014Assimilation of atmospheric CH4
products
S. Massart et al.
Title Page
Abstract Introduction
Conclusions References
Tables Figures
◭ ◮
◭ ◮
Back Close
Full Screen / Esc
Printer-friendly Version
Interactive Discussion
Discussion
P
a
per
|
D
iscussion
P
a
per
|
Discussion
P
a
per
|
Discuss
ion
P
a
per
|
concentration from the DM analysis for the 1st November 2010 and used them as initial conditions. The SCIA experiment is then a clone of the DM but at a different resolution. The two other analysis experiments use the same initial condition so we can assess the impact of the change in the observing system. The FREE run also uses this initial condition in order to better evaluate the impact of the assimilation.
5
The study period runs from the beginning of November 2010 to the end of April 2012 (18 months), when SCIAMACHY stopped producing data (Fig. 1). Occasionally we split the period studied into seasons to interpret the results. Note that the first completed season studied (DJF 2010/2011) starts one month after the beginning of the study period. This first month can thus be regarded as a spin-up period.
10
2.4 Evaluation data
The non-nsatellite CH4 data are mainly measurements of the near surface
concen-trations. For example, in situ measurements are provided by the National Oceanic and Atmospheric Administration (NOAA) network (www.esrl.noaa.gov/gmd) and the pre-operational Integrated Carbon Observation System (ICOS) network
(icos-atc-15
demo.lsce.ipsl.fr). But as the assimilated data are columns and therefore they do not constrain well the surface level in the analysis, we decided to carry out the val-idation of the analyses using profiles and column measurements. We chose some campaigns from the HIAPER Pole-to-Pole Observations (HIPPO, Wofsy et al., 2011, hippo.ornl.gov) and the measurements from the Total Carbon Column Observing
Net-20
work (TCCON, Wunch et al., 2011, tccon-wiki.caltech.edu). The flight data cover 3 months of the studied period with a good vertical resolution while the ground-based data cover the whole period but provide only the vertically integrated information in a few places over the Globe.
During the period under study, four HIPPO campaigns took place between 16 June
25
ACPD
14, 2553–2599, 2014Assimilation of atmospheric CH4
products
S. Massart et al.
Title Page
Abstract Introduction
Conclusions References
Tables Figures
◭ ◮
◭ ◮
Back Close
Full Screen / Esc
Printer-friendly Version
Interactive Discussion
Discussion
P
a
per
|
D
iscussion
P
a
per
|
Discussion
P
a
per
|
Discuss
ion
P
a
per
|
flights more towards the West and crossing Australia and Indonesia. In this paper, the 10 s merged methane product was used (Wofsy et al., 2012).
At the time of writting, twenty one stations of the TCCON network have reported data for the period we are interested in. We chose to compute global statistics using all these stations and additionally differentiating them by regions and by period. Most
5
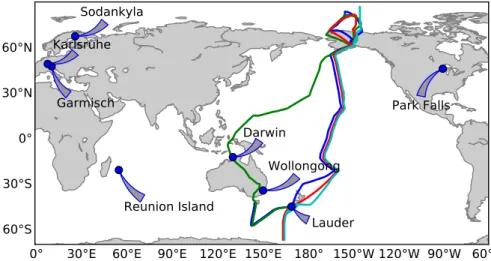
of the used data are localised north of 20◦N (about 70 %). The data collected over the tropical region represent 8 % and only 4 % for the period before October 2011. Moreover, eight stations were chosen to present time series (Fig. 4). Some stations were retained because they provided the most continuous data set (e.g. Park Falls). We also kept the stations located in the tropical area in order to assess the impact of
10
the assimilation of the IASI data. The two stations located at the two highest latitudes (north and south) were also selected (e.g. Lauder and Sodankyla).
3 Results
In the following, we present the results of the FREE experiment and the three assimi-lation experiments by comparing the latter to the free run.
15
3.1 Free run
Unlike for a CTM, the FREE experiment consists here of forecasting both the CH4 molar fraction and the meteorological parameters. The meteorological parameters are free to evolve without any constraint during the forecast. In order to have more accurate meteorological parameters, we replaced them each 12 h by the ones from one of our
20
assimilation experiment (all our analyses presented in this paper having the same me-teorological parameters). These analysed meme-teorological parameters result from the assimilation of all the operational meteorological data in IFS. This procedure makes the FREE experiment have a slightly different meteorological forcing than the other experiments.
ACPD
14, 2553–2599, 2014Assimilation of atmospheric CH4
products
S. Massart et al.
Title Page
Abstract Introduction
Conclusions References
Tables Figures
◭ ◮
◭ ◮
Back Close
Full Screen / Esc
Printer-friendly Version
Interactive Discussion
Discussion
P
a
per
|
D
iscussion
P
a
per
|
Discussion
P
a
per
|
Discuss
ion
P
a
per
|
Methane is free to evolve without any constraint by observations in the FREE exper-iment. Its evolution is subject to the transport, the fluxes and the chemical loss rates. The fluxes are the largest source of uncertainty for CH4 in this experiment and they
are also the main driver of its evolution. Even if there is no constraint on the fluxes or on the CH4 molar fraction, the forecast CH4 is realistic enough to provide us the
5
reference to assess the effect of the assimilation of CH4 data. This simulation
repre-sents the main features of atmospheric CH4 like the north–south gradient as well as the seasonal variability of the Northern Hemisphere (Fig. 5).
One can notice an increase in the global trend of the methane total column. This is due to the modelled CH4growth, i.e. a net positive budget of the sources and the sinks.
10
3.2 SCIAMACHY analysis
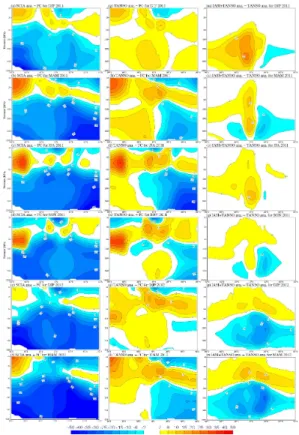
Due to the fact that SCIAMACHY measures reflected solar light, SCIAMACHY can only provide daytime measurements. This leads to gaps into the global coverage during local winter periods (Fig. 6a). To asses how the analysis deals with these gaps, we computed the seasonal averages of the analysis increment in terms of total column
15
(Fig. 7a). An averaged increment is representative of a systematic mismatch between the background state (computed by a 12 h forecast from the previous analysis) and the observations. We do not discuss here the values of the averaged increment as the biases are not the focus of this paper. We use this diagnostic to present where the observations add information through the analysis.
20
The structure of the averaged increment shows that the analysis of SCIAMACHY brings information mainly over land in the tropical region and at mid-latitudes and not over the ocean. Depending on the season, the analysis brings information at high lati-tudes (Northern Hemisphere in JJA and Southern Hemisphere in DJF) over ocean and land. The direct impact of the assimilation of the SCIAMACHY product should therefore
25
ACPD
14, 2553–2599, 2014Assimilation of atmospheric CH4
products
S. Massart et al.
Title Page
Abstract Introduction
Conclusions References
Tables Figures
◭ ◮
◭ ◮
Back Close
Full Screen / Esc
Printer-friendly Version
Interactive Discussion
Discussion
P
a
per
|
D
iscussion
P
a
per
|
Discussion
P
a
per
|
Discuss
ion
P
a
per
|
of the Northern Hemisphere in June (Fig. 5b). Total columns from the SCIA experi-ment are locally more than 50 ppb lower than those from the FREE experiexperi-ment. This difference corresponds to less CH4molar fraction from the surface to the lower
strato-sphere, up to 50 hPa in the analysis (Fig. 8, left panels). The difference is largest in the troposphere and particularly at levels close to the surface.
5
At high latitudes in the Southern Hemisphere, the main differences are observed dur-ing DJF which corresponds to the local summer. There, the SCIA experiment has still less CH4 from the surface up to 100 or 50 hPa (depending on the year). The largest
differences of more than 30 ppb are found from the near surface to the upper tropo-sphere. This corresponds to differences of about 20 to 30 ppb in terms of averaged
10
total columns. One can notice that during the winter-time of each hemisphere, there is an indirect impact of SCIAMACHY as xCH4 remains lower in the SCIA experiment
compared to the FREE experiment. This is likely due to the transport that spreads the observation information in space and time or due to the model adjustment to its equilibrium state.
15
Over the tropical region, the analysis also has lower methane concentrations than the FREE experiment. The differences are higher in MAM and JJA 2011 with values between 15 and 25 ppb, and in MAM 2012 with values between 30 and 40 ppb. The result of these seasonal differences as well as the differences at highest latitudes is a modification of the north–south gradient and the seasonal cycle in the SCIA
ex-20
periment compared to the FREE experiment. In the SCIA experiment the gradient is steeper in DJF and flatter in JJA, and the seasonal cycle is more pronounced.
3.3 TANSO analysis
The TANSO data are available during most of the period under study, apart for a few days in August 2011 (Fig. 6b). The Southern Hemisphere is less well sampled as there
25
is little or no coverage of the oceans and the coverage mostly stops for latitudes south of 45◦S. SCIAMACHY has thus an added value in this region south of 45◦S as its data
ACPD
14, 2553–2599, 2014Assimilation of atmospheric CH4
products
S. Massart et al.
Title Page
Abstract Introduction
Conclusions References
Tables Figures
◭ ◮
◭ ◮
Back Close
Full Screen / Esc
Printer-friendly Version
Interactive Discussion
Discussion
P
a
per
|
D
iscussion
P
a
per
|
Discussion
P
a
per
|
Discuss
ion
P
a
per
|
averaged increments of the TANSO experiment show however that the TANSO data have an influence over Antarctica similar to the SCIAMACHY data (but to a lesser ex-tent) in DJF 2011/2012 (Fig. 7). They also have an influence over oceans at southern mid-latitude while the SCIAMACHY data have an influence further on south. In JJA, where both datasets are available, their region of influence is similar. At mid and high
5
latitudes north, SCIAMACHY data have additionally an influence over oceans. In sum-mary, the averaged increments show that even if the TANSO data are sparser than the SCIAMACHY data, their region of influence is similar over the tropics and mid-latitudes. The assimilation of the TANSO data has less impact on the analysis than the assimi-lation of the SCIAMACHY data when compared to the FREE experiment (Fig. 5c). The
10
difference between the CH4column from the TANSO experiment and from the FREE experiment is mostly less than 10 ppb but here the analysis has higher CH4values than
the FREE experiment. This is the main characteristic of this experiment compared to the SCIA one. The exception is for the summer period at northern high latitudes. As for the SCIA analysis, the TANSO analysis reduces the lower atmospheric CH4compared
15
to the FREE experiment. But where the reduction exceeds 50 ppb for the SCIA exper-iment, it is here less than 40 ppb. The TANSO measurements are limited to 82◦N, but
due to the transport and the background error correlation, the information is spread to higher latitudes. This compensates the lack of TANSO data at the high latitudes.
The TANSO data influence the vertical distribution of the analysed CH4 compared
20
to the vertical distribution from the FREE experiment mainly over the northern extra tropical region from MAM to SON (Fig. 8, central panels) as for the total columns. The differences reach their maximum in JJA with a CH4molar fraction lower for the analysis (compared to FREE). The maximum value of the difference is more than 30 ppb and it is found from the surface to 500 hPa. The TANSO data thus allow constraining the
25
ACPD
14, 2553–2599, 2014Assimilation of atmospheric CH4
products
S. Massart et al.
Title Page
Abstract Introduction
Conclusions References
Tables Figures
◭ ◮
◭ ◮
Back Close
Full Screen / Esc
Printer-friendly Version
Interactive Discussion
Discussion
P
a
per
|
D
iscussion
P
a
per
|
Discussion
P
a
per
|
Discuss
ion
P
a
per
|
that the difference in the stratosphere between the assimilation experiments and the free run experiment comes from slight differences in the meteorological forcing.
3.4 TANSO and IASI analysis
When the IASI data are added to the TANSO data in the analysis, their effect is evalu-ated by comparing the resulting analysis with the TANSO analysis (Fig. 5d). The
com-5
parison emphasizes the impact of the change in the version of the assimilated TANSO data in October 2011. The IASI+TANSO experiment has between 5 and 15 ppb less methane in total column after October 2011. Before this date, the difference is mainly between −5 and 5 ppb, except for DJF 2010/2011 when the total column from the
IASI+TANSO experiment are 15 ppb higher. The difference between the two
experi-10
ments is mainly located in the tropical and mid-latitudes regions south of 30◦N and north of 30◦S where the IASI data are provided. The transport and the background error correlation however spreads the information at highest latitudes but there the dif-ference is never much more than 2 ppb.
The weighting function of the IASI product peaks at about 250 hPa. It reaches half
15
of its maximum respectively at 100 hPa and 500 hPa. One can expect to see the in-fluence of the assimilation of the IASI data mainly in this vertical region between 100 and 500 hPa. But looking at the differences between the zonal and seasonal averages from the IASI+TANSO experiment and from the TANSO experiment, the influence is observable from the surface up to 10 hPa (Fig. 8, right panels). This could be explained
20
by the vertical transport as well as by the vertical correlation in the background error statistics or the interaction with the TANSO data.
From December 2010 to April 2011, the IASI data constrain the analysis so that it has higher values of methane concentration in the middle troposphere over the tropics compared to the TANSO analysis. For the extra-tropical regions, the impact is more
25
dependent on the season. The IASI analysis tends nevertheless to decrease CH4 in
ACPD
14, 2553–2599, 2014Assimilation of atmospheric CH4
products
S. Massart et al.
Title Page
Abstract Introduction
Conclusions References
Tables Figures
◭ ◮
◭ ◮
Back Close
Full Screen / Esc
Printer-friendly Version
Interactive Discussion
Discussion
P
a
per
|
D
iscussion
P
a
per
|
Discussion
P
a
per
|
Discuss
ion
P
a
per
|
experiments (IASI+TANSO and TANSO) differs substantially from the previous sea-sons. The previously described decrease in terms of xCH4 during these two seasons
is associated with a decrease of CH4by more than 15 ppb from the surface to 100 hPa
in the tropics and at the same time an increase (less than 10 ppb) above 100 hPa. Due to the transport, these differences spread to the extra-tropical regions.
5
3.5 Comparison with independent measurements
The three CH4analyses showed their own features in term of CH4spatial and
tempo-ral distribution when compared to the simulation without data assimilation. To further document the features of each analysis, they are compared to evaluation data, i.e. data that have not been directly included in the assimilation process. These evaluation data
10
are not always independent as for example satellite products are bias-corrected using the measurements from the TCCON network.
3.5.1 Comparison with HIPPO
For each CH4concentration measured during the campaigns, we computed the model
equivalent for each of our four experiments. Top panel of Fig. 9 presents the
measure-15
ments for the four campaigns as a function of latitude and altitude (in pressure units). And for each experiment, we present the same figure but for the difference between the model and the measurement (Fig. 9 lines 2 to 5). We removed for each experiment the global bias between the model and the measurements in order to better visualise the difference between the experiments. The biases are computed for the four campaigns
20
together and are available in Table 1.
From the four campaigns, we can clearly identify in the HIPPO data the north–south gradient in the CH4 distribution with lower values in the Southern Hemisphere (Fig. 9
top panel). We can also clearly asses the vertical gradient when the flight crosses the tropopause at around 200 hPa at high latitudes.
ACPD
14, 2553–2599, 2014Assimilation of atmospheric CH4
products
S. Massart et al.
Title Page
Abstract Introduction
Conclusions References
Tables Figures
◭ ◮
◭ ◮
Back Close
Full Screen / Esc
Printer-friendly Version
Interactive Discussion
Discussion
P
a
per
|
D
iscussion
P
a
per
|
Discussion
P
a
per
|
Discuss
ion
P
a
per
|
The FREE experiment represents the north–south gradient reasonably well for the two last campaigns (Fig. 9 line 2), despite a global underestimation of about 4 ppb in the CH4 tropospheric content (Table 1). But it fails to represent correctly the gradient
for the two first campaigns with an underestimation over the Southern Hemisphere and an overestimation over the Northern Hemisphere. On average for the campaigns,
5
the underestimation over the Southern Hemisphere is around 7 ppb (as well as for the tropics) and the overestimation over the Northern Hemisphere is also around 7 ppb. This leads to an overall underestimation of less than 2 ppb.
As shown in the previous section, the SCIA analysis reduces the north–south gradi-ent during the summer. This leads to an improvemgradi-ent in the inter-hemispheric gradigradi-ent
10
when compared to the HIPPO data (Fig. 9 line 3). This experiment has a better gradi-ent than the one from the FREE experimgradi-ent. But overall the analysis underestimates CH4by about 30 ppb on average. This suggests an underlying bias of the SCIAMACHY
product.
We already mentioned the change in the north–south gradient in the TANSO
ex-15
periment due to a reduction of the tropospheric CH4 in the Northern Hemisphere
(Sect. 3.3). When compared to the HIPPO data this reduction appears to be slightly too large (Fig. 9 line 4). The Northern Hemisphere overestimation in the FREE experiment (7 ppb) is replaced by a larger underestimation of 22 ppb in the analysis (Table 1). For the Southern Hemisphere, the impact of the assimilation of the TANSO data is mainly
20
positive (from 7 ppb for FREE to 3 ppb for the analysis) even at high latitudes where there is no data to constrain the model. This suggests a latitude dependent bias in the version v.1 of the TANSO product. The Northern Hemisphere bias increases however at high latitudes during the last campaign with a difference larger than 40 ppb when compared to the HIPPO data. Note that this large underestimation is also present in
25
the SCIA analysis.
ACPD
14, 2553–2599, 2014Assimilation of atmospheric CH4
products
S. Massart et al.
Title Page
Abstract Introduction
Conclusions References
Tables Figures
◭ ◮
◭ ◮
Back Close
Full Screen / Esc
Printer-friendly Version
Interactive Discussion
Discussion
P
a
per
|
D
iscussion
P
a
per
|
Discussion
P
a
per
|
Discuss
ion
P
a
per
|
less biased than the the TANSO experiment (Table1). The improvement comes from the tropics where the bias is reduced by about 4 ppb and from the Southern Hemisphere where it is reduced by about 2 ppb. In contrast, the bias increased by about 2 ppb in the Northern Hemisphere. In terms of vertical distribution, the difference between the experiments is located mainly above 700 hPa (Fig. 9, last line). The largest effect of
5
the assimilation of the IASI data is found for the first campaign during which the inter-hemispheric gradient is less well represented in the IASI+TANSO experiment.
In order to have another picture of how well the experiments are able to represent the CH4 features as measured during the HIPPO campaigns, we computed the
cor-relation between the measurements and the model equivalent (Table 2). The FREE
10
experiment presents already a strong correlation of 0.95 which means that the model is able to well represent the spatial distribution of the tropospheric CH4. The SCIA
ex-periment has a similar correlation but with a different regional distribution compared to the FREE experiment. The correlation is higher over the Northern Hemisphere and the tropics but lower in the Southern Hemisphere. This shows that the assimilation system
15
correctly uses the information content of the SCIAMACHY data. In contrast, the sys-tem has more difficulties with the TANSO data especially in the Southern Hemisphere where only few data are available to the assimilation. There the correlation drops from 0.75 (from the FREE experiment) to 0.68 (for the TANSO experiment). This means that the propagation of the information to the Southern Hemisphere has to be improved and
20
the output of the analysis in this region should be used with caution. Even if the assimi-lation of the IASI data allows reducing the bias compared to the HIPPO measurements, it degrades the correlation in the tropics with a value of 0.57 for the IASI+TANSO ex-periment when the FREE exex-periment has a correlation of 0.83 there. This suggests and issue with the IASI data or that the assimilation system does not make a proper use
25
of the IASI data, at least when they are combined with the version v.1 of the TANSO product. We saw in Sect. 3.4 that the impact of the IASI data in the vertical distribution of CH4 changed when the data are combined with version v.1 or version v.2.0 of the
mea-ACPD
14, 2553–2599, 2014Assimilation of atmospheric CH4
products
S. Massart et al.
Title Page
Abstract Introduction
Conclusions References
Tables Figures
◭ ◮
◭ ◮
Back Close
Full Screen / Esc
Printer-friendly Version
Interactive Discussion
Discussion
P
a
per
|
D
iscussion
P
a
per
|
Discussion
P
a
per
|
Discuss
ion
P
a
per
|
surements for the second period to document if the IASI+TANSO experiment presents better profiles with the version v.2.0 of the TANSO data.
3.5.2 Comparison with TCCON
For each TCCON measurements we computed the model equivalent using the TC-CON a priori information and averaging kernel. To summarise the behaviour of each
5
experiment compared to the TCCON measurements, we then computed the monthly averaged differences between the model and the measurements.
Period before October 2011
The initial condition of all the experiments comes from the methane analysis of the DM which is known to have a negative bias of about 20 ppb in terms of total column
10
when compared to independent measurements (Massart et al., 2013). Therefore, at the beginning of the period, the FREE experiment underestimates xCH4 when compared to the measurements of the selected TCCON stations (black lines of Fig. 10). The underestimation varies from 10 to 30 ppb depending on the station without a clear difference between the stations in the southern or Northern Hemisphere. We previously
15
described an increase over time of xCH4in this experiment (Sect. 3.1 and Fig. 5a). This
increase allows reducing the bias against the TCCON measurements after the first few months and leads to a global bias close to zero on average between November 2010 and October 2011 (Table 3), that is consistent with the global bias found compared to the HIPPO data. But this increase is too large in the Northern Hemisphere and the
20
FREE experiment starts to overestimate xCH4 especially in JJA 2011 (e.g. black lines of Fig. 10 for Parkfalls). This leads the FREE experiment to have a bias of 2 ppb in this region on average before October 2011 (Table 3). Its bias is opposite over the tropics and over the Southern Hemisphere with a value of respectively−4 and −9 ppb. The
FREE experiment therefore fails on average at correctly representing the north–south
25
ACPD
14, 2553–2599, 2014Assimilation of atmospheric CH4
products
S. Massart et al.
Title Page
Abstract Introduction
Conclusions References
Tables Figures
◭ ◮
◭ ◮
Back Close
Full Screen / Esc
Printer-friendly Version
Interactive Discussion
Discussion
P
a
per
|
D
iscussion
P
a
per
|
Discussion
P
a
per
|
Discuss
ion
P
a
per
|
The assimilation of the TANSO data partially helps in reducing the biases with re-spect to the TCCON measurements on average with strong differences between the two versions of the data. In the Southern Hemisphere during the period from Novem-ber 2010 to SeptemNovem-ber 2011 the assimilation of version v.1 of the TANSO data helps in reducing the bias with respect to the TCCON measurements from −9 ppb for the
5
FREE experiment to−5 ppb for the TANSO experiment (Table 3). In the meantime the
assimilation of the SCIAMACHY data increases the bias up to−27 ppb. This means
that the version v.1 of the TANSO product provides more accurate information than the SCIAMACHY product in the Southern Hemisphere. This corroborates the conclusions drawn from the comparison with the HIPPO data. In the Northern Hemisphere, during
10
the same period, both SCIA and TANSO analyses underestimates the methane column compared to the TCCON data by respectively 24 and 13 ppb. The two experiments are nevertheless similar from July to September 2011 looking at specific TCCON stations (four last panels of Fig. 10, cyan – TANSO – and green – SCIA – lines). This indicates again a latitude-dependent bias in the TANSO experiment and not in the SCIA one.
15
The effect of the assimilation of IASI data combined with TANSO data was found to be mainly located in the tropical band where the IASI data are available (Fig. 5). When the IASI+TANSO analysis (red lines of Fig. 10) is compared to the measurements from stations situated north of 20◦N (Park Falls, Garmisch, Karlsruhe and Sodankyla) there is hardly any significant difference with the TANSO analysis. On average over
20
all the stations of the Northern Hemisphere, the bias is slightly increased by one ppb with the assimilation of the IASI data (Table 3). In contrast, for the stations situated south of 20◦S (Lauder and Wollongong), IASI has a positive impact as the bias of the
IASI+TANSO experiment (−2 ppb) is lower than for the TANSO experiment (−5 ppb)
and FREE experiment (−9 ppb). In the tropical region, the statistics are driven by the
25
ACPD
14, 2553–2599, 2014Assimilation of atmospheric CH4
products
S. Massart et al.
Title Page
Abstract Introduction
Conclusions References
Tables Figures
◭ ◮
◭ ◮
Back Close
Full Screen / Esc
Printer-friendly Version
Interactive Discussion
Discussion
P
a
per
|
D
iscussion
P
a
per
|
Discussion
P
a
per
|
Discuss
ion
P
a
per
|
discussed increase of the methane column in the IASI+TANSO experiment during this period (Sect. 3.4). This suggests that the IASI data are biased in this region during winter time.
Period after October 2011
During the period between SON 2011 and DJF 2011/2012, the bias of the FREE
ex-5
periment does not present large variations in time (black lines of Fig. 10). It is however globally higher than for the previous period with an average value of 10 ppb (Table 3). The behaviour of the SCIA experiment is similar, with nevertheless a larger bias of
−21 ppb. The TANSO experiment presents a different behaviour due to the change of
version of the assimilated product in October 2011. When the analysis underestimates
10
xCH4in September 2011 by almost 20 ppb for example at Park Falls, it slightly overes-timates it by 10 ppb in October 2011 and later (green line of Park Falls panel, Fig. 10). The same behaviour can be observed for the other selected stations of the Northern Hemisphere. On average the negative bias of about 13 ppb in the experiment assim-ilating the version v.1 of the TANSO product over the Northern Hemisphere leads to
15
a positive bias of 10 ppb in the experiment assimilating the version v.2.0 of the data. For the Southern Hemisphere there is also an increase of the bias between the two experiments from−5 ppb to 9 ppb. One can notice that for this second period, the bias
of the TANSO experiment is less latitude-dependent than the one of the first period, even if it is globally estimated at 10 ppb.
20
Compared to the previous period with the version v.1 of the TANSO data, the impact of the IASI data is here small over the tropics looking at the bias with respect to the TCCON data. But the impact is observed at highest latitudes both north and south with a reduction of the bias by more than 5 ppb north of 20◦N and by almost 4 ppb
south of 20◦S when compared the IASI+TANSO experiment to the TANSO experiment
25
ACPD
14, 2553–2599, 2014Assimilation of atmospheric CH4
products
S. Massart et al.
Title Page
Abstract Introduction
Conclusions References
Tables Figures
◭ ◮
◭ ◮
Back Close
Full Screen / Esc
Printer-friendly Version
Interactive Discussion
Discussion
P
a
per
|
D
iscussion
P
a
per
|
Discussion
P
a
per
|
Discuss
ion
P
a
per
|
Whole period
The TANSO experiment and accordingly the IASI+TANSO experiment showed a very different behaviour before and after October 2011. Their statistics over the whole period are therefore not relevant. For the FREE experiment, its behaviour was also different during the two periods. But it shows a constant characteristic which is a highest bias
5
over the Northern Hemisphere (and over the tropics) than over the Southern Hemi-sphere, with a difference of more than 8 ppb between them on average for the whole period. The statistics of the SCIA experiment are consistent over time with global bias of−23 ppb which is consistent but lower compared to the value of −37 ppb found by
Houweling et al. (2013) for 2009 when they directly compare the SCIAMACHY data
10
with the TCCON ones.
4 Conclusions
After the loss of Envisat in April 2012, the MACC-II delayed mode system for methane had to rely on the assimilation of the TANSO and the IASI products. In order to as-sess the impact of this change in the observing system, we have documented how
15
the assimilation of the products of each of these instruments constrains the model. First, the model without any assimilation of methane data showed a good behaviour even if the initial condition was negatively biased. It nevertheless overestimates the inter hemispheric gradient in June and July 2011 when compared to the HIPPO air-craft measurements. This was due to an underestimation of the methane concentration
20
in the Southern Hemisphere and an overestimation in the Northern Hemisphere, the difference between them being 8 ppb. This was confirmed when the experiment was compared against measurements from the TCCON network. The CH4 sources and
sinks are climatological in the model and the difference between them produces a pos-itive global budget. As a consequence, the free run model will have the same pospos-itive
ACPD
14, 2553–2599, 2014Assimilation of atmospheric CH4
products
S. Massart et al.
Title Page
Abstract Introduction
Conclusions References
Tables Figures
◭ ◮
◭ ◮
Back Close
Full Screen / Esc
Printer-friendly Version
Interactive Discussion
Discussion
P
a
per
|
D
iscussion
P
a
per
|
Discussion
P
a
per
|
Discuss
ion
P
a
per
|
methane growth each year and therefore it will deviate from the observed growth. Using data assimilation is thus needed in order to properly monitor atmospheric CH4.
SCIAMACHY provided dense and global measurements but only during daylight hours. This limited the amount of data to assimilate, especially during the winter period of each hemisphere. When the data were available, the largest impact of the
assim-5
ilation of the SCIAMACHY data was found during MAM and JJA at high latitudes in the Northern Hemisphere. There the assimilation decreased the methane concentra-tion from the surface up to 50 hPa. This allowed improving the north–south gradient in the analysis. But on the other hand, this also introduced a negative bias in the anal-ysis estimated to 30 ppb for the tropospheric CH4 concentration when compared to
10
HIPPO data and to 23 ppb for the column when compared to TCCON measurements. This bias may result from the degraded performance of the SCIAMACHY during the studied period. In the context of the DM system, the bias of the assimilated product could not be computed as there are no independent data in near-real-time to anchor a bias correction scheme. For consistency purposes, SCIAMACHY data have not been
15
bias corrected in this study. However, if this version of the SCIAMACHY product had to be assimilated again in the future for a reanalysis purpose, a bias correction would therefore have to be envisaged.
TANSO also provides measurements only during daylight hours. But compared to SCIAMACHY, the data are much less dense (about 3 times less) and cover only land
20
in version v.1 of the used product and partially the ocean in version v.2.0. Over land the density of the TANSO data is nevertheless sufficient to produce a similar constraint on the analysis as with the SCIAMACHY data thanks the background error correla-tions. Over tropical oceans, the density of SCIAMACHY data was too low to affect the analysis and to have any appreciable difference with TANSO. The change of version
25
for the TANSO product had a significant impact on the analysis. When the analysis of the first version has a global negative bias of −11 ppb on average compared to