*Corresponding author. Tel: +8801674763234
E-mail addresses: [email protected] (Md. Mazharul Islam) © 2013 Growing Science Ltd. All rights reserved. doi: 10.5267/j.msl.2013.01.036
Management Science Letters 3 (2013) 867–878
Contents lists available at GrowingScience
Management Science Letters
homepage: www.GrowingScience.com/msl
Enhancing lean supply chain through traffic light quality management system
Md. Mazharul Islama* and Md. Sadequr Rahmanb
Institute of Apparel Research and Technology (iART), Bangladesh Knitwear Manufacturers and Exporters Association (BKMEA), Planners Tower, Bangla Motor, Dhaka-1000, Bangladesh
C H R O N I C L E A B S T R A C T
Article history:
Received August 12, 2012 Received in revised format 3 January 2013
Accepted 30 January 2013 Available online January 30 2013
Lean is a continuous journey to grow and excel the company. Any company want to develop and cope with the world pace must adopt lean. However, in most of the organizations the management culture or people’s mentality is not so good to embrace change. They have predestined mind set where no change is normally allowed. Lean is a cooperative way of working that involves all departments and all personnel to work together in a team for the betterment of the entire company. Without providing fixed solution of any problem it suggests the best way that people willingly accept to do. Lean normally deals with highest quality, shorter lead time and lowest cost. In Bangladesh, most of the garment manufacturing companies are experiencing a massive quality problem. We describe a case where traffic light, a tool of lean quality system was adopted to a garment manufacturing company in Bangladesh. We also provide the charts to contrast the before and after scenario in detail, in order to illustrate the company benefits. After the traffic light system being implemented, the quality status was improved, production capacity was increased; significant days were saved that enhanced the lead time and thus strengthen the supply chain.
© 2013 Growing Science Ltd. All rights reserved.
Keywords:
Lean Manufacturing System Quality Management System (QMS)
Traffic Light System
Supply Chain Management (SCM) Lean Supply Chain
Lead Time
1. Introduction
Though the term lean was first coined by USA but it is nothing but the concept of Toyota production system in Japan and the system was basically pioneered by Eiji Toyoda and Taiici Ohno. Ohno (1988) basically tried to eliminate waste by establishing just in time (JIT) and KANBAN production system and ensuring the flow of raw materials to make production flow more strong. Lean manufacturing always focus on the voice of customer. Lean manufacturing see the value of a product or a service in terms of customer requirement. Customers normally evaluate the product or the service by looking at how well this is going to fulfill their requirements. The term ‘lean’ as Womack and Jones (1990) define it as a system that utilizes a less, in terms of all inputs, to create the same outputs as those created by a traditional mass production system while contributing increased varieties for the end customer. The most common goal of lean manufacturing is to improve quality, eliminate waste, reduce time, and reduce total costs so that the supply chain could be more agile to produce and ship the garments with a shortest lead time.
Lead time is the total time required to order reception, processing, manufacture and to deliver the product to the customer. Christopher (1998) defines lead time as the combination of logistics lead time and the customer’s order cycle time. Logistics lead time is the time need to complete the process from goods to inwards to delivered product and the order cycle time is the period the customer is prepared to wait for delivery. A more conventional definition of lead time in the supply chain management realm is the time from the moment the customer places an order to the moment it is received by the customer. In the absence of finished goods or intermediate (work in progress) inventory, it is the time it takes to actually manufacture the order without any inventory other than raw materials.
Supply chain is that which deals with lead time. A supply chain is a network of facilities that procure raw materials, transform them into intermediate goods and then final products, and deliver the products to customers through a distribution system. Supply chain management (SCM) is the process that is used by a company to ensure that its supply chain is efficient and cost effective. Ketkar and Vaidya (2012) define supply chain management as the management of the flow of materials, information and funds across the entire supply chain including the suppliers, producers, assemblers, distributors, warehouses, retailers, and the ultimate customers. According to Koprulu and Albayrakogl (2007), the ultimate goal of SCM is to meet customers’ demand more efficiently by providing the right product, in the right quantity, at the right location, on the right time, and in the right condition.
A lean supply chain is the system that incorporates lean philosophy into the whole supply chain for the effective and efficient use of all resources. Lean supply chain ensures the exact amount of goods or services at the exact location within the time constraint. It has been noted by Martin Christopher et al. (2006) that the lean SCM is not just time-to-market for new product introductions but time-to-respond in terms of being able to meet the needs of time-sensitive customers. They also states that, supply chain strategy should be based upon a careful analysis of the demand and supply characteristics of the various product or markets served by a company. Mackee and Dr. Rose define lean SCM as an operational and strategic management philosophy that utilizes internet enabling technologies to effect the continuous regeneration of suppliers and service partner’s network.
It is also important for a lean SCM to ensure the quality of the product through the whole supply chain network. Womack and Jones (1996) describe about incorporating Six Sigma Quality Control to lean management system in a way to bring production processes under control by reducing the defect rate and help foster the lean goal of flow in the supply chain encouraging continuous reexamination of the value stream for ways to eliminate waste. Now a day’s customers always keen to get the better quality ones. The quality is therefore defined as a matter of how much valuable the product or service to the customer not to the manufacturers. Therefore quality management system is a big issue for the factories to sustain for a long time. Here in Bangladesh the garments factories are practicing at about 15 to 20 percent second quality product which is a big waste for the factories and it adversely affect the profit margin of the factory. And at the end of the day the factory is going to be a loser. So we have to put the glasses of the customer in defining quality.
Md. Mazharul Islam and Md. Sadequr Rahman / Management Science Letters 3 (2013)
869
implemented in a garment industry in Bangladesh. The main goal of this paper is to show how traffic light system can reduce the quality faults, improve the lead time and thus strengthen the supply chain.
In the recent years, many literatures have written from various points of view and much research has been performed on lean manufacturing and lean tools and techniques for different industries. Recently in a quarterly report TECHNOPAC (2011) has stated about the lean approach to various processes, and managing resources for the apparel manufacturing industries. The report also described the various benefits of lean along and the management roles to sustain the system as well. Mahapatra and Mohanty (2007) studied about implementing lean manufacturing in continuous process industry. They also noted some tools and techniques that can be implemented in the factories. Farhana and Amir (2009) studied in the nine garment manufacturing companies which were selected purposively to ensure the best possible scenario of lean practices in Bangladesh. Abdulmalek and Rajgopal (2006) described a case where lean principles were adapted for the process sector for application at a large integrated steel mill. Value stream mapping was the main tool used to identify the opportunities for various lean techniques. They were also describe a simulation model that was developed to contrast the ‘‘before’’ and ‘‘after’’ scenarios in detail, in order to illustrate to managers potential benefits such as reduced production lead-time and lower work-in-process inventory. Ravikumar et al. (2011) also describes the application of Value Stream Mapping (VSM) and Single Minute Exchange of Die (SMED). Existing state production floor was modified by using VSM efficiently to improve the production process by identifying waste and its causes. Ripon and Paul (2011) worked with the layout design where existing layouts have been studied and then layouts are proposed to enhance the production system. Value Stream Mapping (VSM) was used as a basic lean manufacturing tool and some cellular manufacturing philosophies to find out the improved level of performance and productivity particularly in the garments sector of Bangladesh.
In the recent year various models have been proposed by different researchers about strengthening the supply chain. Koprulu and Albayrakogl (2007) developed an analytical hierarchy process (AHP) model that an apparel company can use for the selection of supplier. In the apparel sector now a day, demand is becoming more unpredictable and the supply chain is becoming more uncertain to predict or forecast. Alper Sen (2008) described about the recent trends across the fashion supply chain in the US using industry-wide data, articles from business journals, industry reviews and extensive interviews with an apparel manufacturer in California, and a major US department store chain to describe the current operational practices and how the industry is restructuring itself during the transition, focusing at the apparel manufacture and retail segments of the supply chain. In this unpredictable situation many researchers like Christopher et al. (2006) acknowledged about the supply chain agility because it is concerned primarily with responsiveness. It is about the ability to match supply and demand in turbulent and unpredictable markets. In essence it is about being demand-driven rather than forecast-driven.
Though in many literatures on lean quality system, researchers have emphasized on mistake proofing system and a very few have addressed the traffic light system. Habidin et al. (2012) examined and then proposed a Structural Equation Model to study the relationship between Lean Six Sigma practices and organizational performance in order to improve the quality level in Malaysian automobile industries. Ratnayake et al. (2009) implemented cellular manufacturing with mistake proofing system in the industry for quality controlling where a team of operators focuses mainly on one part of the garment, helped when addressing most of the problems identified in the root cause analysis. A quarterly report of Technopac (2011) has stated about the importance of lean system in ensuring the quality of the product in garments industry.
This paper will show how traffic light system can reduce the quality faults, improve the lead time and thus strengthen the supply chain. The system was implemented at the X Composite Industry Ltd. But we are keeping the factory name as anonymous because the factory is not willing to ascribe it into this report. Data has been collected for several months before and after the system being implemented. The results are also shown here in this paper which tells us about the improvement of the productivity and quality level. Lean manufacturing is normally known to reduce the lead time. This paper will show the quality improvement in terms of lead time and supply chain because about 5% production capacity has been increased through quality improvement. We shall also look into some quantified benefits of lean manufacturing as well where the principles of lean were the prime mover.
current state situation and performance that is being achieved by the factory. The third section of the paper will represent the scenario after implementing the traffic light system. Finally after discussing the results and findings, it will draw conclusions by comparing the status before and after the traffic light system being implemented.
2. Methodology
The study was carried out in a Composite Knit factoryto improve quality & production level and to reduce waste. A Kaizen process was performed to find the way of continuous improvement. The factory consists of 37 lines having a production capacity of about 15000 pieces of garments per day. Most of the orders are for polo t-shirt. The factory is located at the Hemayetpur, Savar, near Dhaka, The capital of Bangladesh. First the company was assessed and analysis was carried out to find the current state map. Then a training module was developed to train the different level of personnel including the workers, supervisors, line quality personnel, quality controllers, production people and management personnel. After being trained all the associated personnel the traffic light system has been implemented in a single production line as a pilot basis considering that the global change will be carried out if the situation goes better after the traffic light system being implemented than before. The paper will address several quality points including alter percentage, rejection rates, rejection from finishing section etc. By examining the existing and future quality state finally this paper explores the benefits of implementing traffic light quality system in terms of lead time, cost and thus the supply chain improvement.
Traffic light quality system works in a similar fashion the transportation traffic light system works. Like the transportation system it includes three quality signal cards: green, yellow and red. In the production line each worker is characterized by a card and the card is being hanged above his/her head. Green is for good quality, yellow is for warning condition and red stands for stopping the production due to quality fault. Seven piece quality checking system has been implemented and the quality controllers were instructed to check the quality status every two hours interval and collect data of each worker on a regular basis. When a worker produces quality product with zero defect, he or she is characterized by a green card. A worker who does a single fault out of the checked seven pieces, he or she is warned by a yellow card that indicates that he or she should be more careful about quality for the next time. But when any worker who does multiple faults, a red card is hanged above his or her head that indicates that this worker is producing several faults that should be corrected and an extra care should be taken to this worker. The extra care may be in a way that he or she should be trained for that operation or if there have any problem, could be solved. This is not a way of pushing the workers but to motivate them so that they are willing to do the quality at the first time they make it. Based on the performance the workers and the production lines are scored by a common scoring system. The system offers that, the best worker and the best line that scored highest should be honored by the management and some incentive should be given to them for their outstanding performance. The system also offers that, they should also be honored bybeing put a best quality badge for the whole month so that they could feel proud and all other workers could inspire to achieve the highest quality level.
3. Current state
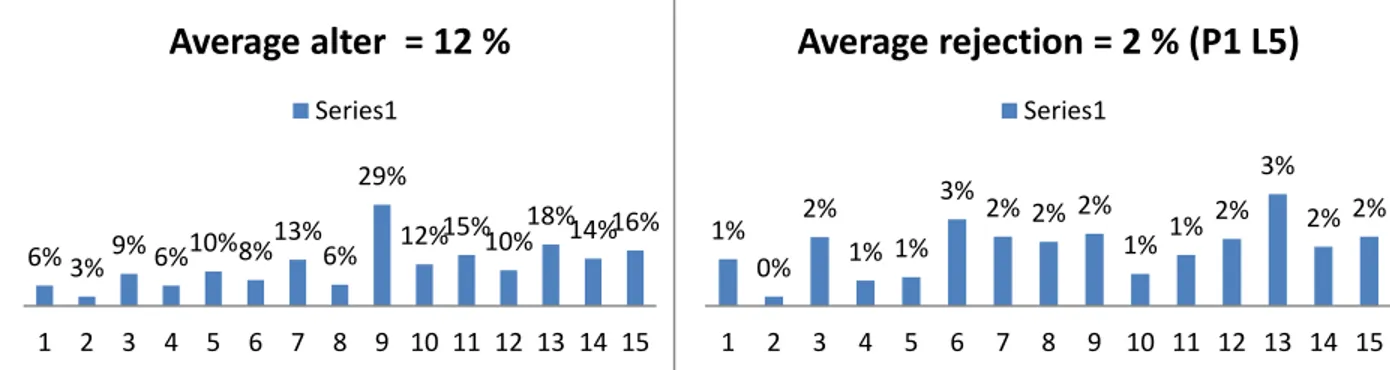
First the existing situation is noted and the alter percentage is shown in the following chart. From the chart it is shown that the alter percentage is about twelve percentage.
Fig. 1. Alter percentage at current state Fig. 2. Rejection percentage at current state
6% 3%9% 6%10%8%
13% 6%
29%
12%15%10%18%14%16%
1 2 3 4 5 6 7 8 9 10 11 12 13 14 15
Average
alter
=
12
%
Series1
1% 0%
2% 1% 1%
3%
2% 2% 2%
1% 1%
2% 3%
2% 2%
1 2 3 4 5 6 7 8 9 10 11 12 13 14 15
Average
rejection
=
2
%
(P1
L5)
T 2 o s 4 A c c r I c t s s p s The rejection 2%. Alter fro only eight lin shows that th
4. Future sta
After analyzi collected for chart. It clear rate becomes
Fig. 4. Alter
In a similar f collected wh the average r stored and it system the av pieces with a shown below
0 10 20
Aug Sep Oc
t
Nov Dec Jan Fb
AJI
n rate is also om finishing nes were obs he average nu
ate
ing the curre about severa rly indicates s only about 4
r percentage at fu
fashion for th ich is shown rejection rate is seen that verage numb a reduction o w.
Fig. 6. No.
F
e
b
Aug Sep Oc
t
Nov Dec Jan Fe
b
Aug
FRM-1
Md. Mazhar shown in an g table is also erved and th umber of alte
Fig. 3. No
nt state situa al months. Th
that the alte 4% from 12%
uture state (averag
he whole fiv n in the follo e goes down
alter at finis ber of alters p of 36 pieces o
. of alters fro
49
Line ‐ 1
L
A
Aug Sep Oc
t
Nov Dec Jan Fe
b
Aug Sep Oc
t
FRM-2 PO
rul Islam and Md. S nother chart t o collected a he data was ta
er for each li
o of alters fro
ation traffic l he alter perc er percentage %.
ge alters = 4%)
ve months pe owing chart. to only 0.5% shing area is per day per li of garments p
om finishing 54 69 Line ‐ 2 Line ‐ 3
Average
alt
Oc
t
Nov Dec Jan Fe
b
Aug Sep Oc
t
Nov Dec
OLO-1 POLO
adequr Rahman / Ma that indicate and shown he
aken as a num ne is about 5
om finishing
light system centage of ea e drastically
Fig. 5. Re
eriod the reje The data cle % from 2%.
also reduce ine at finishi per day for e
section at fu
88 87
Line ‐ 4
Line ‐ 5
ters/day
/
Series1
Dec Jan Fe
b O-2 0 1 2 Au g Se p Ot
anagement Science Le s that the rej ere in anothe mber of piec 58 pcs per da
section at cu
was implem ch month for
goes down a
ejection percentag
ection rate o early shows t
Alter came d drastically ing section w each line. Mo
uture state (A
46 25 Line ‐ 6 Line ‐ 7
/line
=
58
p O c t No v De c
Jan Feb Au
g Se p Oc t N AJI FR
etters 3 (2013)
jection rate i er chart. Wit ces for each l ay.
urrent state
mented in five r each floor i at a good rat
ge at future state
f each month that it follow back from f y. After impl was reduced t
onthly alter i
Average no =
48
‐ Line ‐
8
pcs
N ov De cJan Feb Au
g Se p Oc t No v D RM-1 FRM
s around 2-3 thin the thirty line. The foll
e floors and d is shown in t te and the av
(average rejectio
h for each fl ws a downwa finishing sect ementing the to only 22 pi in pieces for
22 pieces)
D
ec
Jan Feb Au
g Se p Oc t No v De c J M-2 POLO-87 3% averaging y seven line lowing figure
data has been the following verage alter a
ons = 0.5%)
loor was also ard trend and tion was also e traffic ligh ieces from 58
each floor i
5. Findings (data based on the month of September, floor: FRM-2)
5.1 Days saved from alter
At the table below data is provided for the FRM-2 floor which consists of 8 lines. We can see that about 17025 minutes or the production time of 946 garments were saved from the improvement of alter percentage. Considering the average daily production of 383 pieces per line per day, it can easily be said that about 0.31 day has been saved from the improvement from each line. It also resembles that, about 12 days production of a line has been saved for the whole factory from 37 lines.
Table 1
Days saved from alter percentage reduction
Production Alter % Alter body Time/alter (min) alter/body No of Total alte saved Time Improvement
Extra production
(pieces) Days saved from each line
Days saved from the factory(37
lines)
76696 12% 9203 2 1.5 13804 27609
17025 946 0.31 11.47
AFTER implementation
76696 4.60% 3528 2 1.5 5292 10584
5.2 Days saved from rejection
From the improvement in the rejection area it is seen that 1150 pieces garments were saved from the 8 lines of FRM-2 floor. That means about 0.38 day was saved for each line through the month and the total save was about 14 days (equivalent to one line) for the whole factory.
Table 2
Days saved from rejection percentage reduction
Production Rejection
(%)
Rejected body from 8 lines
Days saved from each line
Days saved from the factory (37 lines)
76696 1.50% 1150 0.38 14
5.3 Days saved from loss reduction due to alter rectification
The improvement from the loss of alter that cannot be rectified was also significant. From the previous history it was seen that about 10% alters were failed permanently. From the table below, it is seen that about 567 pieces garments were saved from the 8 lines of FRM-2 floor. Therefore, about 0.19 day from each line and about 7 days production of one line from the whole factory was saved.
Table 3
Days saved from loss reduction due to alter rectification
Production Alter (%)
Alter/m onth
Rejection (%)
Rejected body
Saved (pieces) from 8 lines
Days saved from each line
Days saved from the factory (37
lines)
76696 12% 9203 10% 920 567 0.19 6.85
4.60% 3528 10% 353
5.4 Days saved from alters come back from finishing section
From the improvement done in the finishing area it is clear that the total improvement from the 8 lines was 288pieces of garments which indicates that about 0.40 day production has been saved from each line with a total save of about 14 days (equivalent to one line) for the whole factory.
Table 4
Days saved from alters come back from finishing section
Rejection (before) from finishing/day/lin
e(pieces)
Rejection (after) from finishing/day/line(p
ieces)
Saved quantity/
day/line
Monthly save/line
Time/Alter
(min) Alter/body Total time to
repair Total pieces saved
Days saved from each
line
Days saved from the factory (37
lines)
Md. Mazharul Islam and Md. Sadequr Rahman / Management Science Letters 3 (2013)
873
6. Results
From the above tables we can realize that a significance change has been carried out from different quality parameters. At the table below the summary of the above improvements is given. Here all the improvements are shown in terms of days saved. Reckoning all the improvements from different parameters it is seen that about 1.35 days production was saved from each line and about 47 days production of a line was saved from the whole factory. Considering 25 production days per month, it clearly depicts that about 2 lines monthly production was saved from the whole factory. The figure below depicts it clearly that the monthly capacity before implementing the traffic light system was equivalent to 925 days production of one line for a month whereas after the system being implemented it reduced to 878 days with animprovement of 47 days production capacity.
Considering the average daily production rate of 383 pieces of polo shirts, the total production saved from the factory was about 17875 pieces and taking $3.50 as the average price of a polo shirt, the total savings in terms of money for the month of September comes $62,000 or about 45,00,000 BDT.
Table 5
Total days saved after implementing the traffic light system
Summery (equivalent to a line) taking existing 40% efficiency
Days saved from alter
Days saved from rejection
Days saved from alter
to rejection
Days saved from finishing
Total days saved
Daily production
(pieces)
Saved production
Approximate cost savings ($)
For 37 lines 11.41 13.88 6.84 14 47 383 17875 62,000
For each line 0.31 0.38 0.18 0.40 1.26 383 482 1700
7. Conclusion
Traffic light system is a system that can be implemented in any garment manufacturing company and it will help to improve the quality status, reduced the cost, improve the lead time and thus strengthen the supply chain performance without increasing the resource.
In this study, Traffic light quality system was implemented in a garment manufacturing company and after being implemented, quality improvement result was calculated in terms of days saved through the improvement. We know save of days is nothing but increasing the lead time and the more the lead time the better the supply chain performance is. Eventually production capacity was increased and cost was also reduced.
Implementation of the traffic light system for the global change was also proposed to the factory management to get the ultimate benefit. But to do so, all the players in the whole supply chain should work together at the same pace.
From this study we have seen that after implementing the lean traffic light system the quality status was improved and thus supply chain was strengthen through the improved lead time. So it can be said that, it is an urgent for the factories to adopt lean in the supply chain.
References
Abdulmalek, F. A., & Rajgopal, J. (2007). Analyzing the benefits of lean manufacturing and value
stream mapping via simulation: A process sector case study. International Journal of production
economics, 107(1), 223-236.
Chakraborttya, R.K., & Paul, S.K., (2011). Study and implementation of lean manufacturing in a garment manufacturing company: Bangladesh perspective. Journal of Optimization in Industrial Engineering, 4(7), 11-22.
Current state = 925 days
Future state = 878 days Days saved = 47 days
Christopher, M. (1998). Logistics and supply chain management: strategies for Reducing Costs and Improving
Service. 2nd ed., Financial Times/Pitman Publishing, London, p 168.
Christopher, M., Peck, H., &Towill, D. (2006). A taxonomy for selecting global supply chain strategies.
International Journal of Logistics Management, 17(2), 277 – 287.
Ferdousi, F., & Ahmed, A. (2009). An Investigation of Manufacturing Performance Improvement through Lean Production: A Study on Bangladeshi Garment Firms. International Journal of Business and
Management, 4 (9), 106-116.
Habidin, N.F., Yusof, S.M., Omar, C.M.Z.C., Mohamad, S.I.S., Janudin, S.E., & Omar, B. (2012), Lean six sigma initiative: Business engineering practices and performance in Malaysian automotive industry. IOSR
Journal of Engineering (IOSRJEN), 2(7), 13-18.
Ketkar, M., & Vaidya, O. S. (2012). Study of emerging issues in supply risk management in India.
Procedia-Social and Behavioral Sciences, 37, 57-66.
Koprulu, A., & Albayrakoglu, M. M. (2007). Supply chain management in the textile industry: A supplier selection model with the analytic hierarchy process. Proceedings of the Ninth International Symposium on
the Analytic Hierarchy Process (ISAHP 2007). (C. Garuti (ed.)). Pittsburgh, PA: RWS Publications.
Mackee, R., & Dr. Rose, D., (2012). From Lean manufacturing to supply chain: a foundation for change, Lean supply chain management in the fashion industries, Lawson Whitepaper, Website version
(swe.lawson.com/.../lawson_whitepaper_2_a4_lowres.pdf)
Mahapatra, S.S, & Mohanty, S.R. (2007). Lean manufacturing in continuous process industry: an empirical study. Journal Scientific and Industrial Research, 66 (January), 19-27.
Marudhamuthu, R., Krishnaswamy, M., & MoorthyPillai, D. (2011). The development and implementation of lean manufacturing techniques in Indian garment industry. Jordan Journal of Mechanical and Industrial
Engineering, 5(6), 527-532.
Mason-Jones, R., & Towil, D. (1999). Total cycle time compression and agile supply chain. International
Journal of Production Economics, 62(1/2), 61-73.
Ohno, T. (1988). The Toyota Production System: Beyond Large Scale Production. Productivity Press, Portland, Oregon, Productivity Press.
Ratnayake, V., Lanarolle, G., Perera, C., & Marsh, J. (2009). Cellular lean model to reduce WIP fluctuation in garment manufacturing. International Journal of Six Sigma and Competitive Advantage, 5(4), 340-358. Sen, A. (2008). The US fashion industry: A supply chain review. International Journal of Production
Economics, 114 (2), 571–593.
Technopac (2007). A Quarterly Report on Lean Manufacturing – The way to Manufacturing Excellence,
Outlook, (Website version).
Womack, J. P. (1990). Machine that changed the world. Scribner.
A Appendices: A. Line C. Sum FLOOR AJI FRM-1 FRM-2 POLO-1 POLO-2 TOT : e performan mmary Repor MONTH Aug Sep Oct Nov Dec Jan Feb Aug Sep Oct Nov Dec Jan Feb Aug Sep Oct Nov Dec Jan Feb Aug Sep Oct Nov Dec Jan Feb Aug Sep Oct Nov Dec Jan Feb TAL Md. Mazhar nce board:
rt (for 7 mo
Saving from Alter 22213 110149 226045 250394 163577 185623 161713 22213 57400 191426 128843 146746 130107 34652 72041 241593 236244 164213 217495 207917 19547 75793 173232 85432 119924 135439 131503 6219 39913 167049 123653 128065 95502 113859 4176373
rul Islam and Md. S
nths)
m Saving fro
Rejection 126616 280880 586849 589161 436204 479028 453152 126616 150083 602640 262457 423305 404600 119952 175235 682146 637063 396377 498958 479808 59976 238610 668184 386862 370353 424510 399840 66640 174623 508409 437939 445444 364203 306544 12092520
adequr Rahman / Ma B om n Loss Du Alter Re 3332 16522 33906 37559 24536 27843 24256 3332 8610 28714 19326 22011 19516 5197 10806 36239 35436 24632 32624 31187 2932 11369 25984 12814 17988 20315 19725 9329 5987 25057 18548 19209 14325 17078 0 62645
anagement Science Le
B. Traffic l
ue To ectify
Alter Back Finis
20 0
23 195
68 218
90 185
65 195
35 223
69 173
20 0
00 195
40 191
64 213
19 191
60 147
79 0
62 175
90 218
66 186
20 181
42 197
75 147
21 0
91 175
49 121
48 194
85 170
58 110
54 472
9 0
70 183
73 182
80 182
98 182
53 120
89 578
63 4794
etters 3 (2013)
ight system
Come From shing
G.T
0 1
5922 7
8579 13
5703 14
5477 10
3910 11
3708 10
0 1
5922 4
923 12
3248 7
923 9
7274 8
0 2
5930 5
8579 15
6592 14
261 9
7254 12
7274 11
0 1
5930 6
856 12
4970 7
0598 8
0940 8
219 7
0 8
3926 4
2784 11
2784 9
2784 9
0587 7
881 6
D. End line inspection report
END LINE INSPECTION REPORT
Date: Style No: Line No: Unit:
Defect Description Time Total Comments
9-11 11-01 02-04 04-07
Lab
e
l
Material / Printing Damage
Missing
Wrong size Sainted
Wrong Style Code
Wrong Size Code
Cut Damage
Poor Stitching
Attach Wrong Placement Main Label
Size Label
Wash Care Label
Flag Label
S
h
ou
lder
/N
ec
k
/ C
o
ll
ar
/ Pl
ack
e
t
Out of Shape
Open Seam
Broken Stitch
Loose / Tight Stitch
Skip / Miss stitch
Needle Hole
Un- cut Thread
Oil / Stain Mark
Un-even seams / attach
Wrong SPI
Puckering
Waviness
Cut Damage
Materials Damage
Over Lapping
Shading
Shoulder Unbalance
Slanted
Front stripe not matched
Puckering - Placket
S
le
e
ve /Side
Seam
/Butt
o
n
Out of Shape
Open Seam
Broken Stitch
Loose / Tight Stitch
Skip / Miss stitch
Needle Hole
Un- cut Thread
Oil / Stain Mark
Un-even seams / attach
Sleeve / Body Shading
Front / Back shading
Wrong SPI
Puckering
Waviness
Cut Damage
Materials Damage
Un match side seam
Un bal. sleeve Length
Total Alter
Total Spot
Total Reject
Md. Mazharul Islam and Md. Sadequr Rahman / Management Science Letters 3 (2013)
877
E. In line checking form
In Line Checking Form (Standard Sample size 7 pieces) Unit:
Buyer: Style: Size: Color: Date:
No Defect - Green Defect (1) -Yellow Defect (2 and Above) - Red M/C Breakdown-Blue
Style Change - Orange
Operator Name and Card
No.
Time Zone Total
Defects
9 am-11am 11am-1pm 2pm-4pm 4pm-7pm
Operatio n name
Defec t Qty
Defec t Name
Operatio n name
Defec t Qty
Defec t No
Operatio n name
Defect Qty
Defec t Name
Operatio n name
Defec t Qty
Defec t Name
F. Operator quality performance sheet
OPERATOR QUALITY PERFORMANCE SHEET
Sample Size: 7 pcs per Check
UNIT: LINE: OPERATOR: ID: MONTH:
No Defect = Green, 1 Defect = Yellow Mark, 2 and Above Defect = Red, Style Change = Orange, M/C Problem = Blue
Date Buyer/Style Operation Time Comments
9-11
11-01
02-04
04-07
Total Signature
1
2
3
4
5 to 31